Preview of August 2022 Newsletter
Editor’s Note
“I do not think the U.S. is currently in a recession. There are just too many areas of the economy that are performing too well.” — Jerome H. Powell
A month ago, the headlines were shouting, “Stocks Post Worst First Half of the Year Since 1970,” but the negative tone shifted when the newspapers declared, “Markets Post Best Month Since 2020,” as equities rebounded sharply in July. Of course, little changed from June, when the Dow Jones Industrial Average plunged 2215 points (6.7%), to July, when the popular benchmark soared 2070 points (also 6.7%).
We take that back. Something big did change as investors on Main Street became much more negative on the prospects for stocks AFTER the lion’s share of the June plunge had already taken place. Alas, the Sentiment Survey from the American Association of Individual Investors hit its sixth-most Bearish level ever the third week of June, trailing only four readings near the bottom of the Gulf War I selloff in 1990 and the March 5, 2009, tally that marked the low point for stocks during the Great Financial Crisis.
Wall Street professionals were equally pessimistic, with the BofA Global Fund Manager Survey out the morning of July 19 showing dire levels of investor pessimism, expectations for global growth and profits at alltime lows, cash levels the highest since 9/11 and equity allocations the lowest since Lehman. Further illustrating why it can pay handsomely to be greedy when others are fearful, the S&P 500 jumped 7.8% from July 18 to July 31.
Not surprisingly, given that many were caught wrongfooted, one strategist was quick to proclaim on the front page of The Wall Street Journal, “It seems like the market has prematurely declared victory over inflation. It is completely out of step with what the Fed and Chair Powell laid out last week,” suggesting that stocks should not have rebounded from the depths. Obviously, anything can happen as we move forward, and August is not off to a grand start, but one cannot argue that an equity market rally is inappropriate without conceding the prior selloff might not have been justified either. After all, the Bear Market experienced by the average stock in Q1 and Q2 discounted at least some bad news in regard to inflation, the Fed, the economy and corporate profits.
Further, we are not sure what this pundit thought the Fed laid out, given that the Fed Funds rate, as expected, was hiked by 75 basis points in July, following a boost of the same size in June and bringing the lending rate to 2.5%. Mr. Powell explained, “These rate hikes have been large, and they’ve come quickly. And it’s likely that their full effect has not been felt by the economy, so there’s probably some significant additional tightening in the pipeline.”
No doubt, many worry that a less-accommodative Fed is bad for stocks, despite historical evidence, on average, to the contrary, but the futures market was pricing in a 3.25% to 3.50% year-end Fed Funds rate at both the end of June and the end of July. Some might argue that with the consumer price index jumping by 9.1% in June, the Fed will need to be more aggressive in trying to lower inflation, but food and energy prices have lately come down considerably, the housing market has cooled and jobless claims have ticked up. As Mr. Powell said, “Are we seeing the slowdown in economic activity that we think we need? There is some evidence we are, at this time.”
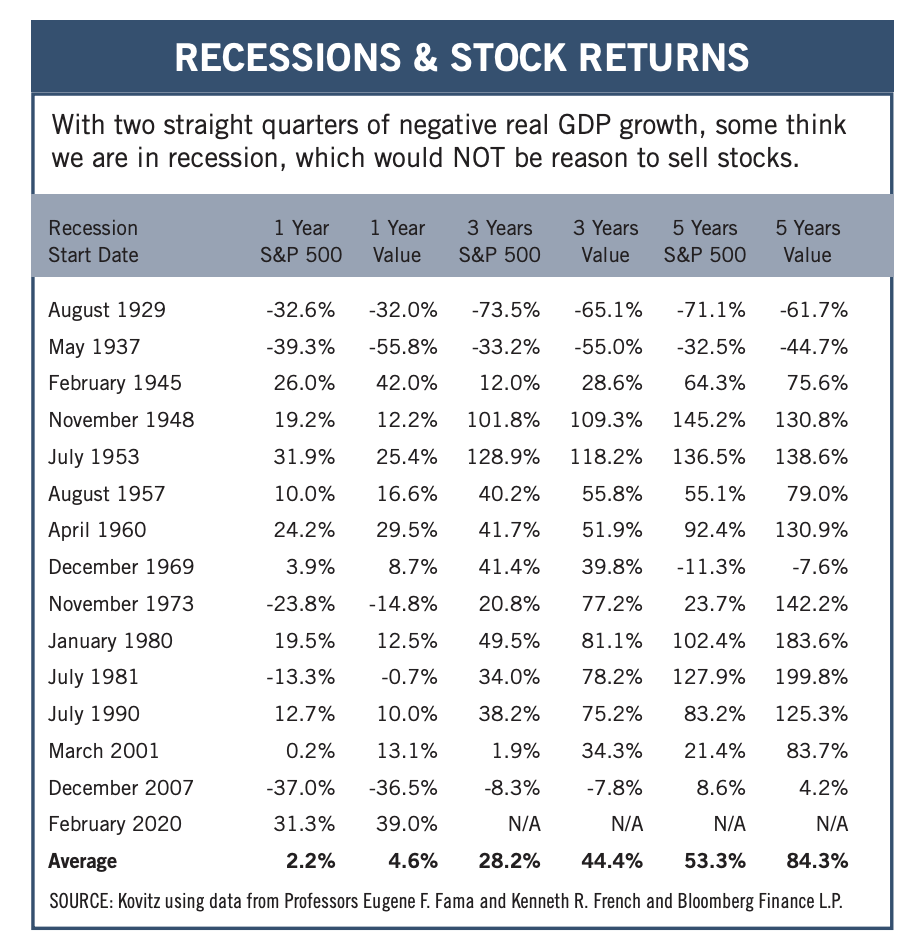
The jury is out on whether the Fed will be able to engineer a so-called soft landing, but economists cannot even agree on whether the respective Q1 and Q2 GDP growth tabulations of -1.6% and -0.9% mean that the U.S. is in recession. Mr. Powell seems to think the answer is no, and we agree, pointing to strong nominal (current dollar) domestic GDP growth of 6.6% in Q1 and 7.8% in Q2, an historically low unemployment rate and solid corporate profit and dividend growth over the first half of the year
We’ll let others debate recession semantics, as we think any economic contraction will be mild and we like the long-term prospects of our holdings, with TPS Portfolio trading for a forward P/E ratio of 11 and yielding 2.7%.
Graphic Detail
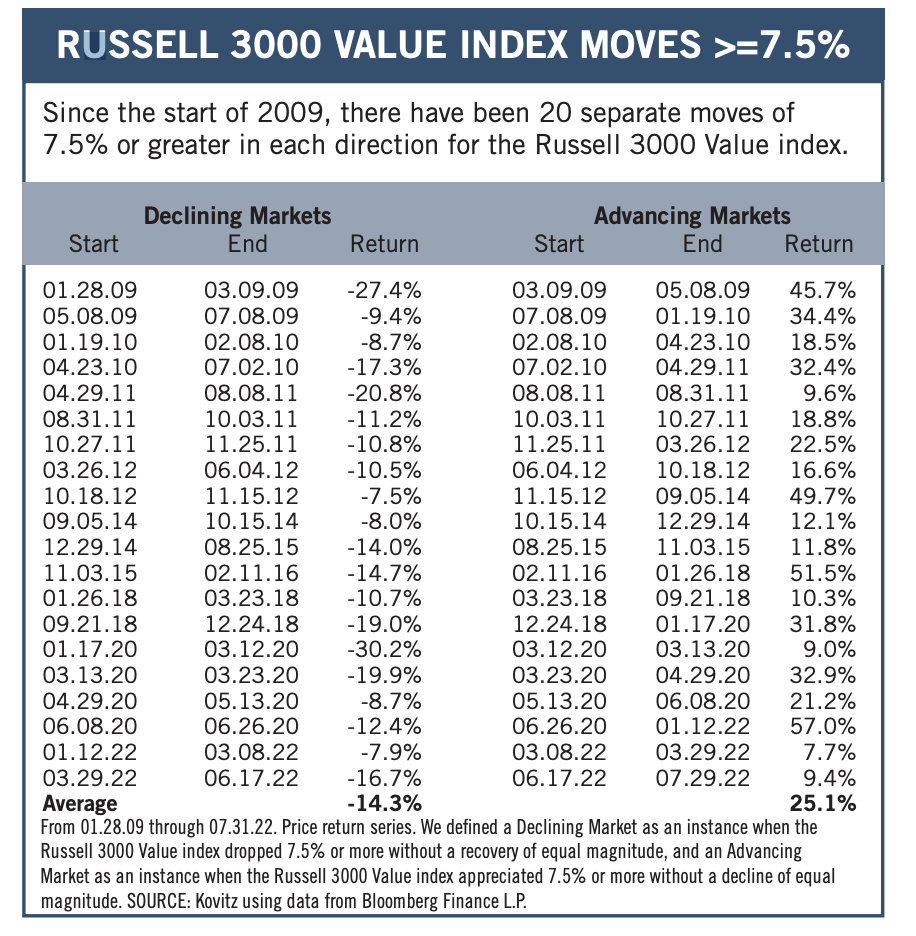
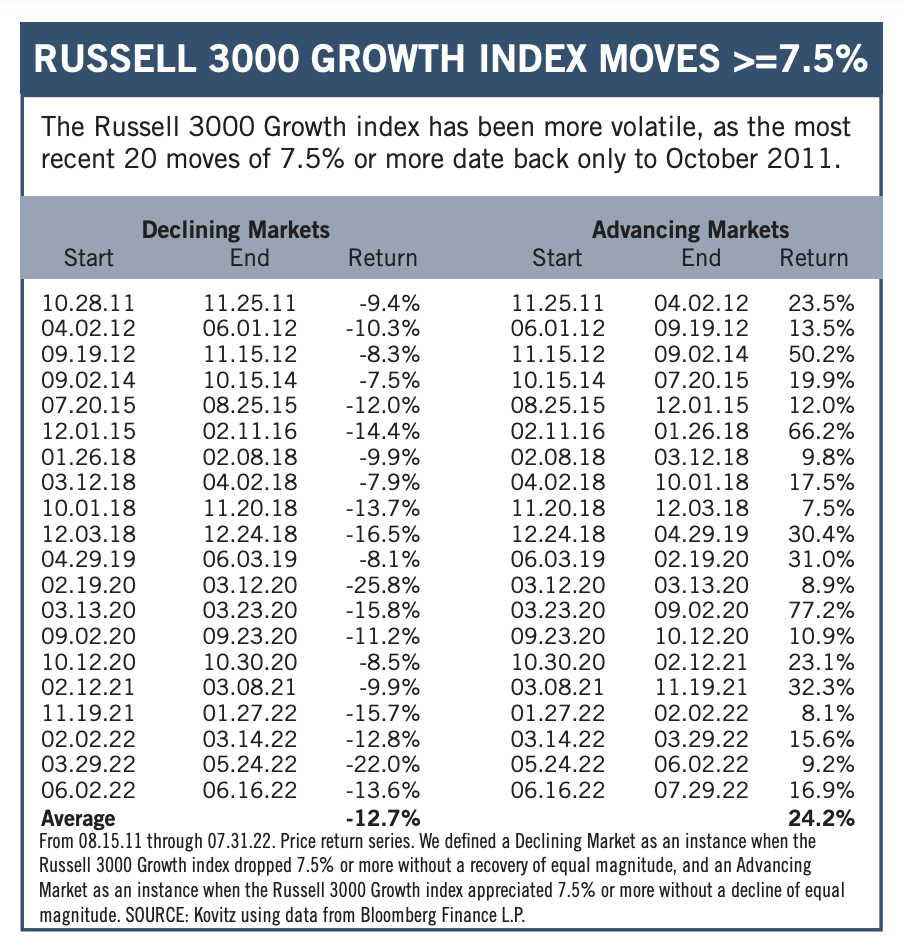
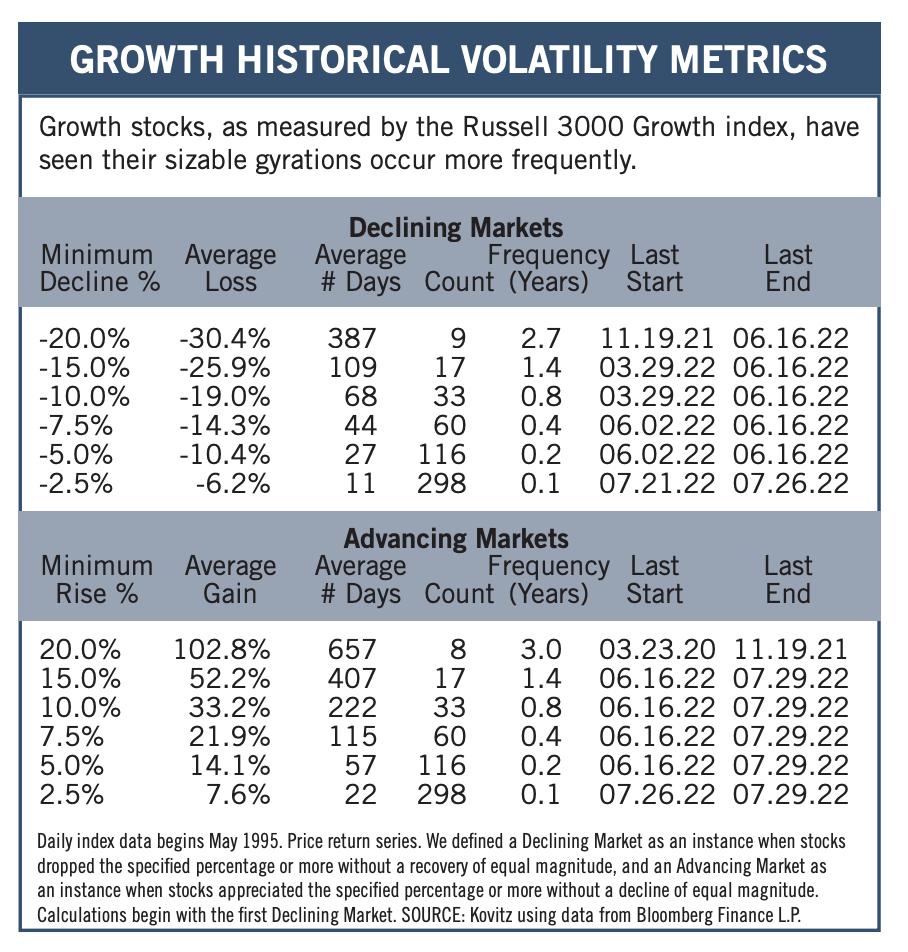
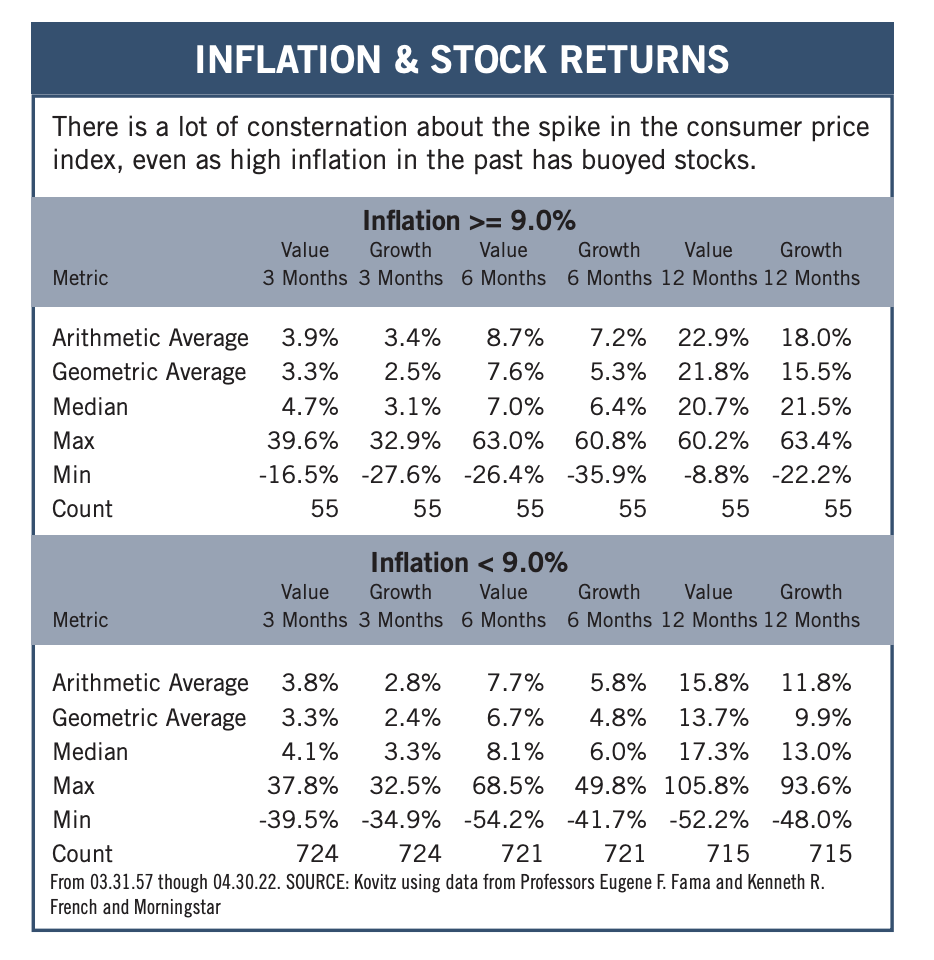
Value & Growth Volatility
Equities have proved very rewarding over the long term, but the road to prosperity has long been filled with potholes. Indeed, history is littered with numerous selloffs, downturns, pullbacks, corrections and even Bear Markets. Of course, there have been an equal number of advances, upturns, rallies and Bull Markets, with the magnitude of the gains from the journeys northward, on average, dwarfing the losses from the trips south. Volatility will always be part of the process, but the Value and Growth vehicles do not always traverse the same route.
Graphic Detail
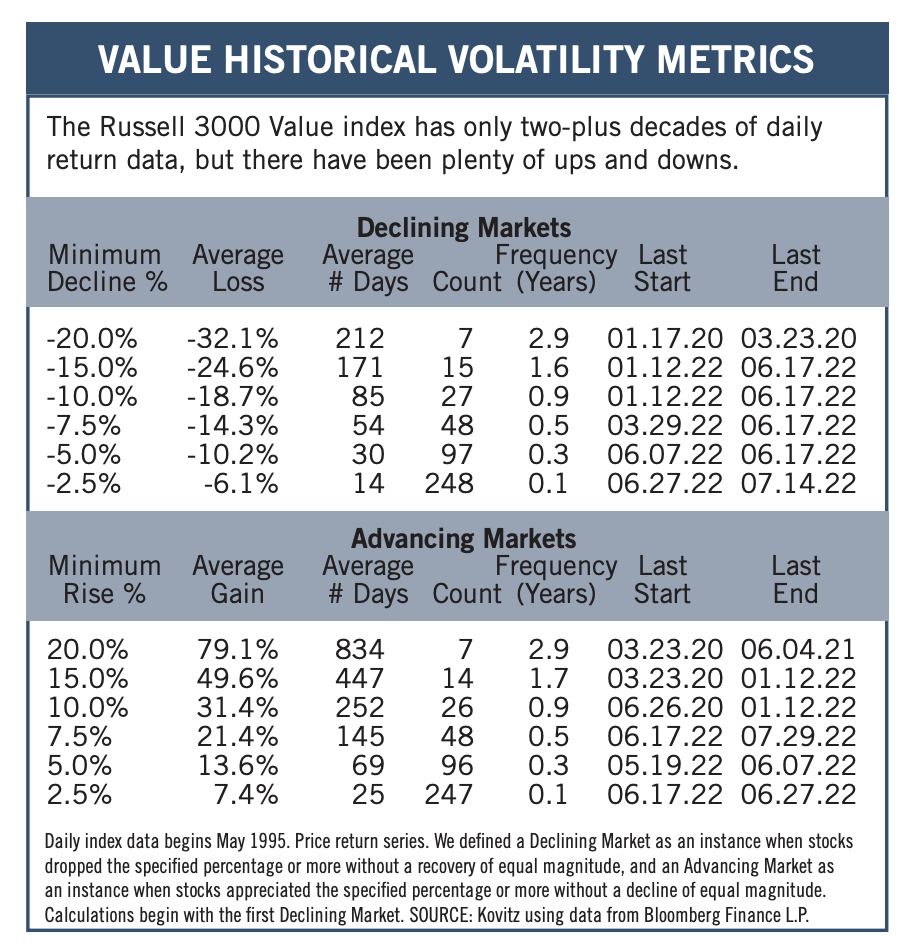
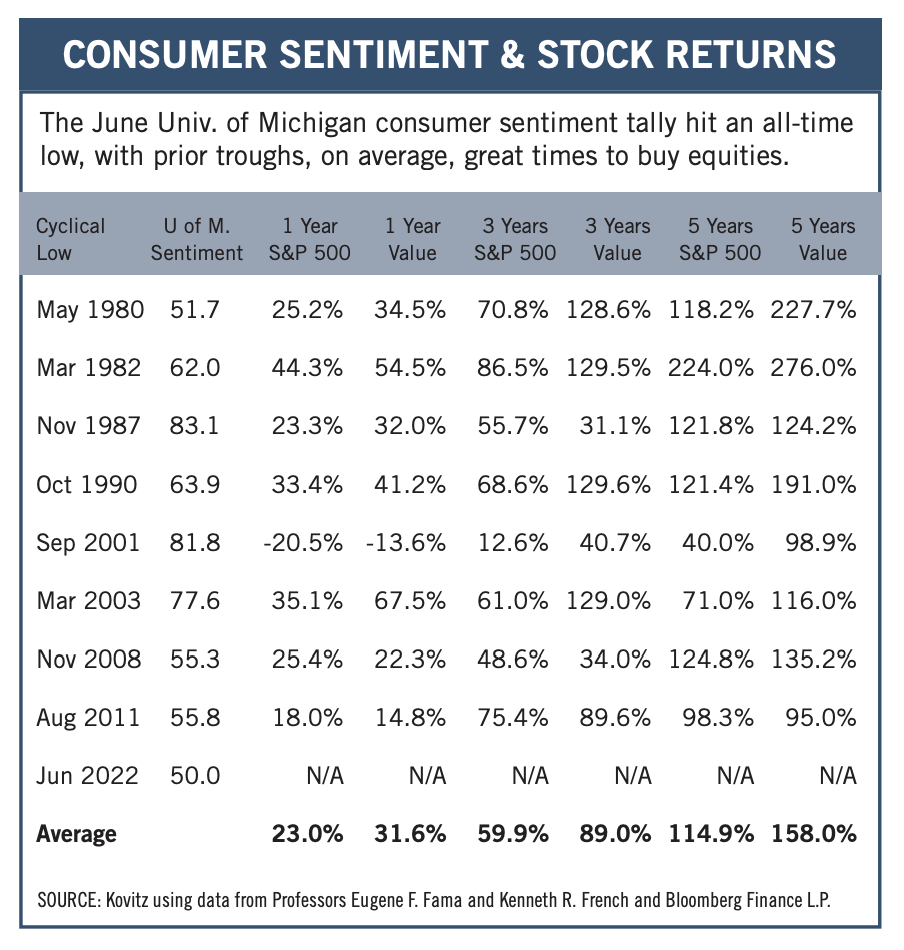
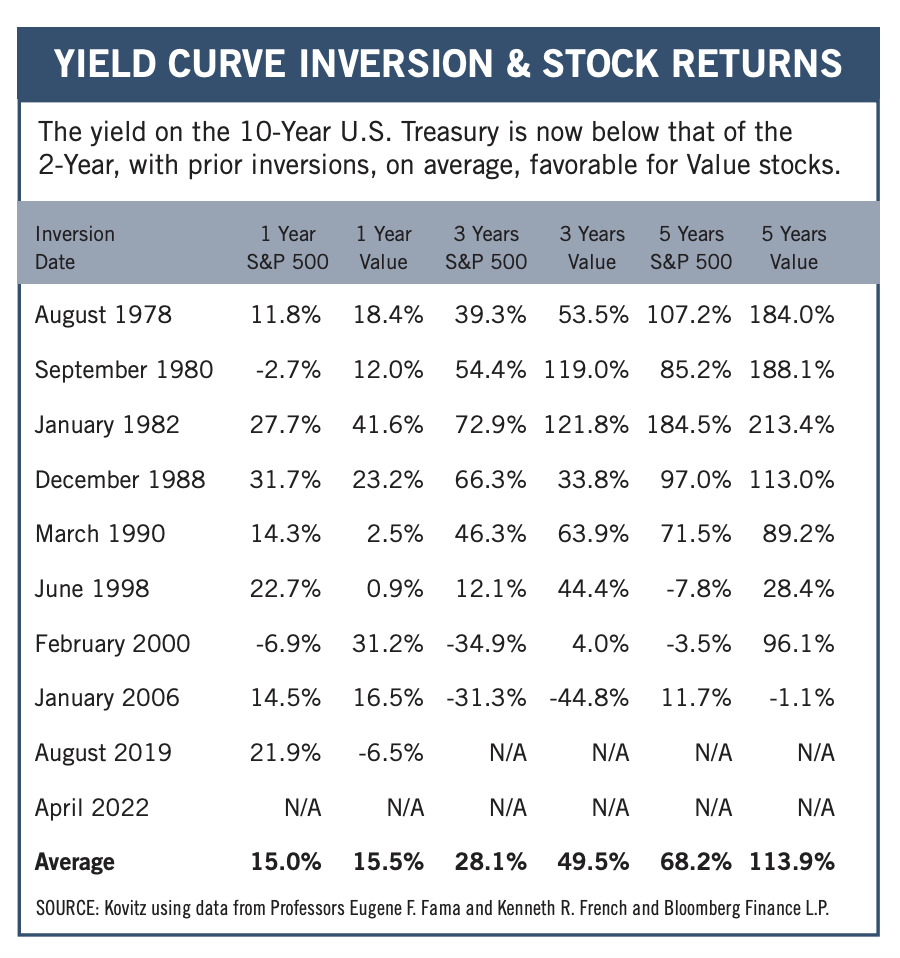
Reason & Evaluation
Fear cannot be banished, but it can be calm and without panic; it can be mitigated by reason and evaluation. This favored Vannevar Bush quote seems especially apt these days, with the media fixated on and pundits fretting about weak economic numbers, signs of recession and sky-high inflation readings. We respect that these can be serious headwinds for corporate profits, but running the historical return numbers shows no reason, on average, for folks to be selling stocks today. In fact, there seems to be support for adding to equity exposure.
Recommended Stock List
In this space, we list all of the stocks we own across our multi-cap-value managed account strategies and in our four newsletter portfolios. See the last page for pertinent information on our flagship TPS strategy, which has been in existence since the launch of The Prudent Speculator in March 1977.
Readers are likely aware that TPS has long been monitored by The Hulbert Financial Digest (“Hulbert”). As industry watchdog Mark Hulbert states, “Hulbert was founded in 1980 with the goal of tracking investment advisory newsletters. Ever since it has been the premiere source of objective and independent performance ratings for the industry.” For info on the newsletters tracked by Hulbert, visit: http://hulbertratings.com/since-inception/
Keeping in mind that all stocks are rated as “Buys” until such time as we issue an official Sales Alert, we believe that all of the companies in the tables on these pages trade for significant discounts to our determination of longterm fair value and/or offer favorable risk/reward profiles. Note that, while we always seek substantial capital gains, we require lower appreciation potential for stocks that we deem to have more stable earnings streams, more diversified businesses and stronger balance sheets. The natural corollary is that riskier companies must offer far greater upside to warrant a recommendation. Further, as total return is how performance is ultimately judged, we explicitly factor dividend payments into our analytical work.
While we always like to state that we like all of our children equally, meaning that we would be fine in purchasing any of the 100+ stocks, we remind subscribers that we very much advocate broad portfolio diversification with TPS Portfolio holding more than eighty of these companies. Of course, we respect that some folks may prefer a more concentrated portfolio, however our minimum comfort level in terms of number of overall holdings in a broadly diversified portfolio is at least thirty!
TPS rankings and performance are derived from hypothetical transactions “entered” by Hulbert based on recommendations provided within TPS, and according to Hulbert’s own procedures, irrespective of specific prices shown within TPS, where applicable. Such performance does not reflect the actual experience of any TPS subscriber. Hulbert applies a hypothetical commission to all “transactions” based on an average rate that is charged by the largest discount brokers in the U.S., and which rate is solely determined by Hulbert. Hulbert’s performance calculations do not incorporate the effects of taxes, fees, or other expenses. TPS pays an annual fee to be monitored and ranked by Hulbert. With respect to “since inception” performance, Hulbert has compared TPS to 19 other newsletters across 62 strategies (as of the date of this publication). Past performance is not an indication of future results. For additional information about Hulbert’s methodology, visit: http://hulbertratings.com/methodology/.

Portfolio Builder
Each month in this column, we highlight 10 stocks with which readers might populate their portfolios: General Dynamics (GD), Lam Research (LRCX), TFC (Truist Financial) and seven others.