Preview of July 2022 Newsletter
Editor’s Note
“Choose to be optimistic. It feels better.” — Dalai Lama
To say that 2022 has been a tough year in the financial markets would seem to be a major understatement. After all, the S&P 500 tumbled 8.4% in June, skidded 16.5% in Q2 and plunged 20.6% in H1. Not surprisingly, the media was quick to trumpet that stocks posted their worst first half of the year since 1970. This sounds far more dramatic than stating that June marked the biggest downturn since the 8.8% drop in the S&P in April 2022 or that the second quarter was the weakest since that venerable index’s 20.0% devastation in Q1 2020.
To be sure, the press must sensationalize almost everything these days to attract eyeballs, so we suspect that there is an outsized media impact on the mood of investors. Incredibly, the weekly Bull-Bear Sentiment Survey from the American Association of Individual Investors (AAII) recorded two of its seven most Bearish readings in its 35-year history in Q2 2022, with the level of negativity trailing only four tallies in the last trimester 1990 and March 5, 2009. Interestingly, those were all fantastic weeks to be buying, not selling stocks, as the average gain for the Russell 3000 index over the ensuing six months was 30.5%
We also note that the latest read on the Univ. of Michigan’s Consumer Sentiment gauge was the lowest in its history…worse than when inflation was in the double-digits in the early’80’s…and after the Crash of ’87…and after the Gulf War Meltdown of ’90… and after 9/11…and at the end of the Tech Wreck…and during the Great Financial Crisis…and after the downgrade of the U.S. credit rating. Believe it or not, the prior 8 cyclical lows, on average, proved to be great times for long-term-oriented investors to be adding to their equity exposure, with Value stocks soaring 34.1% on average over the next 12 months.
We realize that the losses suffered this year are very much real, with the average stock in the Russell 3000 index (R3K) down 22.1%, but market volatility is normal and the magnitude of this decline is hardly unusual. Indeed, the average stock plummeted 40.5% during the R3K’s six-week peak-to-trough 02.19.20 to 03.23.20, 24.6% from 09.20.18 to 12.24.18 and 23.6% from 06.23.15 to 02.11.16.
Of course, different from prior downturns, there have been few places to hide this time around as debt instruments endured their worst first six months of a year since the late 18th century, according to analysts at Deutsche Bank, with the U.S. Aggregate Bond index retreating 10.4%. Foreign stocks and bonds also were deep in the red in H1, and those who turned to alternative investments like cryptocurrencies have suffered massive losses.
Certainly, we respect that there is plenty about which to worry today, including the war in Ukraine, supply-chain disruptions, inventory management woes, corporate-profit question marks, higher inflation readings and the increased risk of recession, not to mention comments and actions from the Federal Reserve. However, we believe that a significant amount of bad news that may or may not materialize has now been discounted, while we think the headwinds will eventually blow less fiercely, as always has been the case after every prior scary selloff.
Anything can happen, so our nerves are steeled for more turbulence, while we know it is not easy to dismiss recent comments from Jamie Dimon: “That hurricane is right out there down the road coming our way. We just don’t know if it’s a minor one or super storm Sandy or Andrew or something like that and you better brace yourself.” Same thing goes for Mark Zuckerberg’s warning last week, “If I had to bet, I’d say that this might be one of the worst downturns that we’ve seen in recent history.” However, like them, we are investing for the long haul, so we are pleased that the JPMorgan Chase (JPM – $112.61) CEO green-lighted a substantial increase in expense spending at the financial titan for 2022 and the Meta Platforms (META – $161.25) founder will still hire 6,000 to 7,000 engineers at the social media giant this year.
Graphic Detail
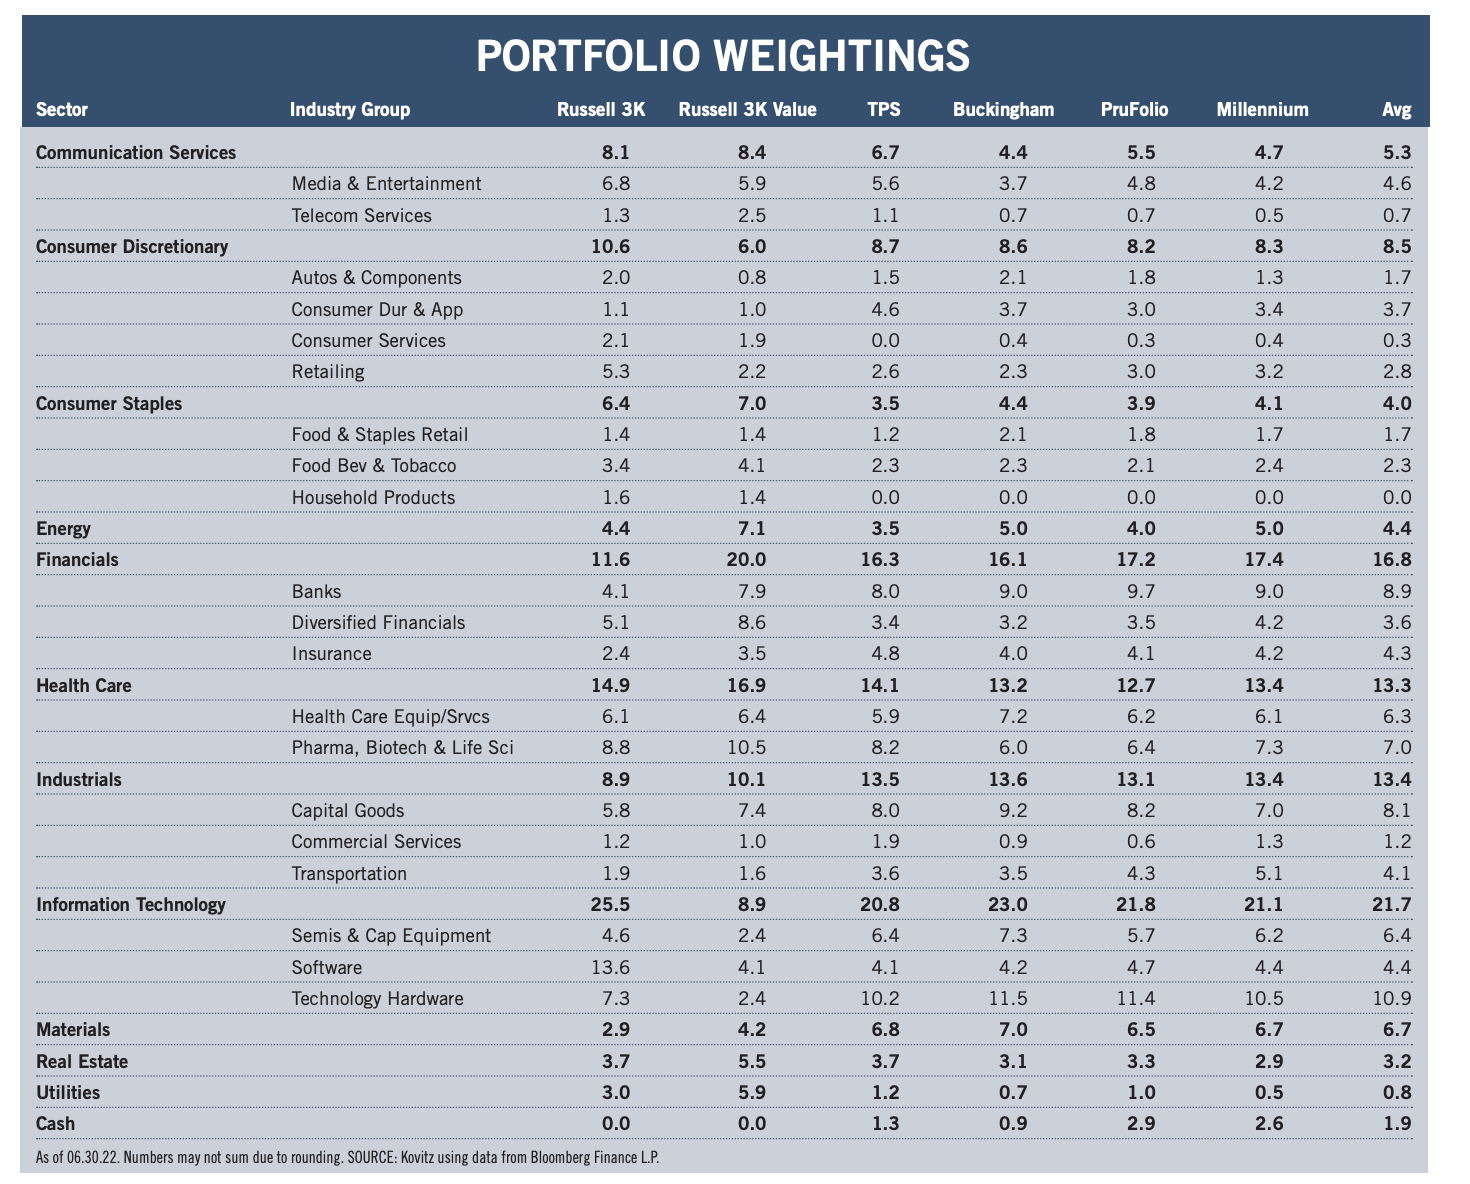
Sector and Industry Weightings
Time again to compare the current sector and industry group weightings of our four newsletter portfolios to those of the broad-based Russell 3000 and Russell 3000 Value indexes, noting that our valuation metrics more closely resemble those of Value-oriented gauges. Of course, while we very much remain bottom-up stock pickers focused on the merits of individual companies, we also keep a watchful eye on the composition of the indexes in order to ensure that we are comfortable in the overweighting or underweighting of a particular sector or industry group. As such, we are able to better focus our subjective reviews on the output of the objective newidea generation screens that we run every day on areas in which we might desire additional exposure, be it to augment a sector with minimal ownership or to add to a particularly undervalued industry. Illustrative of this process are the initial recommendations of stocks this month in the Energy and Consumer Discretionary sectors.
There is a great deal of art accompanying the science of portfolio construction and sector and industry group weightings are always used as a guide and not as the gospel. Over time, the gaps have narrowed, but inevitably there will be dispersion across the newsletter portfolios due to the timing of purchases and modest differences in the names held, even as the same desire for broad diversification has always been pervasive.
Graphic Detail
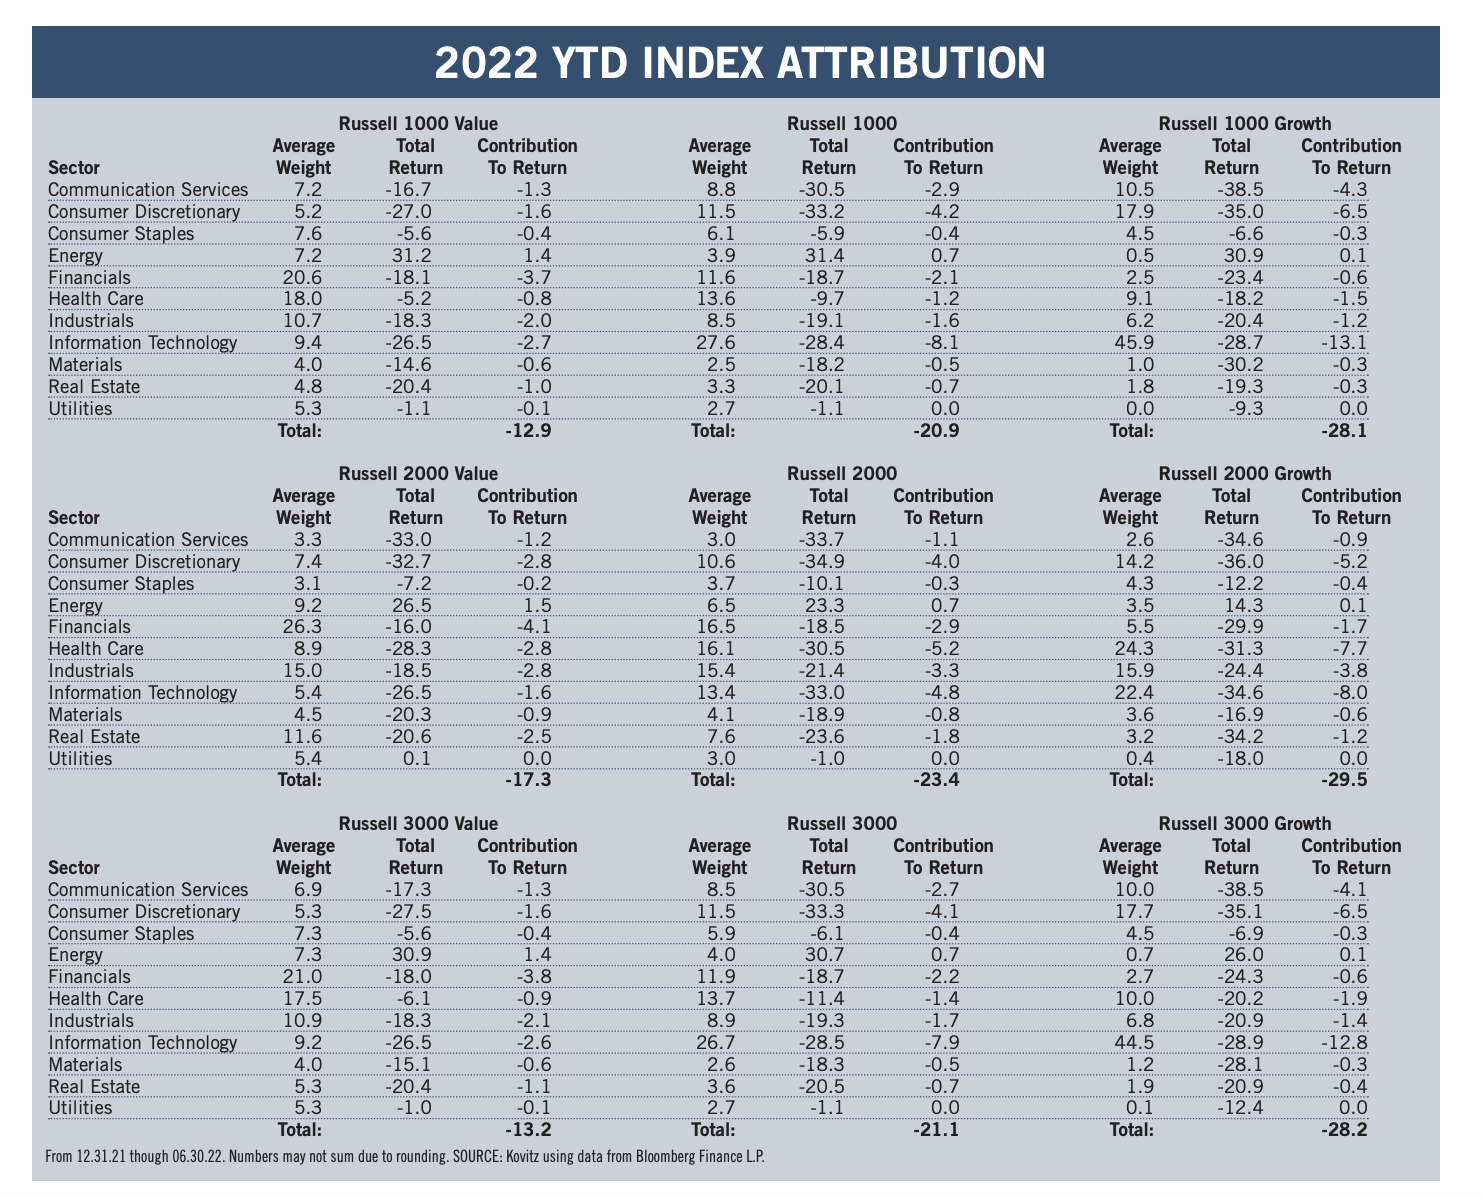
Value vs. Growth Sector Attribution
The following two paragraphs hardly do the subject justice, but the simple attribution displayed below helps to better understand which market sectors contributed the most (or least) to index returns. Given our willingness to buy stocks of any market capitalization, we look at the large-cap Russell 1000, the small-cap Russell 2000 and the all-cap Russell 3000 indexes, as well as the Value and Growth versions of each benchmark. We note that our portfolios, with what we believe to be their inexpensive valuations, have long resembled the Value indexes in terms of their financial metrics, even as our sector weightings have more often than not been lighter in Financials and heavier in Info Tech stocks.
There are no awards for red ink, which colored all of the equity benchmarks in H1 2022, but the Russell Value indexes did manage to lose significantly less than Growth, with large-cap stocks outperforming small-caps no matter the measure. Info Tech was a big drag across the board, but the weighting in the Growth indexes was far greater than for Value. On the other end of the spectrum, Energy was the best-performer, with the sector accounting for a significantly larger weight in the Value indexes. Communication Services and Consumer Discretionary were miserable for both Value and Growth, but the latter had significantly more exposure to the duo. And Financials, the biggest Value weight, did those indexes no favors.
Recommended Stock List
In this space, we list all of the stocks we own across our multi-cap-value managed account strategies and in our four newsletter portfolios. See the last page for pertinent information on our flagship TPS strategy, which has been in existence since the launch of The Prudent Speculator in March 1977.
Readers are likely aware that TPS has long been monitored by The Hulbert Financial Digest (“Hulbert”). As industry watchdog Mark Hulbert states, “Hulbert was founded in 1980 with the goal of tracking investment advisory newsletters. Ever since it has been the premiere source of objective and independent performance ratings for the industry.” For info on the newsletters tracked by Hulbert, visit: http://hulbertratings.com/since-inception/
Keeping in mind that all stocks are rated as “Buys” until such time as we issue an official Sales Alert, we believe that all of the companies in the tables on these pages trade for significant discounts to our determination of longterm fair value and/or offer favorable risk/reward profiles. Note that, while we always seek substantial capital gains, we require lower appreciation potential for stocks that we deem to have more stable earnings streams, more diversified businesses and stronger balance sheets. The natural corollary is that riskier companies must offer far greater upside to warrant a recommendation. Further, as total return is how performance is ultimately judged, we explicitly factor dividend payments into our analytical work.
While we always like to state that we like all of our children equally, meaning that we would be fine in purchasing any of the 100+ stocks, we remind subscribers that we very much advocate broad portfolio diversification with TPS Portfolio holding more than eighty of these companies. Of course, we respect that some folks may prefer a more concentrated portfolio, however our minimum comfort level in terms of number of overall holdings in a broadly diversified portfolio is at least thirty!
TPS rankings and performance are derived from hypothetical transactions “entered” by Hulbert based on recommendations provided within TPS, and according to Hulbert’s own procedures, irrespective of specific prices shown within TPS, where applicable. Such performance does not reflect the actual experience of any TPS subscriber. Hulbert applies a hypothetical commission to all “transactions” based on an average rate that is charged by the largest discount brokers in the U.S., and which rate is solely determined by Hulbert. Hulbert’s performance calculations do not incorporate the effects of taxes, fees, or other expenses. TPS pays an annual fee to be monitored and ranked by Hulbert. With respect to “since inception” performance, Hulbert has compared TPS to 19 other newsletters across 62 strategies (as of the date of this publication). Past performance is not an indication of future results. For additional information about Hulbert’s methodology, visit: http://hulbertratings.com/methodology/.

Portfolio Builder
Each month in this column, we highlight 10 stocks with which readers might populate their portfolios: Civitas Resources (CIVI), Dicks Sporting Goods (DKS), Zimmerman Biomet (ZBH) and seven others.