Preview of June 2022 Newsletter
Editor’s Note
“If you don’t know who you are, the stock market is an expensive place to find out.” – Adam Smith
While it took a 6% plus rally over the last full trading week of the month to get into the black, we suspect that some may be surprised that equities rebounded in May. The Dow Jones Industrial Average and S&P 500 eked out small gains, while the Value indexes maintained recent out-performance, advancing more than 1.5%.
To be sure, there is little about which to be excited thus far in 2022, given that the average stock is still deep in the red, with the formerly high-flying Nasdaq Composite index and Growth indexes mired in a Bear Market (down more than 20%), but we are puzzled by the level of pessimism permeating the investment world.
For example, after the Dow had fallen for an eighth consecutive week, the longest losing streak since 1932, a prominent article proclaimed, “Families are watching the investments they meant for down payments or college tuition or retirement shrink, day after day.” Of course, that provocative prose did concede that equities were up over the last two years, but it neglected to state that even when the indexes were at their 2022 lows, folks who ignored the purveyors of doom and gloom would have enjoyed double-digit annualized returns over the preceding decade.
Alas, long-term perspective is lacking in today’s 24/7 media world as the majority of financial stories simply seek to grab the most eyeballs, often with dire warnings, rather than provide a complete picture better suited to the majority of readers who truly are investing for those long-term goals mentioned above. After all, though past performance is no guarantee of future performance, one would think it helpful to discuss what happened to equities following the last time the Dow had such a miserable run. Believe it or not, Value stocks, per data from Professors Eugene F. Fama and Kenneth R. French, gained 2% in 1932, before skyrocketing 125% in 1933 and soaring 308% from 1933-1942! Those returns are not meant to suggest that a massive rally is in the cards or even that the current downturn will soon be over, but no matter how the historical data are studied, the secret to success in stocks has always been to not get scared out of them.
Staying the course is easier said than done, as calculations from data firm DALBAR show that through the end of 2021, returns for equity fund investors trailed the market by some 320 basis points per annum over the last 10 years. Sadly, so many investors let their emotions (optimistic at highs and pessimistic at lows) get the best of them, which is why we spend so much time showing how stocks have performed when this or that has happened previously.
Yes, no two scary events are ever the same, and there are some big losses in the data series, but we find it comforting to look at average annualized returns on Value when the bogeymen currently spooking the markets have occurred before. 1) Fed Tightening since 1970: 11.3%. 2) Higher Annual Gov’t Bond Yield since 1930: 17.8%. 3) Year Prior to Start of Recession since 1928: 9.5%. 4) Year After Start of Recession since 1929: 4.6%. 5) Inflation Above 8% since 1957: 22.5%. 6) High Inflation and Interest Rates from 1966 – 1981: 13.4%. 7) Five and 10 Years Following the Tech Bubble Bursting in 2000: 13.0% and 7.3%.
History also tells us that 10% corrections take place every 11 months on average and 20% Bear Markets every 3.5 years. Nothing, therefore, about the current selloff is particularly unusual, though it is nice that this one is hitting richly priced stocks much harder than inexpensive companies and that the Value indexes have lost less this year than even the U.S. and Global Aggregate Bond benchmarks. Obviously, downside volatility could resume after the recent respite, but as Warren Buffett states, “Look at market fluctuations as your friend rather than your enemy. Profit from folly rather than participate in it.” The Oracle of Omaha, not surprisingly, has been a big buyer of stocks this year, and we note that corporate insiders bought in May at their strongest pace since March 2020!
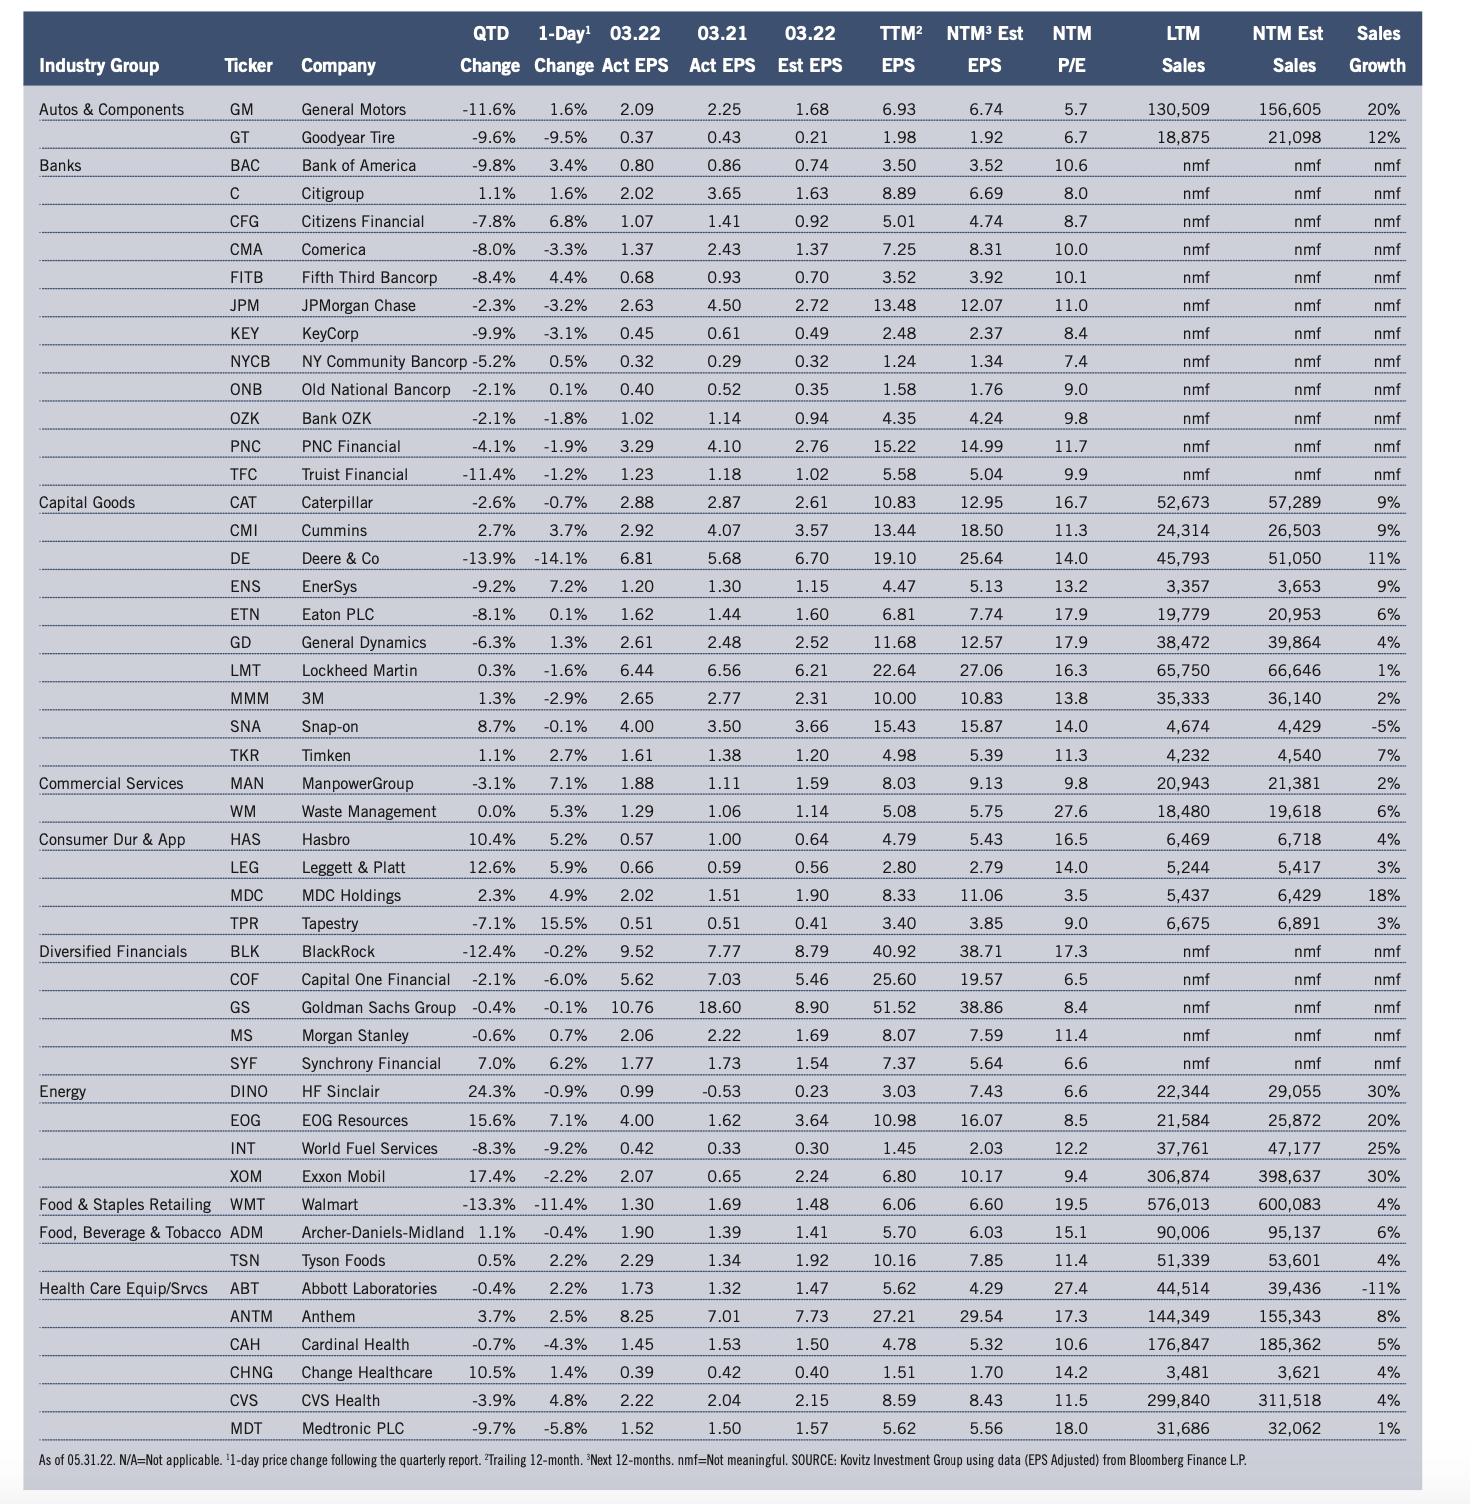
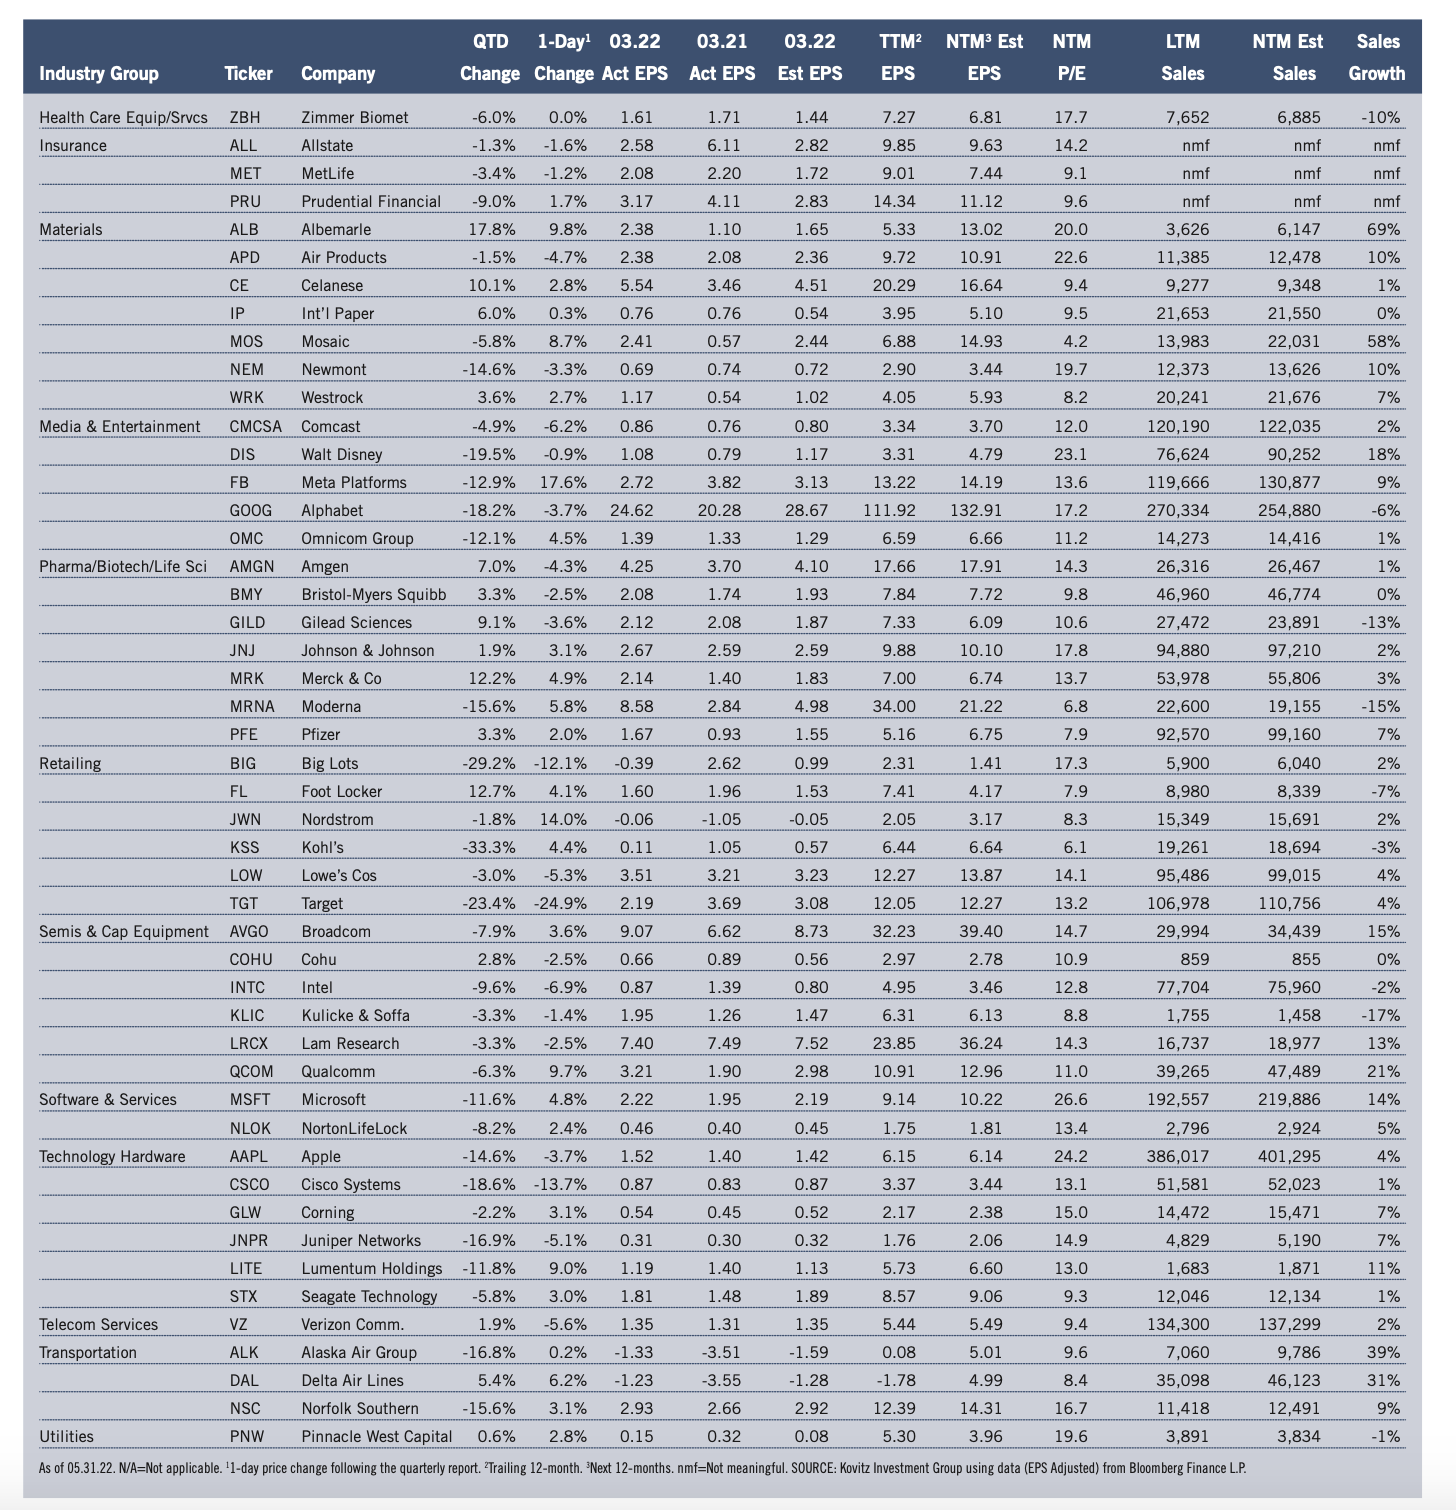
Graphic Detail: Earnings Scorecard
Q1 Season
Given that real (inflation-adjusted) U.S. GDP growth slumped by 1.5% in Q1, down from a 6.9% increase in the fourth quarter, revenue and net income numbers from Corporate America held up well, even as management teams engaged in their usual tempering of guidance. S&P Global calculated that Q1 2022 “operating” and as-reported” earnings per share for the S&P 500 inched up 4.7% and 0.5%, respectively, compared to Q1 2021. Impressively, the number of S&P 500 companies that exceeded bottom-line forecasts was 76.1%, much better than the usual “beat” rate, while 66.3% eclipsed top-line projections. Of The Prudent Speculator’s 96 stocks presented in our Earnings Scorecard, a solid 71.8% topped EPS expectations, while the average one-day price reaction was a gain of 0.4%, despite several big setbacks. Standard & Poor’s projects (as of 05.26.22) that after jumping from $122.37 in 2020 to $208.21 in 2021, bottomup operating EPS for the S&P 500 will climb to $223.85 this year and to $247.29 in 2023. Estimates are subject to change (the current forecasts are higher, not lower, than those offered three months ago), but anything close to those tallies should support much higher stock prices.
Recommended Stock List
In this space, we list all of the stocks we own across our multi-cap-value managed account strategies and in our four newsletter portfolios. See the last page for pertinent information on our flagship TPS strategy, which has been in existence since the launch of The Prudent Speculator in March 1977.
Readers are likely aware that TPS has long been monitored by The Hulbert Financial Digest (“Hulbert”). As industry watchdog Mark Hulbert states, “Hulbert was founded in 1980 with the goal of tracking investment advisory newsletters. Ever since it has been the premiere source of objective and independent performance ratings for the industry.” For info on the newsletters tracked by Hulbert, visit: http://hulbertratings.com/since-inception/
Keeping in mind that all stocks are rated as “Buys” until such time as we issue an official Sales Alert, we believe that all of the companies in the tables on these pages trade for significant discounts to our determination of longterm fair value and/or offer favorable risk/reward profiles. Note that, while we always seek substantial capital gains, we require lower appreciation potential for stocks that we deem to have more stable earnings streams, more diversified businesses and stronger balance sheets. The natural corollary is that riskier companies must offer far greater upside to warrant a recommendation. Further, as total return is how performance is ultimately judged, we explicitly factor dividend payments into our analytical work.
While we always like to state that we like all of our children equally, meaning that we would be fine in purchasing any of the 100+ stocks, we remind subscribers that we very much advocate broad portfolio diversification with TPS Portfolio holding more than eighty of these companies. Of course, we respect that some folks may prefer a more concentrated portfolio, however our minimum comfort level in terms of number of overall holdings in a broadly diversified portfolio is at least thirty!
TPS rankings and performance are derived from hypothetical transactions “entered” by Hulbert based on recommendations provided within TPS, and according to Hulbert’s own procedures, irrespective of specific prices shown within TPS, where applicable. Such performance does not reflect the actual experience of any TPS subscriber. Hulbert applies a hypothetical commission to all “transactions” based on an average rate that is charged by the largest discount brokers in the U.S., and which rate is solely determined by Hulbert. Hulbert’s performance calculations do not incorporate the effects of taxes, fees, or other expenses. TPS pays an annual fee to be monitored and ranked by Hulbert. With respect to “since inception” performance, Hulbert has compared TPS to 19 other newsletters across 62 strategies (as of the date of this publication). Past performance is not an indication of future results. For additional information about Hulbert’s methodology, visit: http://hulbertratings.com/methodology/.

Portfolio Builder
Each month in this column, we highlight 10 stocks with which readers might populate their portfolios: Abbot Labs (ABT), ManPowerGroup (MAN), Seagate Tech (STX) and seven others.