Preview of December 2022 Newsletter
Editor’s Note
“The time for moderating the pace of rate increases may come as soon as the December meeting.” — Jerome H. Powell
After a spectacular October, equities continued their tremendous rebound in November. Inexpensively priced stocks again led the charge, with the Russell 3000 Value index advancing 6.05% on a total return basis last month, compared to 4.37% for the Russell 3000 Growth index. Incredibly, the two-month bounce off the Q3 nadir for all four Russell Value benchmarks (Small-Cap, Mid-Cap, Large-Cap & All-Cap) exceeded 16%, while the Dow Jones Industrial Average entered a new Bull Market, with a greater than 20% move higher.
Needless to say, it is nice to have another fresh reminder that time in the market trumps market timing. Of course, far too many folks likely missed out on the recovery as the Investment Company Institute on November 22 showed that institutional and retail investors held $4.64 trillion in money market funds, with folks on Main Street growing their holdings by $143 billion to $1.61 trillion since the end of July.
To be fair, money markets are seeing annualized yields of 3.5% or more these days, so it is far better to house money in these funds, versus parking cash in the bank or low-interest-bearing accounts. However, weekly measures of stock market sentiment from the American Association of Individual Investors suggest that some of those dollars on the sidelines came out of equities. After all, the number of Bulls in the latest AAII tally was just 24.5% compared to Bears of 40.4%, a negative stance that persisted throughout the last two months, with readings far different than the averages over the last 35 years of 37.5% optimists and 31.5% pessimists. Not surprisingly, given that it is often wise to be greedy when others are fearful, AAII is widely viewed as a contrarian market indicator.
Certainly, we realize that there is still little to cheer about this year, as the major market averages and our portfolios are in the red. However, we are not unhappy to see investors continuing to pay much more attention to the price they are paying for the sales and profits companies are presently generating, rather than focusing solely on growth expectations that may or may not materialize. Obviously, growth potential is an important element of our work as it is critical in setting our three-to-five year Target Prices, but we find that a reasonable valuation based on current metrics affords a margin of safety that allows for more peaceful slumber. Happily, TPS Portfolio boasts a trailing P/E ratio of 12.2, compared to 16.4 for the Russell 3000 Value index and 19.7 for the S&P 500.
To be sure, the “E” in that equation is in question as we move into 2023, but as our Earnings Scorecard this month shows, bottom lines for Corporate America have held up well. True, the forecasted odds of recession over the next year stand at 62.5% and the yield curve is inverted, which is supposedly a harbinger of economic contraction. However, Q3 U.S. GDP grew 2.9% on a real (inflation-adjusted) basis and 9.1% on a nominal basis, while the consensus forecast is still calling for modest real GDP growth next year, even as uncertain is the best way to describe the outlook.
Indeed, this week, we learned that home prices continued to weaken and that manufacturing is headed for a contraction, but the jobs picture remained remarkably robust and the most recent estimate from the Atlanta Fed for real Q4 GDP growth is 2.9%. Inflation also moderated as the core personal consumption expenditure inched down to 5.0% in October, with all the economic data supporting Fed Chair Powell’s assertion, “My colleagues and I do not want to over-tighten. Cutting rates is not something we want to do soon, so that’s why we’re slowing down, and going to try to find our way to what the right level is.”
Anything can happen in the short run and we are always braced for downside volatility, but market interest rates may have peaked, corporate balance sheets and income statements are healthy, and speculative excesses have been lessened, so we close with the reminder, “The secret to success in stocks is not to get scared out of them.”
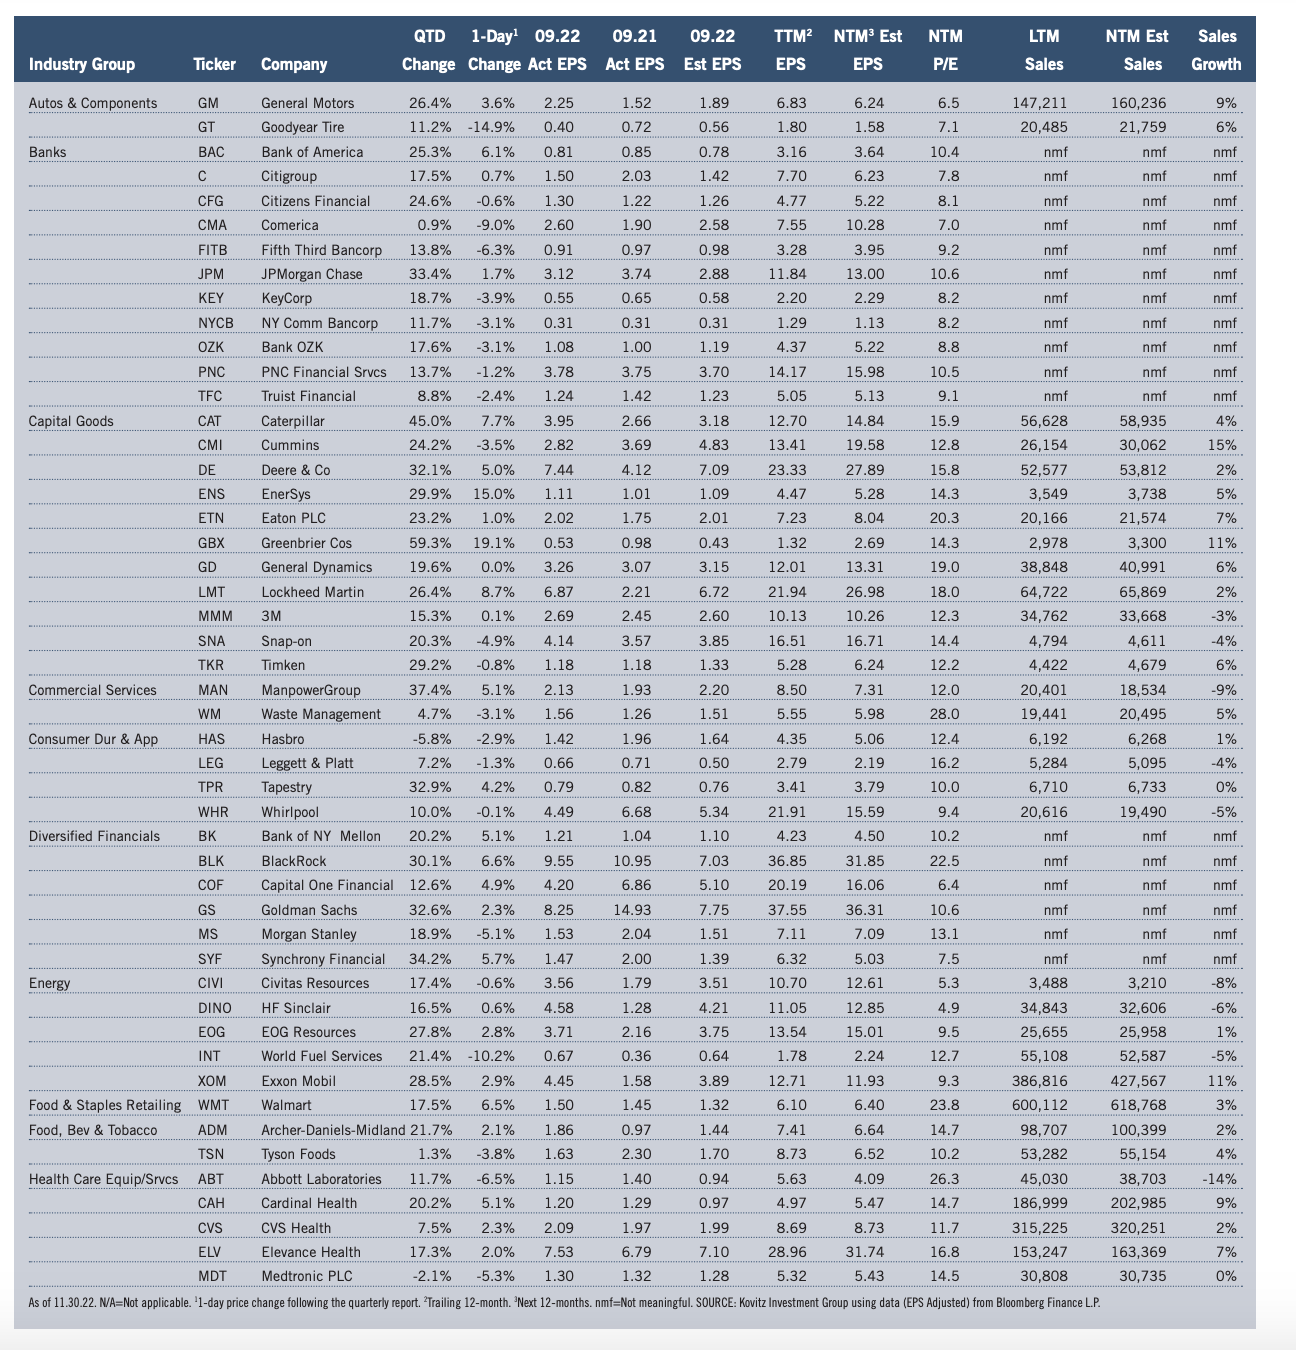
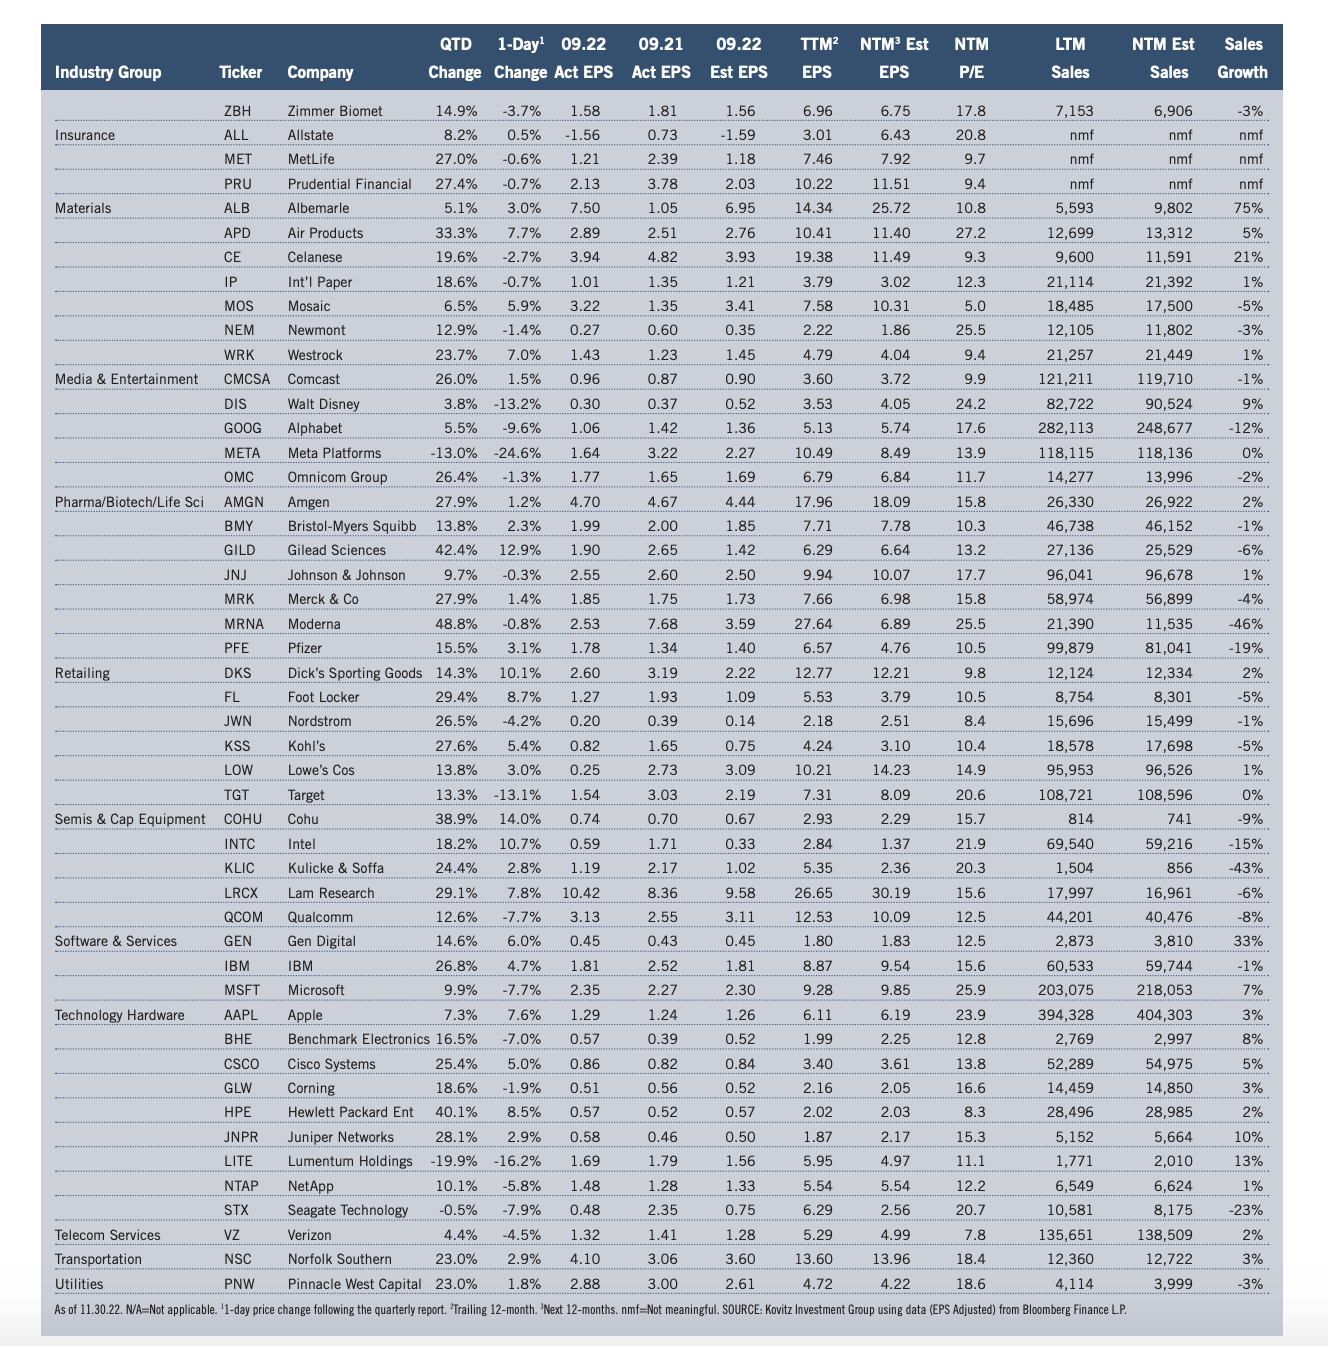
Graphic Detail: Earnings Scorecard – Q3 Season
Many economic statistics in the period were not exactly stellar, yet real (inflation-adjusted) U.S. GDP growth came in at 2.9% in Q3, supporting solid revenue and net income numbers from Corporate America, even as management teams engaged in their usual tempering of guidance. Impressively, the number of S&P 500 companies that exceeded bottom-line forecasts was 69.5%, in line with the usual “beat” rate, while 59.3% eclipsed top-line projections. Of The Prudent Speculator’s 98 stocks presented in our Earnings Scorecard, sizable 74.4% topped EPS expectations, while the average one-day price reaction was a gain of 0.5%, despite several big setbacks. Standard & Poor’s projects (as of 11.30.22) that after jumping from $122.37 in 2020 to $208.21 in 2021, bottom-up operating EPS for the S&P 500 will dip to $200.94 this year (the figure includes a massive $66.9 billion ($4.74 per share) “unrealized investment” loss from Berkshire Hathaway in Q2), but will rise to $228.37 in 2023. Estimates are subject to change (current forecasts are lower than those three months ago) and much will depend on the health of the U.S. and global economies, but anything close to that ‘23 tally should support much higher stock prices.
Recommended Stock List
In this space, we list all of the stocks we own across our multi-cap-value managed account strategies and in our four newsletter portfolios. See the last page for pertinent information on our flagship TPS strategy, which has been in existence since the launch of The Prudent Speculator in March 1977.
Readers are likely aware that TPS has long been monitored by The Hulbert Financial Digest (“Hulbert”). As industry watchdog Mark Hulbert states, “Hulbert was founded in 1980 with the goal of tracking investment advisory newsletters. Ever since it has been the premiere source of objective and independent performance ratings for the industry.” For info on the newsletters tracked by Hulbert, visit: http://hulbertratings.com/since-inception/
Keeping in mind that all stocks are rated as “Buys” until such time as we issue an official Sales Alert, we believe that all of the companies in the tables on these pages trade for significant discounts to our determination of longterm fair value and/or offer favorable risk/reward profiles. Note that, while we always seek substantial capital gains, we require lower appreciation potential for stocks that we deem to have more stable earnings streams, more diversified businesses and stronger balance sheets. The natural corollary is that riskier companies must offer far greater upside to warrant a recommendation. Further, as total return is how performance is ultimately judged, we explicitly factor dividend payments into our analytical work.
While we always like to state that we like all of our children equally, meaning that we would be fine in purchasing any of the 100+ stocks, we remind subscribers that we very much advocate broad portfolio diversification with TPS Portfolio holding more than eighty of these companies. Of course, we respect that some folks may prefer a more concentrated portfolio, however our minimum comfort level in terms of number of overall holdings in a broadly diversified portfolio is at least thirty!
TPS rankings and performance are derived from hypothetical transactions “entered” by Hulbert based on recommendations provided within TPS, and according to Hulbert’s own procedures, irrespective of specific prices shown within TPS, where applicable. Such performance does not reflect the actual experience of any TPS subscriber. Hulbert applies a hypothetical commission to all “transactions” based on an average rate that is charged by the largest discount brokers in the U.S., and which rate is solely determined by Hulbert. Hulbert’s performance calculations do not incorporate the effects of taxes, fees, or other expenses. TPS pays an annual fee to be monitored and ranked by Hulbert. With respect to “since inception” performance, Hulbert has compared TPS to 19 other newsletters across 62 strategies (as of the date of this publication). Past performance is not an indication of future results. For additional information about Hulbert’s methodology, visit: http://hulbertratings.com/methodology/.

Portfolio Builder
Each month in this column, we highlight 10 stocks with which readers might populate their portfolios: Bristol-Myers Squibb (BMY), Deutsche Post AG (DPSGY), Nurtrien Ltd (NTR) and seven others.