Every month, The Prudent Speculator produces a newsletter that includes a market summary for the month prior, helpful charts and graphs, recent stock market news, future economic outlook and specific stock investment strategies focused on value stock investing. This week, we cover short- and long-term returns of market-wide portfolios. We also include a preview of our current Buy List and Portfolio Builder section with ten highlighted stocks. Note that the entire list is available to our community of loyal subscribers only.
| Subscribe to The Prudent Speculator |
Editors Note
“It is gratifying to see the dis-inflationary process now getting underway, and we continue to get strong labor market data” — Jerome H. Powell
The first month of 2023 saw terrific gains, with the S&P 500 and Russell 3000 advancing a respective 6.3% and 6.9% on a total return basis. Growth topped Value in the January performance race, but the Russell 3000 Value index’s 5.4% return added to the big rebound in Q4 2022. In fact, returns on the Value indexes since the end of Q3 eclipsed 20% in early February.
Interestingly, despite the huge rally, folks on Main Street remain a pessimistic bunch with only 29.9% Bulls vs. 34.6% Bears in the latest weekly AAII Sentiment Survey. And the mood on Wall Street isn’t much better as strategists at the big investment houses have lowered their year-end target for the S&P 500 to 4050 from 4078 at the start of 2023. The benchmark closed at 4180 on February 2.
Given that we have long believed that we should be greedy when others are fearful, we are not unhappy to see so many so negative on stocks. After all, those same Wall Street gurus reinforced a familiar maxim, the only problem with market timing is getting the timing right. Thirteen months ago, their year-end 2022 S&P target of 4950 proved to be a wee bit off from the actual close of 3840.
We continue to believe that time in the market trumps market timing. After all, we have endured 37 declines of 10% or greater since the launch of The Prudent Speculator in 1977, with each of those setbacks overcome in the fullness of time by rebounds of far greater average magnitude. In fact, despite tremendous volatility along the way, and more than few ugly years like 2022, the long-term returns for equities have been spectacular.
Given that the broad-based indexes were in Bear Market territory at the end of Q3 and that the average stock was off more than 20% for all of 2022, we believed that a great deal of bad news had been priced into equities. Further, our years of experience have taught us that new Bull Markets often begin when conditions appear miserable. For example, at the exact equity bottom of the Great Financial Crisis on March 9, 2009, Warren Buffett himself proclaimed, “The economy has fallen off a cliff,” while U.S. GDP contracted by 4.6% that same quarter.
Obviously, current conditions are far different than in previous Bear Markets as the U.S. economy grew a robust 7.3% on a nominal basis during 2022 and respective Q3 and Q4 real (inflation-adjusted) GDP expanded +3.2% and +2.9%. Further, the labor picture has remained remarkably robust with a year-end unemployment rate of 3.5% and the latest weekly jobless claims tally of 183,000 near five decade lows. True, corporate profits were not grand in 2022, but earnings did not fall off a cliff, and the current forecast for 2023 is for bottom-up operating EPS growth of 10% for the S&P 500.
Certainly, we understand that there are plenty of clouds on the economic horizon as Bloomberg’s Recession Probability Forecast stands at 65%, the Conference Board’s Leading Economic Index dropped by 1.0% in December, signalling a downturn in the near term, and the Institute for Supply Management’s forward-looking Factory and Service sector PMIs are in the contraction zone.
However, the International Monetary Fund just upgraded its World Economic Outlook, citing resilient demand, China’s reopening and easing inflation. And Federal Reserve Chair Jerome H. Powell said this week, “Longer-term inflation expectations appear to remain well anchored, as reflected in a broad range of surveys of households, businesses, and forecasters, as well as measures from financial markets.” As a result, the odds of a so-called soft landing have improved as the Fed appears to be near the end of its rate-hiking cycle while even those still calling for a recession think it would be mild.
We are always braced for downside volatility, but we still sleep very well with the reasonable valuation metrics and generous dividends (NTM P/E is 12.9 and yield is 2.7% for TPS Portfolio) of our broadly diversified portfolios.
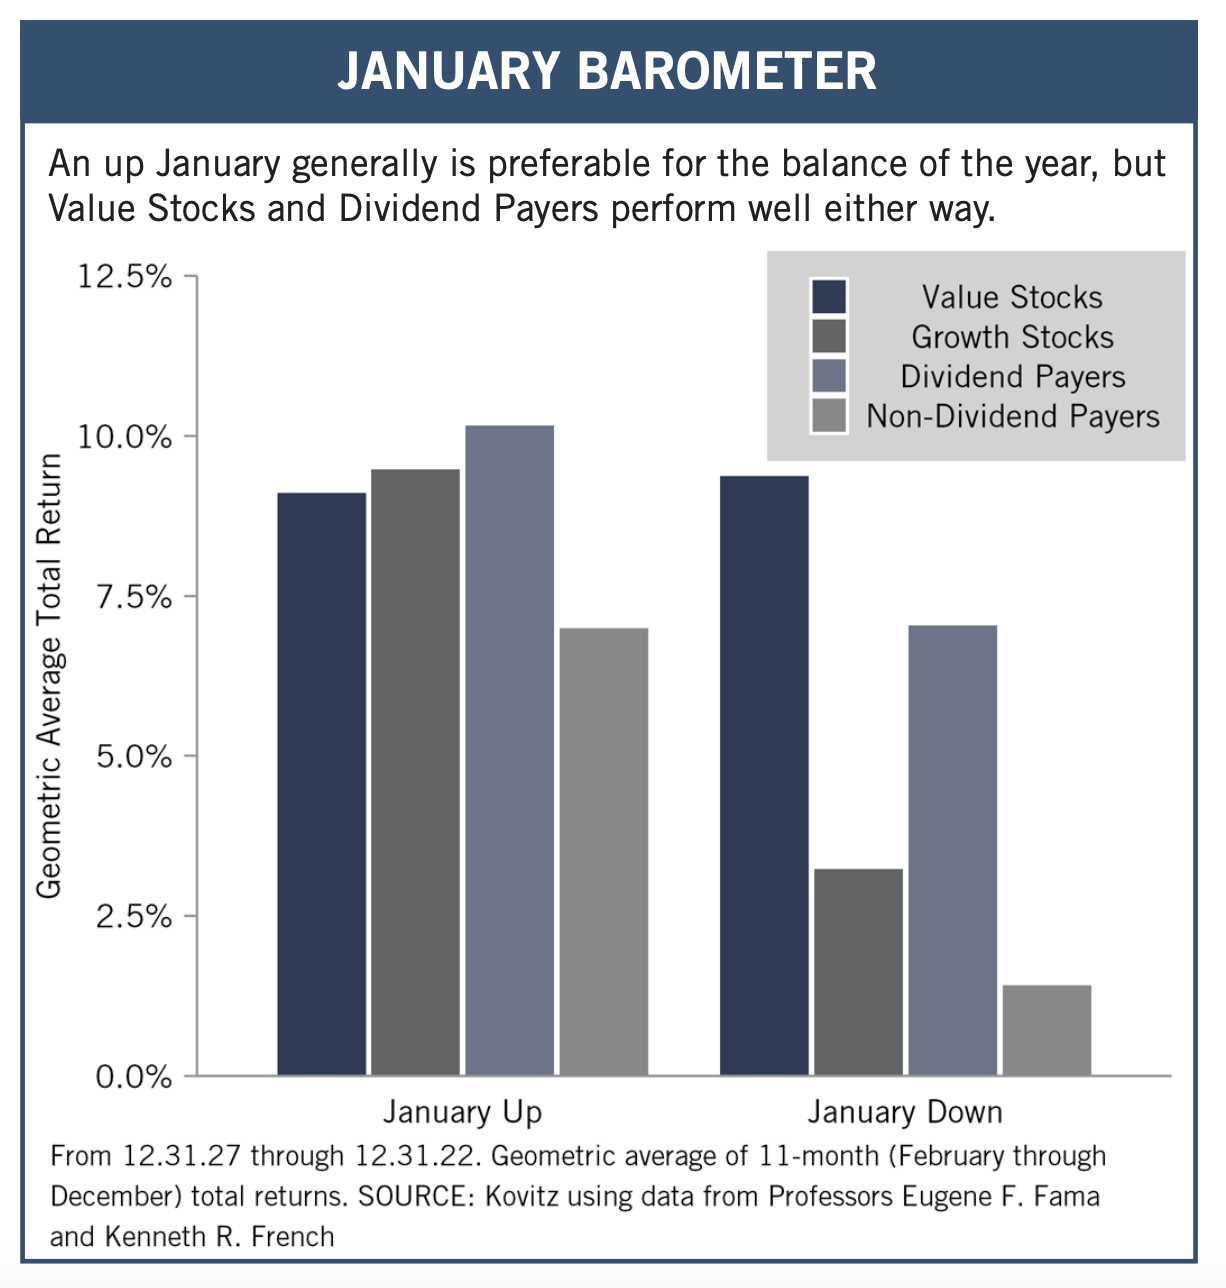
Graphic Detail: As Goes January…
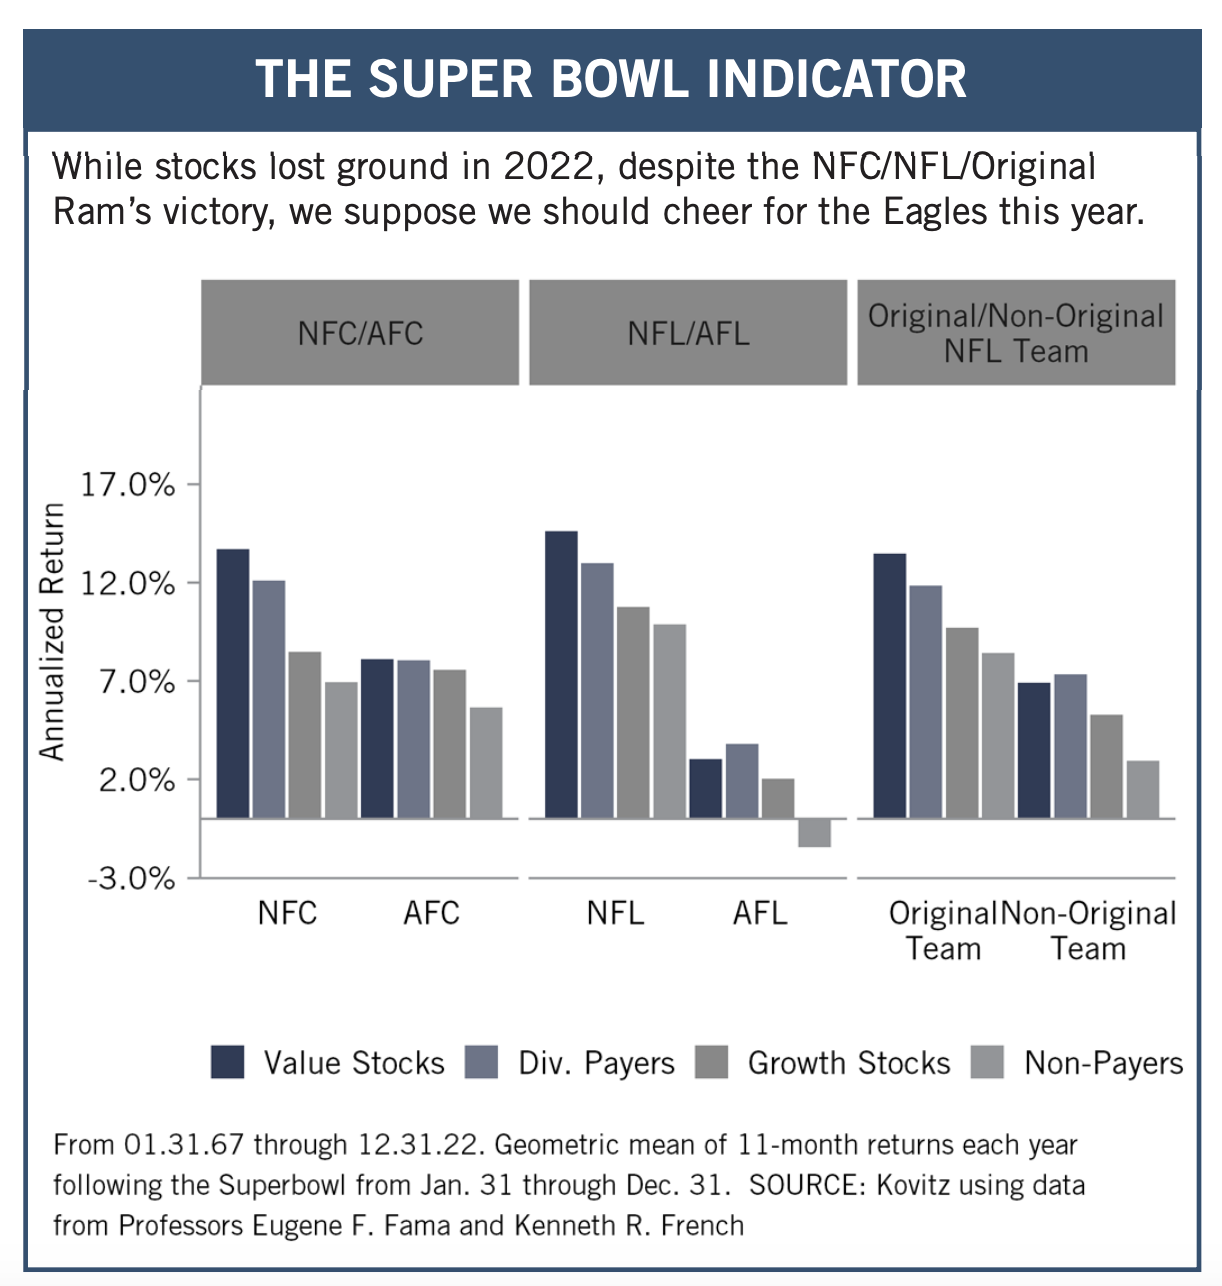
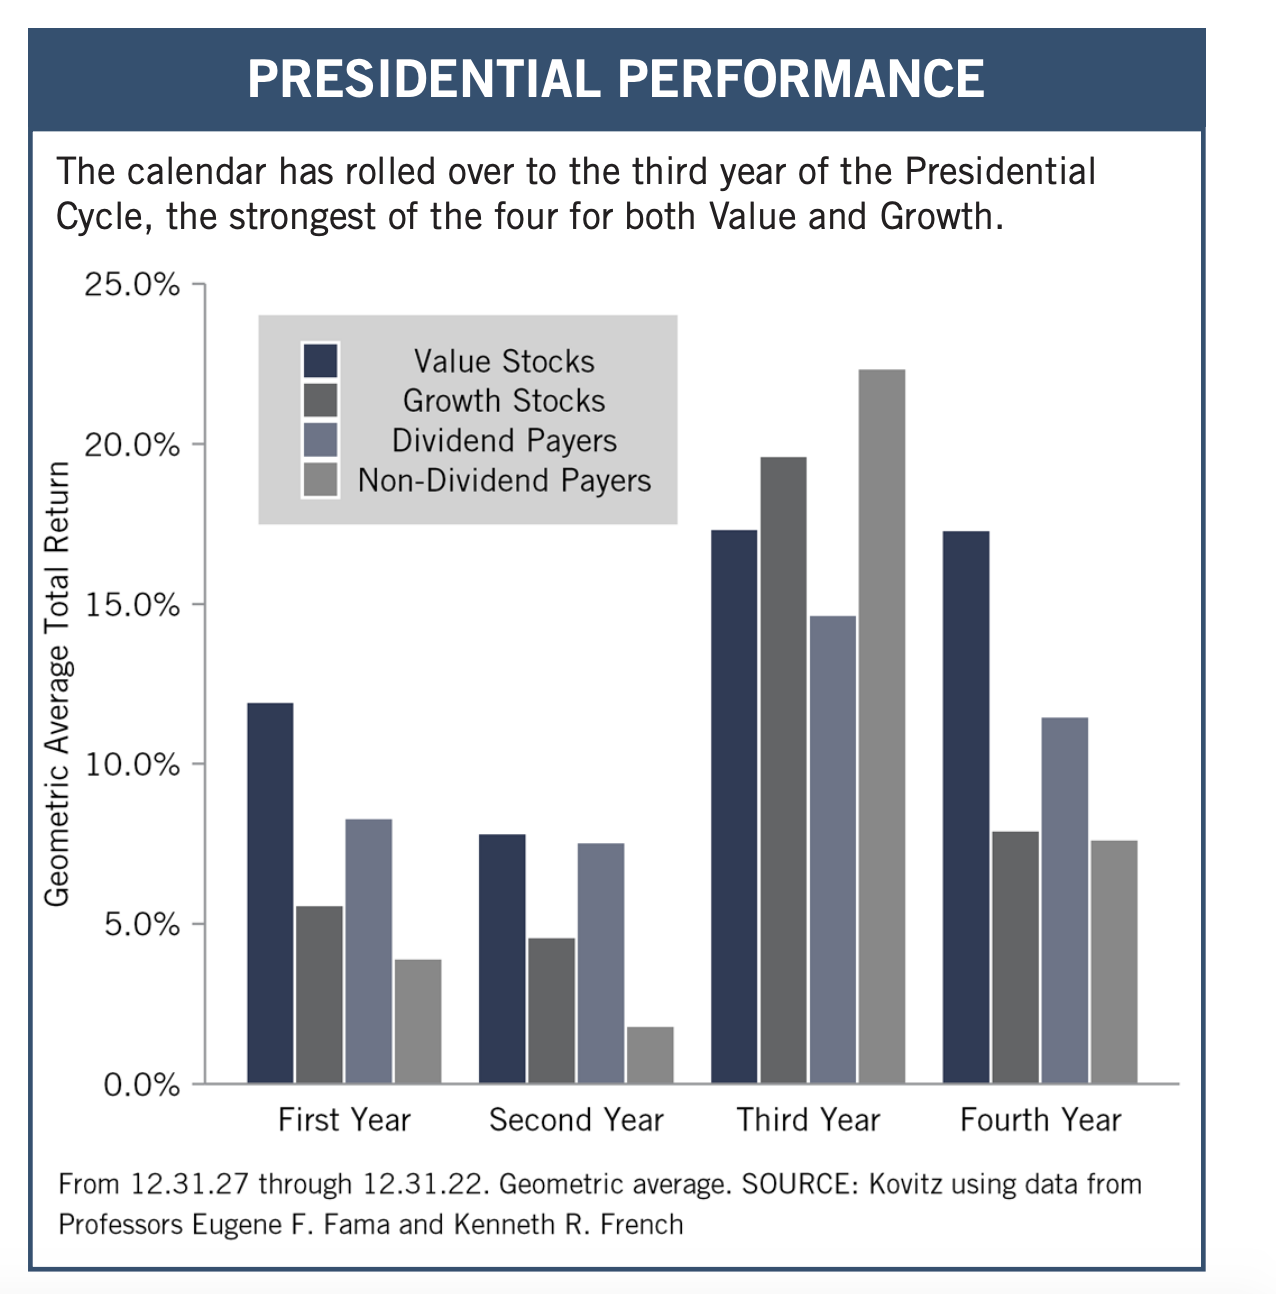
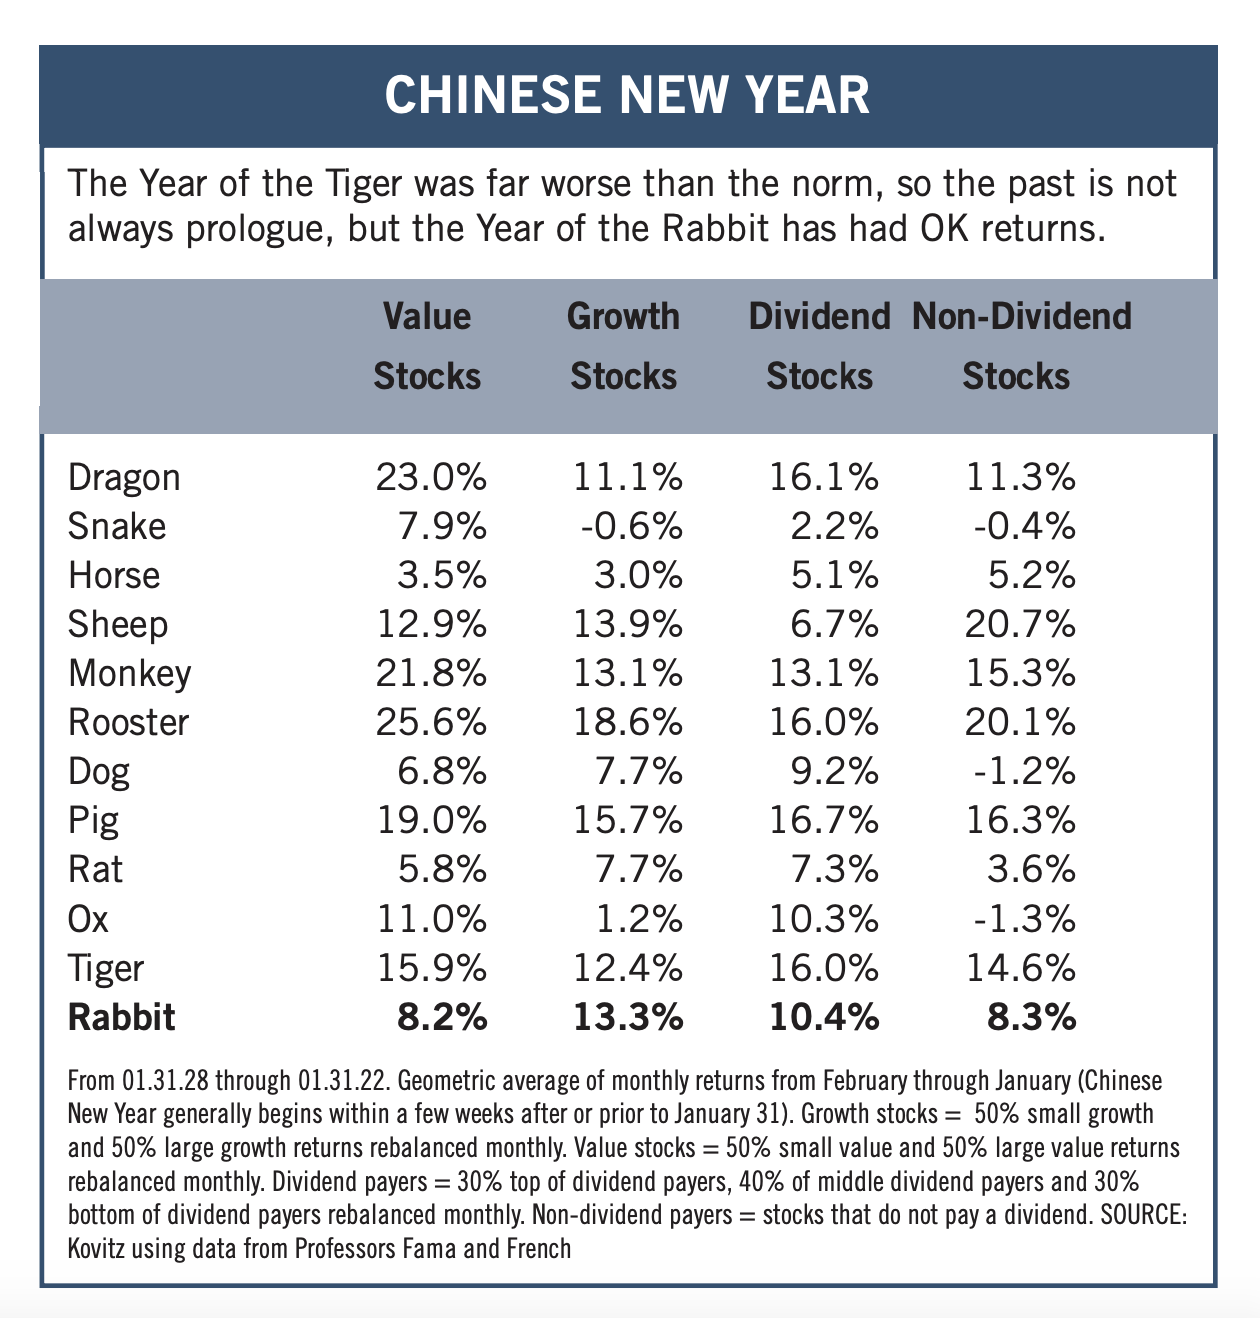
With the major market averages enjoying excellent returns in the first month of 2023, the January Barometer would argue for stronger-than-usual performance over the balance of the year. Of course, the past is merely a guide and not the gospel as stocks sank last year, despite what precedent suggested for the 2nd Year of the Presidency, a Los Angels Rams Super Bowl LVI victory and the Year of the Tiger in the Chinese Zodiac. Of course, no matter the calendar study, almost every review of the historical evidence favors Value-oriented strategies.
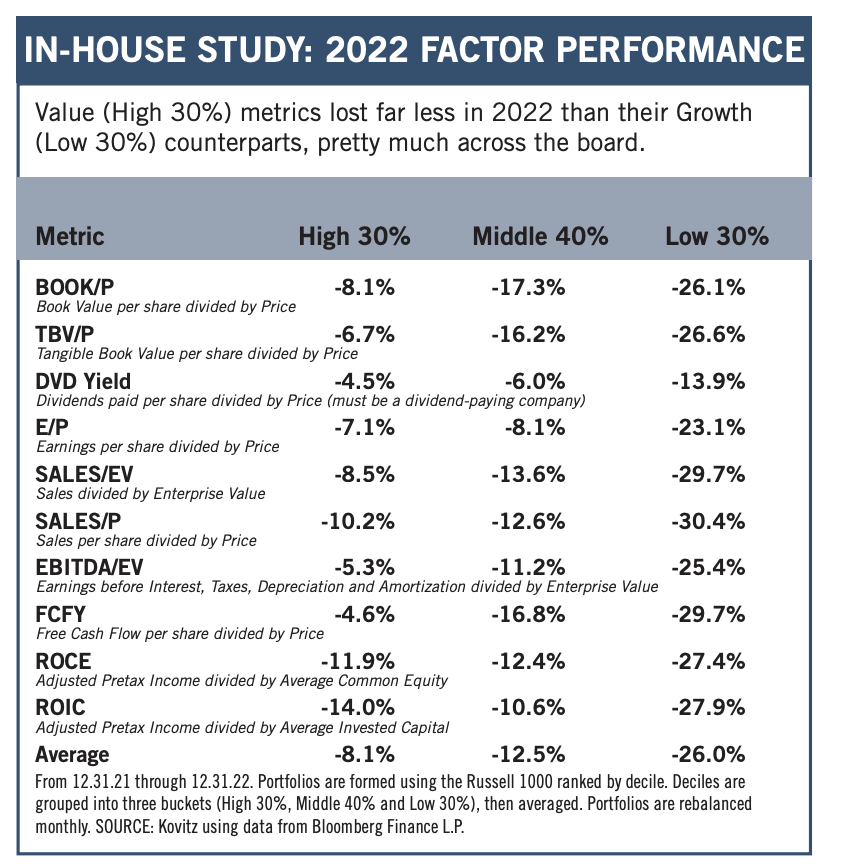
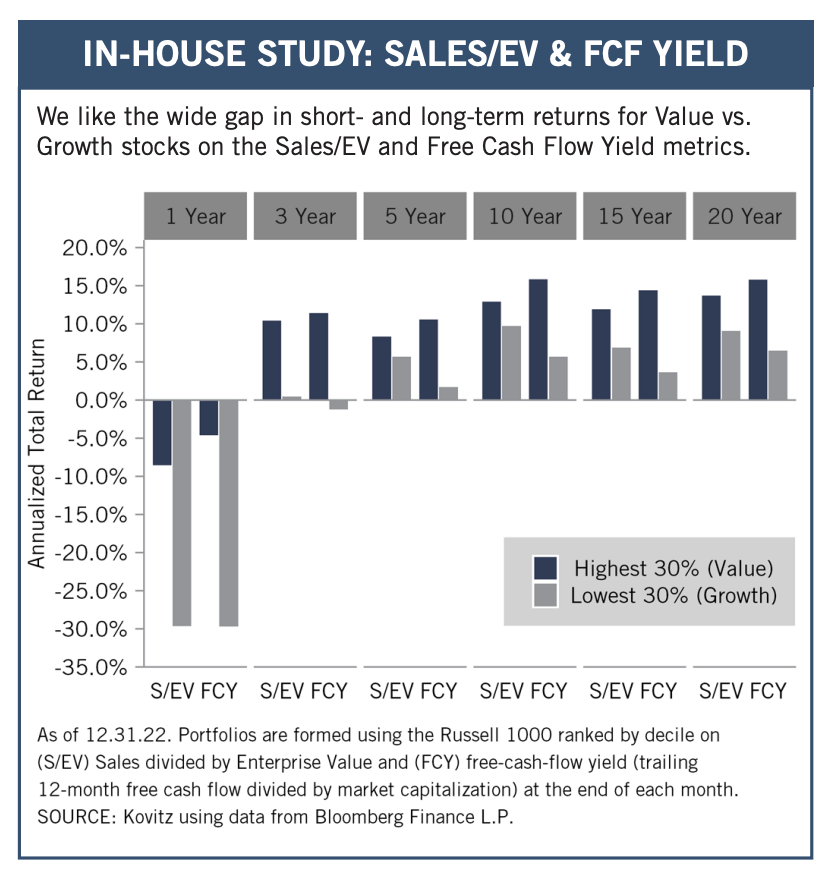
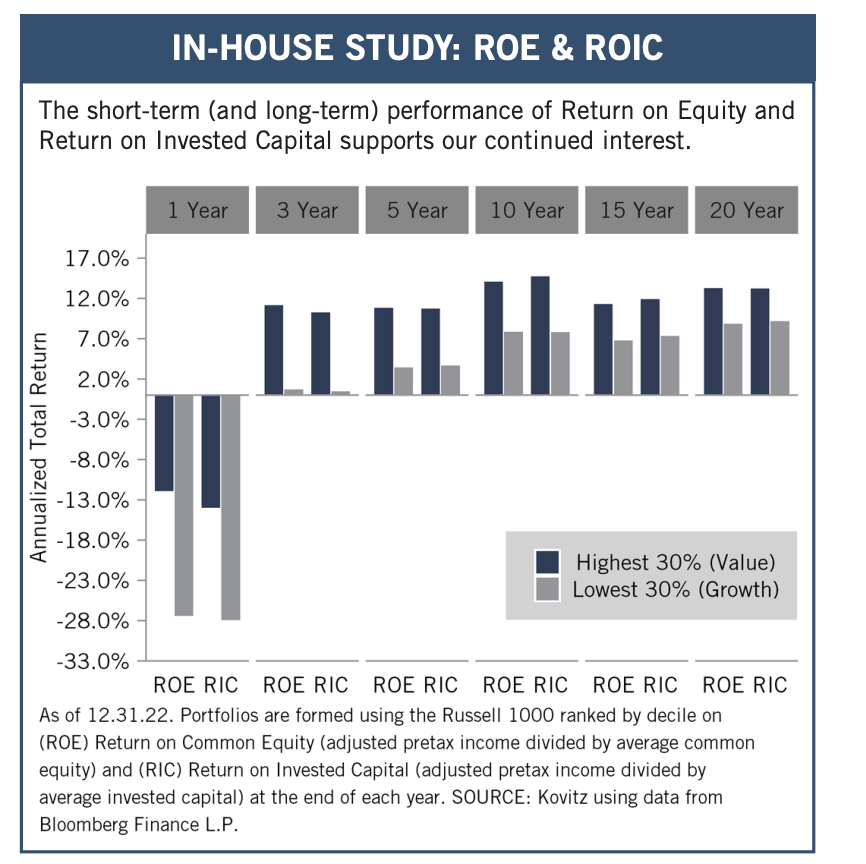
Graphic Detail: Valuation Factors
Value stocks, per data from June 1927 through December 2022 compiled by Professors Eugene F. Fama and Kenneth R. French, have won the long-term performance derby over Growth by a score of 13.2% to 9.5% per annum. And, via a separate data series, the duo has calculated that Dividend-Paying stocks have outperformed NonDividend-Payers by a per-year tally of 10.7% to 8.8% over the same nine-plus decades. Those return gaps are large, especially when one considers the impact of compounding over multi-year periods. It is little wonder, then, given our multi-year time horizon, that we remain loyal to our four-plus-decade-old strategy of buying and harvesting portfolios of what we believe to be undervalued stocks, most often of dividend-paying companies.
While we think that folks would naturally gravitate toward inexpensive stocks, given that most seek bargains in their everyday lives, it was nice to see Value-oriented strategies outperform by a wide margin in 2022. We were not unhappy to see high flying, richly-priced names like Amazon, Nvidia and Tesla return to earth, even as the investor exodus from Tech also hit stocks that we have long held like Alphabet, Microsoft and Apple
Of course, we are not constrained by arbitrary definitions of Value and Growth, even as metrics on our portfolios like Price to Book Value, Price to Sales and Price to Earnings are very much in the Value camp. We are constantly reviewing various valuation factors to determine which might be additive to our analytics, and we find, for example, that Free Cash Flow Yield and Return on Common Equity score very well over all periods studied.
Recommended Stock List
In this space, we list all of the stocks we own across our multi-cap-value managed account strategies and in our four newsletter portfolios. See the last page for pertinent information on our flagship TPS strategy, which has been in existence since the launch of The Prudent Speculator in March 1977.
Readers are likely aware that TPS has long been monitored by The Hulbert Financial Digest (“Hulbert”). As industry watchdog Mark Hulbert states, “Hulbert was founded in 1980 with the goal of tracking investment advisory newsletters. Ever since it has been the premiere source of objective and independent performance ratings for the industry.” For info on the newsletters tracked by Hulbert, visit: http://hulbertratings.com/since-inception/.
Keeping in mind that all stocks are rated as “Buys” until such time as we issue an official Sales Alert, we believe that all of the companies in the tables on these pages trade for significant discounts to our determination of longterm fair value and/or offer favorable risk/reward profiles. Note that, while we always seek substantial capital gains, we require lower appreciation potential for stocks that we deem to have more stable earnings streams, more diversified businesses and stronger balance sheets. The natural corollary is that riskier companies must offer far greater upside to warrant a recommendation. Further, as total return is how performance is ultimately judged, we explicitly factor dividend payments into our analytical work.
While we always like to state that we like all of our children equally, meaning that we would be fine in purchasing any of the 100+ stocks, we remind subscribers that we very much advocate broad portfolio diversification with TPS Portfolio holding more than eighty of these companies. Of course, we respect that some folks may prefer a more concentrated portfolio, however our minimum comfort level in terms of number of overall holdings in a broadly diversified portfolio is at least thirty!
TPS rankings and performance are derived from hypothetical transactions “entered” by Hulbert based on recommendations provided within TPS, and according to Hulbert’s own procedures, irrespective of specific prices shown within TPS, where applicable. Such performance does not reflect the actual experience of any TPS subscriber. Hulbert applies a hypothetical commission to all “transactions” based on an average rate that is charged by the largest discount brokers in the U.S., and which rate is solely determined by Hulbert. Hulbert’s performance calculations do not incorporate the effects of taxes, fees, or other expenses. TPS pays an annual fee to be monitored and ranked by Hulbert. With respect to “since inception” performance, Hulbert has compared TPS to 19 other newsletters across 62 strategies (as of the date of this publication). Past performance is not an indication of future results. For additional information about Hulbert’s methodology, visit: http://hulbertratings.com/methodology/.

Portfolio Builder
Each month in this column, we highlight 10 stocks with which readers might populate their portfolios: Archer-Daniels (ADM), Int’l Paper (IP), Pfizer (PFE) and seven others.