Every month, The Prudent Speculator produces a newsletter that includes a market summary, helpful charts and graphs, recent equity market news, economic outlook and specific stock investment strategies focused on value stock investing. This month, we offer a brand-new recommendation of a former high-flyer now trading with a Value price tag, while our Earnings Scorecard feature provides a granular look at what turned out to be solid Q2 report cards for Corporate America. We also include a preview of our current Recommended Stock List and Portfolio Builder section with ten highlighted stocks. Note that the entire list is available to our community of loyal subscribers only.

Editor’s Note: Earnings Scorecard, Interest Rates and GDP Growth
As is often the case, we are navigating by the stars under cloudy skies. – Jerome H. Powell
Assuming one utilizes a measuring stick dating back to the beginning of 1987 when your Editor arrived at our founder Al Frank’s doorstep, August lived down to its reputation as statistically one of the two worst months of the year (September is the other). Even with a post-Jackson-Hole bounce, the market averages all ended decidedly in the red, with the Russell 2000 SmallCap index skidding 5.0% and the equal-weight S&P 500 confirming the broad-based pullback, dipping 3.2%.
Following the sizable advances in June and July, we cannot say it is a big surprise to see stocks give back some of the gains, though we were often left scratching our heads by the rationale proffered for the ebbs and flows during the month. After all, equities struggled ahead of the critical speech on August 25 from Jerome H. Powell at the Federal Reserve Bank of Kansas City’s annual economic confab in Wyoming. With retail sales, the Philadelphia Fed PMI, new home sales and durable goods orders ex-transportation all coming in better than expected, while the labor market remained very healthy, traders were evidently worried that the economy was too strong and the Fed might be forced to hike interest rates again.
Indeed, the yield on the benchmark 10-Year U.S. Treasury climbed from 3.95% at the end of July to as high as 4.34% on August 21, as estimates for real (inflation-adjusted) U.S. GDP growth from the Atlanta Fed for Q3 jumped from 3.5% to more than 5.5%. While few expect such robust growth to be registered when all is said and done, the strong economy is contributing to a surprisingly robust corporate profit outlook for the remainder of the year and into 2024. Throw in a terrific Q2 earnings reporting season with far more companies than usual exceeding bottom-line expectations and we find little reason to complain about a positive economic backdrop.
This is especially true in that the consumer price index rose 3.2% in July on an annual basis, a smaller-than-projected increase, while the Fed’s favorite gauge, the core personal consumption expenditure price index (PCE), came in as expected with a 4.2% year-over-year advance.
Of course, even as Chair Powell has consistently made statements like, “At upcoming meetings, we will assess our progress based on the totality of the data and the evolving outlook and risks,” traders became more enthused when his Jackson Hole speech elaborated, “Based on this assessment, we will proceed carefully as we decide whether to tighten further or, instead, to hold the policy rate constant and await further data.”
The proceed carefully language seemingly trumped Mr. Powell’s forceful introduction, “It is the Fed’s job to bring inflation down to our 2 percent goal, and we will do so,” leading many to conclude that an additional hike in the Fed Funds rate at the FOMC Meeting September 19-20 is less likely. Such views were supported over the final few days of August by weaker-than-expected readings on consumer sentiment/confidence, job openings, personal incomes and Q2 GDP growth.
Not quite Alice Through the Looking Glass, but those of us who focus on the long-term business prospects of the companies in which we are invested might be left a bit puzzled when good news on the economy sends stocks into the red and bad news shoots them into the green. However, we remember Warren Buffett’s admonition, “The fact that people will be full of greed, fear, or folly is predictable. The sequence is not predictable.”
While we expect volatility to remain elevated, especially as trading volumes pick up after Labor Day, we see no reason to alter our view that the attractive valuations (forward P/E ratio of 12.9 and dividend yield of 2.8% for TPS Portfolio) of stocks we have long championed will continue to provide handsome returns over our multi-year holding period. This is the case whether or not Powell & Co. manage to pull off an economic soft landing.
Graphic Detail: Earnings Scorecard
Q2 Season
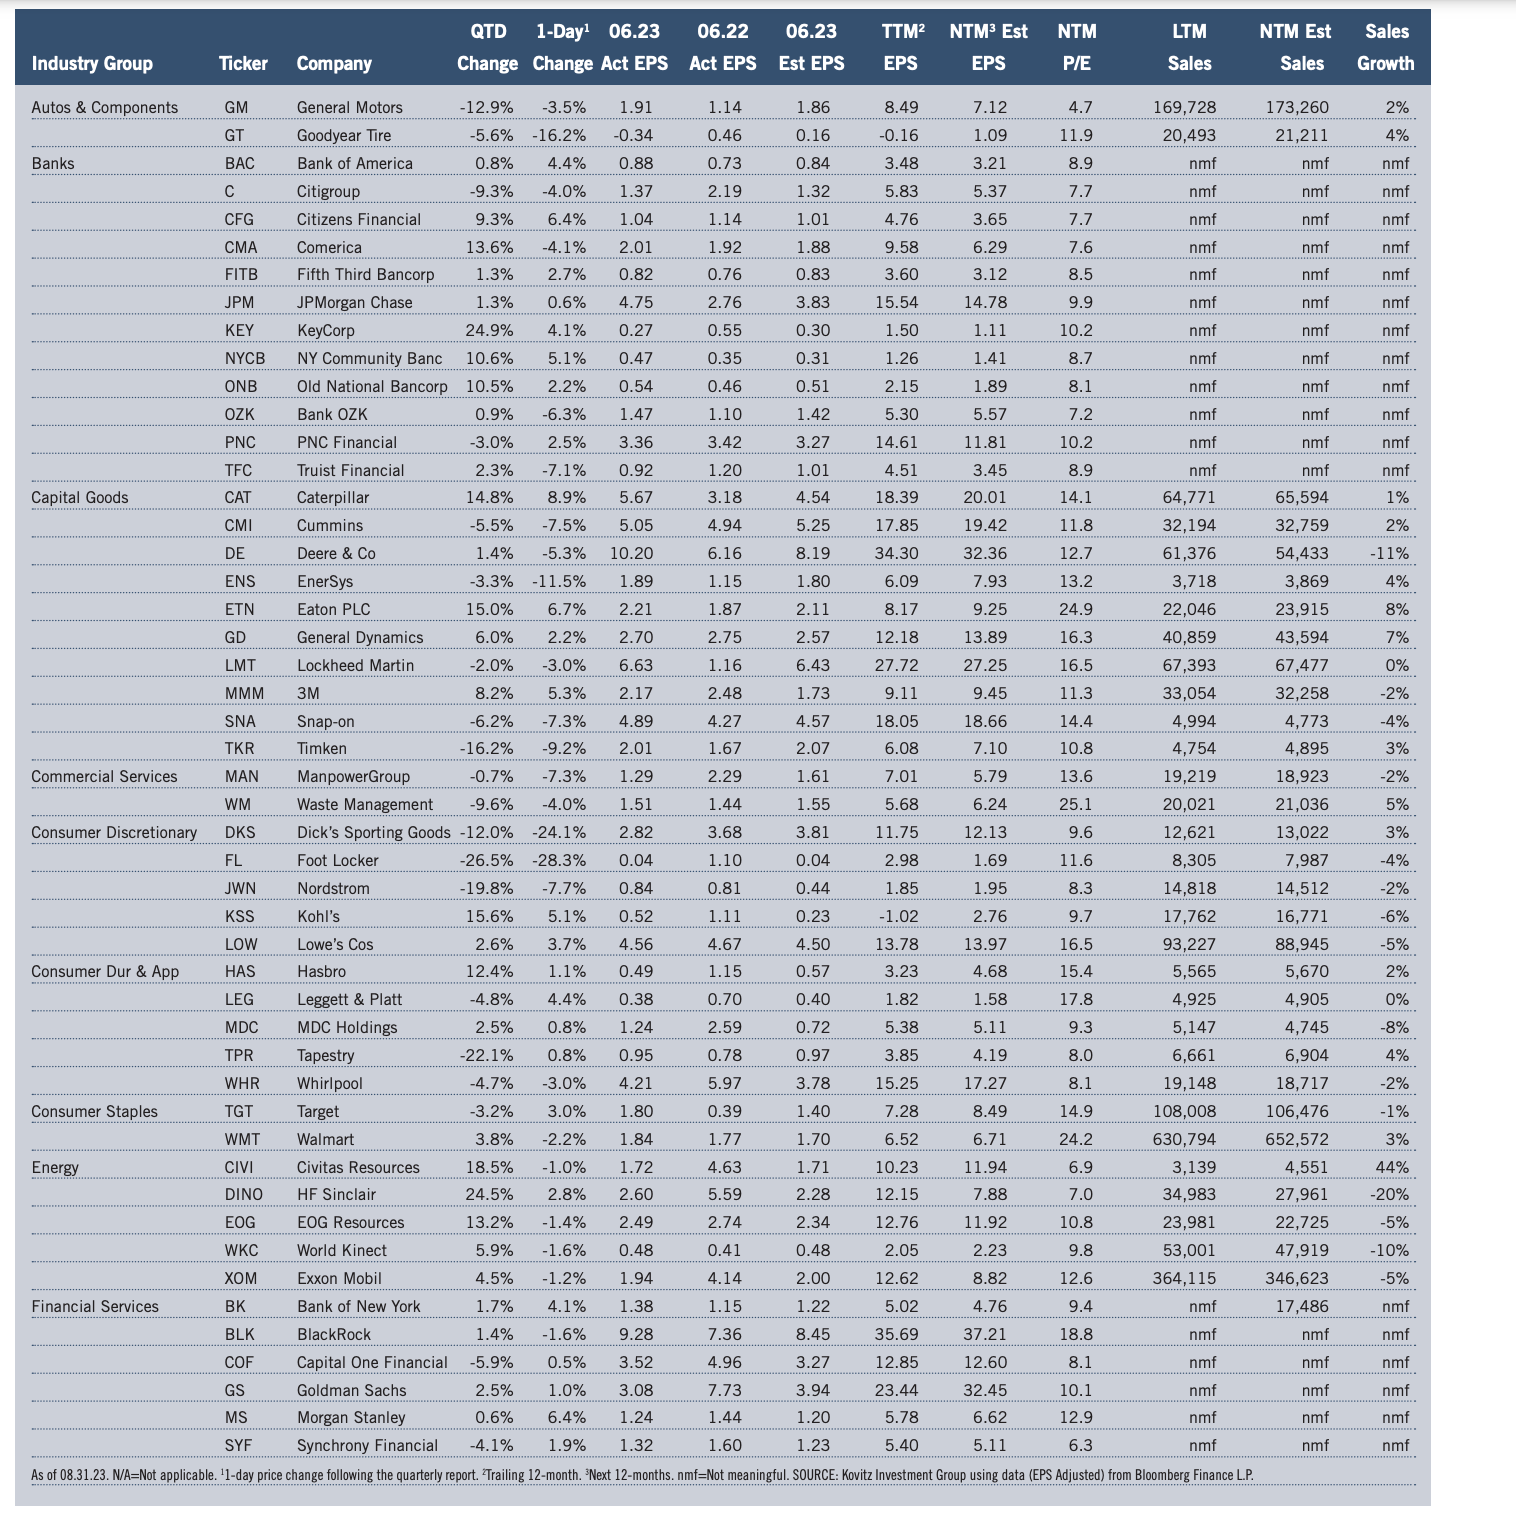
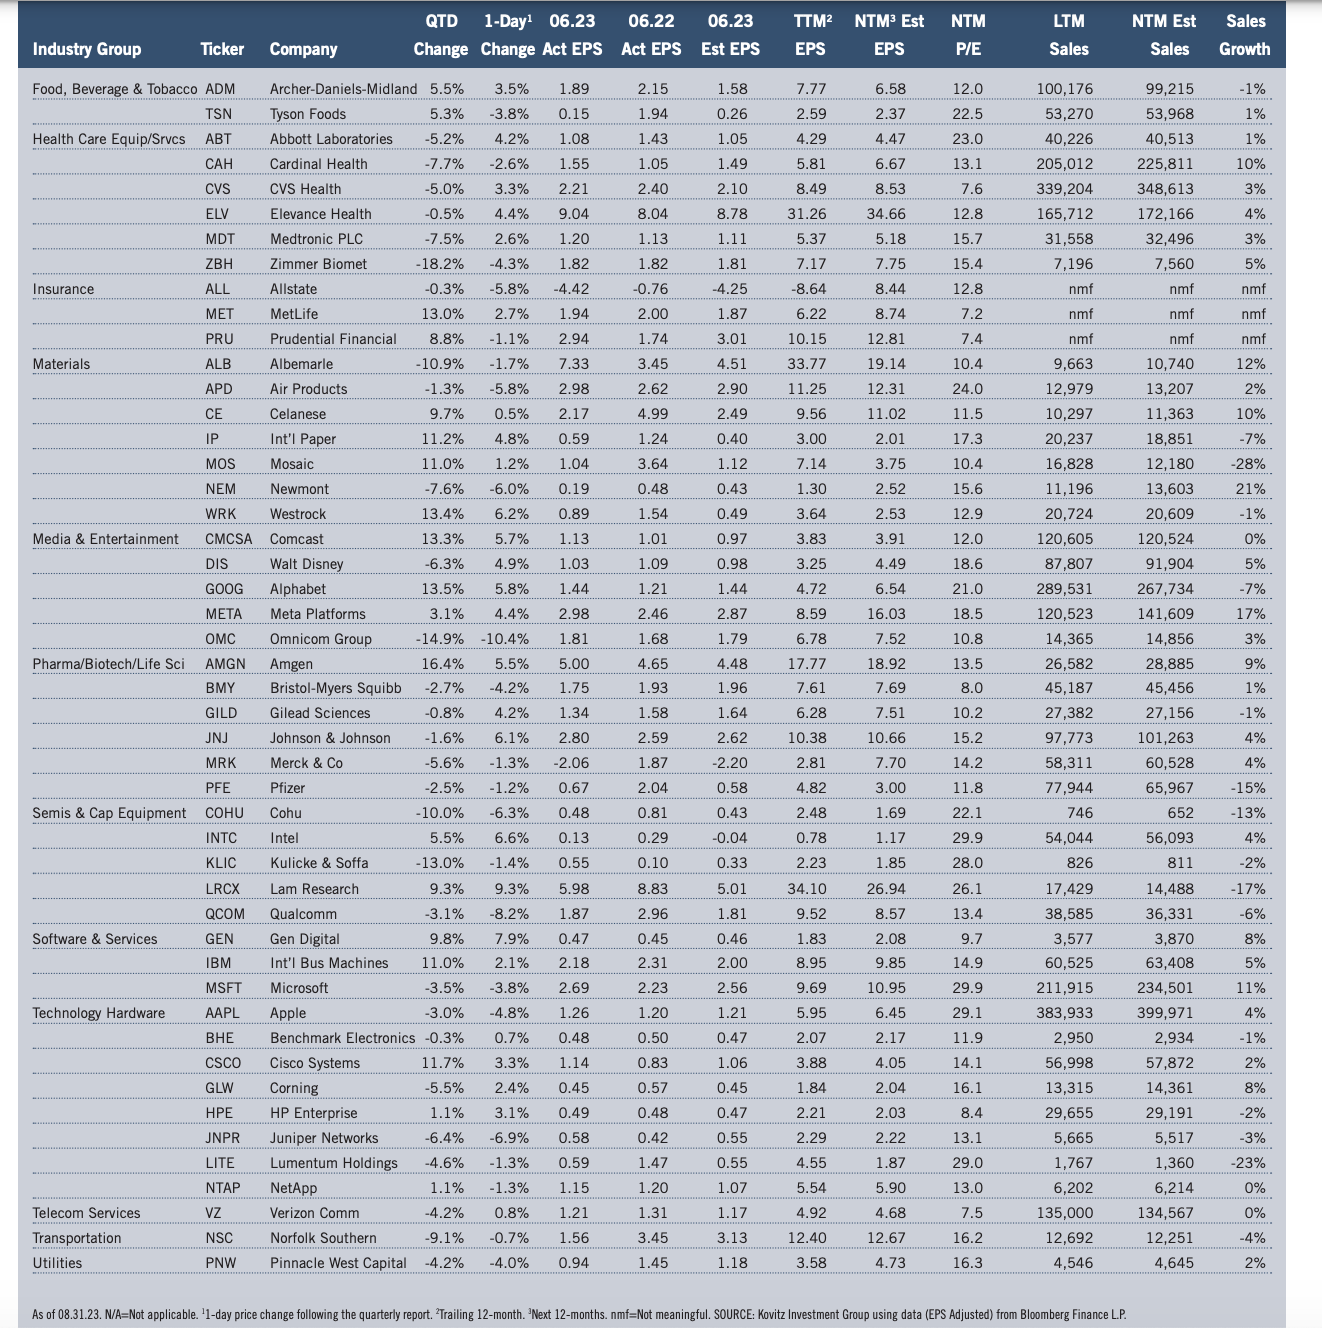
Economic numbers in the period generally exceeded expectations and real (inflation-adjusted) U.S. GDP growth came in at 2.1% in Q2, supporting solid revenue and net income numbers from Corporate America, even as management teams engaged in their usual tempering of guidance. Impressively, the number of S&P 500 companies that exceeded bottom-line forecasts was 80.0%, well above the usual “beat” rate, while 58.3% eclipsed top-line projections. Of The Prudent Speculator’s 97 stocks presented in our Earnings Scorecard, 71% topped EPS expectations, even as the average one-day price reaction was a loss of 0.6%, though there were a few sizable advances.
Standard & Poor’s projects (as of 8.31.23) that after dipping from $208.21 in 2021 to $196.95 in 2022 (last year’s figure includes a massive $66.9 billion ($4.74 per share) “unrealized investment” loss from Berkshire Hathaway in Q2), bottom-up operating EPS for the S&P 500 will rise to $220.25 in 2023, with $246.06 the guess for 2024. Estimates are subject to change (current forecasts are a bit higher than those three months ago) and many still believe a recession is imminent, but anything close to the ‘23 and ‘24 tallies should support much higher stock prices.
Recommended Stock List
In this space, we list all of the stocks we own across our multi-cap-value managed account strategies and in our four newsletter portfolios. See the last page for pertinent information on our flagship TPS strategy, which has been in existence since the launch of The Prudent Speculator in March 1977.
Readers are likely aware that TPS has long been monitored by The Hulbert Financial Digest (“Hulbert”). As industry watchdog Mark Hulbert states, “Hulbert was founded in 1980 with the goal of tracking investment advisory newsletters. Ever since it has been the premiere source of objective and independent performance ratings for the industry.” For info on the newsletters tracked by Hulbert, visit: http://hulbertratings.com/since-inception/.
Keeping in mind that all stocks are rated as “Buys” until such time as we issue an official Sales Alert, we believe that all of the companies in the tables on these pages trade for significant discounts to our determination of long-term fair value and/or offer favorable risk/reward profiles. Note that, while we always seek substantial capital gains, we require lower appreciation potential for stocks that we deem to have more stable earnings streams, more diversified businesses and stronger balance sheets. The natural corollary is that riskier companies must offer far greater upside to warrant a recommendation. Further, as total return is how performance is ultimately judged, we explicitly factor dividend payments into our analytical work.
While we always like to state that we like all of our children equally, meaning that we would be fine in purchasing any of the 100+ stocks, we remind subscribers that we very much advocate broad portfolio diversification with TPS Portfolio holding more than eighty of these companies. Of course, we respect that some folks may prefer a more concentrated portfolio, however our minimum comfort level in terms of number of overall holdings in a broadly diversified portfolio is at least thirty!
TPS rankings and performance are derived from hypothetical transactions “entered” by Hulbert based on recommendations provided within TPS, and according to Hulbert’s own procedures, irrespective of specific prices shown within TPS, where applicable. Such performance does not reflect the actual experience of any TPS subscriber. Hulbert applies a hypothetical commission to all “transactions” based on an average rate that is charged by the largest discount brokers in the U.S., and which rate is solely determined by Hulbert. Hulbert’s performance calculations do not incorporate the effects of taxes, fees, or other expenses. TPS pays an annual fee to be monitored and ranked by Hulbert. With respect to “since inception” performance, Hulbert has compared TPS to 19 other newsletters across 62 strategies (as of the date of this publication). Past performance is not an indication of future results. For additional information about Hulbert’s methodology, visit: http://hulbertratings.com/methodology/.

Portfolio Builder
Each month in this column, we highlight 10 stocks with which readers might populate their portfolios: Mosaic (MOS), PayPal (PYPL), Bank OZK (OZK) and seven others.