
Every month, The Prudent Speculator produces a newsletter that includes a market summary, helpful charts and graphs, recent equity market news, economic outlook and specific stock investment strategies focused on value stock investing. In this month’s newsletter we discuss geopolitical news, seasonal favoritism, equity pullbacks, and presidential performance averages. We also include a preview of our current Recommended Stock List and Portfolio Builder section with ten highlighted stocks. Note that the entire list is available to our community of loyal subscribers only.

Editor’s Note: Geopolitical News, Equity Pullbacks and the Fed Funds Rate
“Remember that market quotations are there for convenience, either to be taken advantage of or to be ignored.” — Benjamin Graham
The human suffering in Israel, Gaza and Ukraine no doubt dwarfs the trials and tribulations of the equity markets, but stocks tumbled again in October. Marking the third straight miserable month, another sizable setback sent the average constituent of the Russell 3000 index to a year-to-date total return of minus 5.7% as of the end of October, with the S&P 500 falling into its first and the Russell 3000 Value index enduring its second 10% correction of the year just two trading days prior.
Geopolitical events have weighed on investor psyches, to be sure, but we might argue that movements in stocks these days make about as much sense as Lewis Carroll’s The Mad Hatter: “Nothing would be what it is because everything would be what it isn’t. And contrariwise, what it is, it wouldn’t be, and what it wouldn’t be, it would. You see?”
After all, equities touched their lows the penultimate week of October seemingly because economic data was too strong. Indeed, Q3 U.S. GDP growth came in better than expected at a 4.9% real (inflation-adjusted) rate as consumer spending remained robust, while personal incomes grew modestly. The housing market also held up better than most might have thought in September, with both new home sales and pending sales of existing homes topping much more pessimistic estimates.
In addition, orders for durable goods exceeded expectations in September, with a 0.5% advance excluding the volatile transportation sector, first-time filings for unemployment benefits continued to hover near multi-generational lows, and the October factory and service sector PMI’s as calculated by Standard & Poor’s beat forecasts, with Chris Williamson, chief business economist at S&P Global Market Intelligence, stating, “Hopes of a soft landing for the U.S. economy will be encouraged by the improved situation seen in October.”
Even news on the inflation front was OK, as the Federal Reserve’s preferred price measure, the core personal consumption expenditure index, matched forecasts, rising 3.7% year-over-year in September, with expectations for additional Fed rate hikes retreating modestly.
We suspect the turn of the calendar to the seasonally favorable time of the year turned a few frowns upside down, but equities enjoyed a handsome rebound the first four days of Halloween week. It wasn’t as if the news from the Middle East improved, so many credited the bounce to an ADP jobs report that showed private sector payroll additions of only 113,000, below estimates of a 150,000 increase, while the ISM Manufacturing Index skidded to a reading of 46.7, well below expectations and signaling a contraction in the factory sector.
While all eyes had been on the decision on interest rates on Nov. 1, traders were busy placing their bets on whether Jerome H. Powell & Co. would continue to leave the Fed Funds rate unchanged for a third consecutive FOMC Meeting. Weaker economic numbers, the thinking went, would provide the Fed cover to be less hawkish in its approach to monetary policy and vice versa.
Of course, we favor a healthier economic backdrop as we subscribe to Ben Graham’s view, “A stock is not just a ticker symbol or an electronic blip; it is an ownership interest in an actual business, with an underlying value that does not depend on its share price.”
We respect that further increases in interest rates could add more competition for equities, but we believe that the U.S. economy will remain resilient, with any potential recession mild in nature, and that corporate profits and dividend payments will continue to grow into 2024 and beyond. Further, we like that the valuations on TPS Portfolio (forward P/E of 12 and yield of 3.1%) are still very attractive, even with a 10-Year U.S. Treasury yield near 5%.
We suspect stock prices will remain volatile, but as Warren Buffett states, “The future is never clear…Uncertainty actually is the friend of the buyer of long-term values.”
Graphic Detail
Seasonal Favoritism
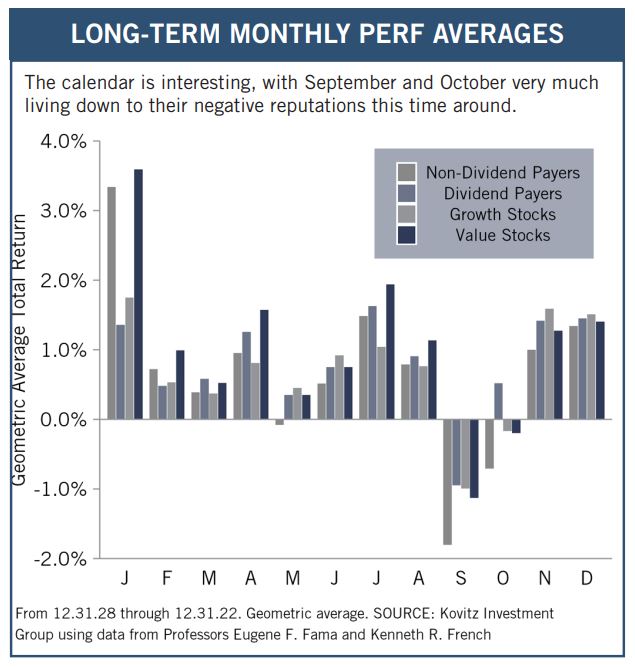
Ninety-four years of data show September and October, on average, to be the two worst months of the year. This time around, the scary duo each provided tricks rather than treats, with much greater red ink spilled for stocks than historically has been the norm.
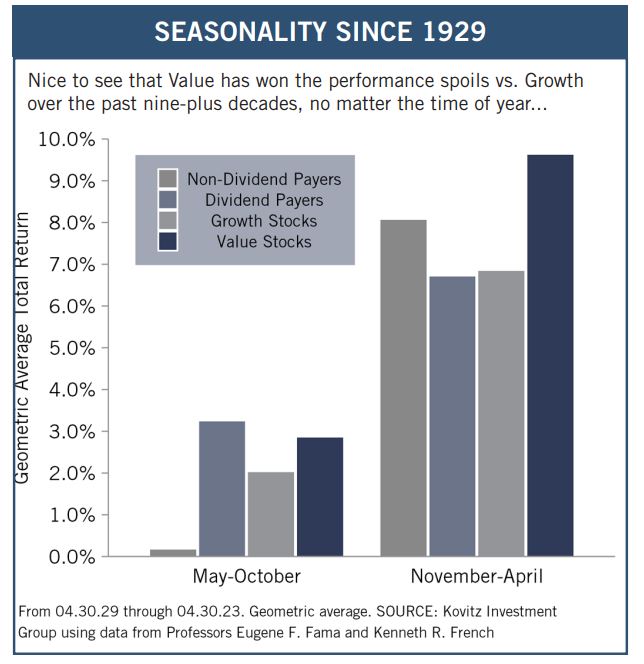
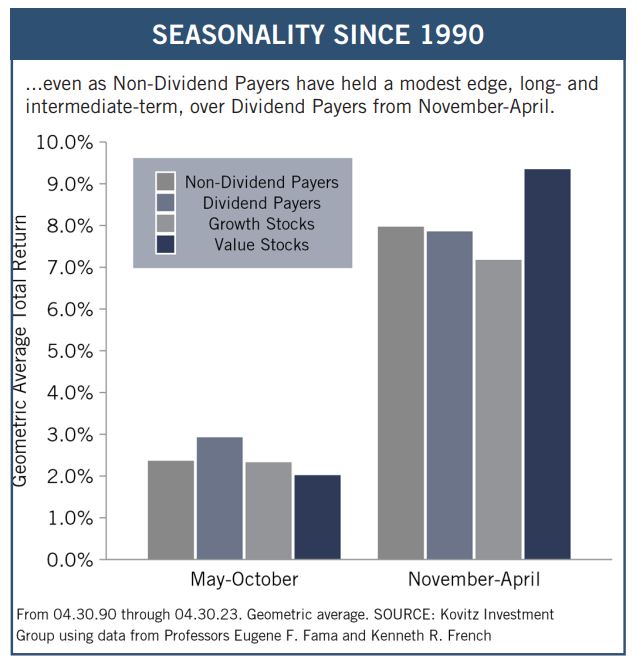
We are pleased, then, that the calendar has hit the Thanksgiving month, and the start of the seasonally favorable six months of the year. Indeed, Halloween to May Day has seen terrific performance, on average, since 1990 and going all the way back to 1929. And Value Stocks historically have asserted their dominance during this span, even as Dividend Payers have lagged Non-Dividend Payers. Alas, with the war in Ukraine amping geopolitical risks, economic worries increasing and uncertainty rising about inflation and the Federal Reserve, the latest November-through-April total-return span failed to live up to its positive precedent as the equal-weight S&P 500 fell 1.61% and the Russell 3000 Value index dipped 2.10%.
Because the other six months have not performed as well, some might argue to “Sell in May and Go Away,” but the less-favorable period also has been positive on average, though the one just completed saw the Russell 3000 Value index drop 4.18% from April 30 to October 31. We also note that while trading commissions generally are now zero, gains generated from short-term trading strategies would be taxed at the higher ordinary income rate, so we think it far better to focus on the long-term prospects of our stocks, rather than the calendar. Still, we don’t mind that the November-to-January period historically has been the most wonderful time of the year!
Graphic Detail
Presidential Cycle
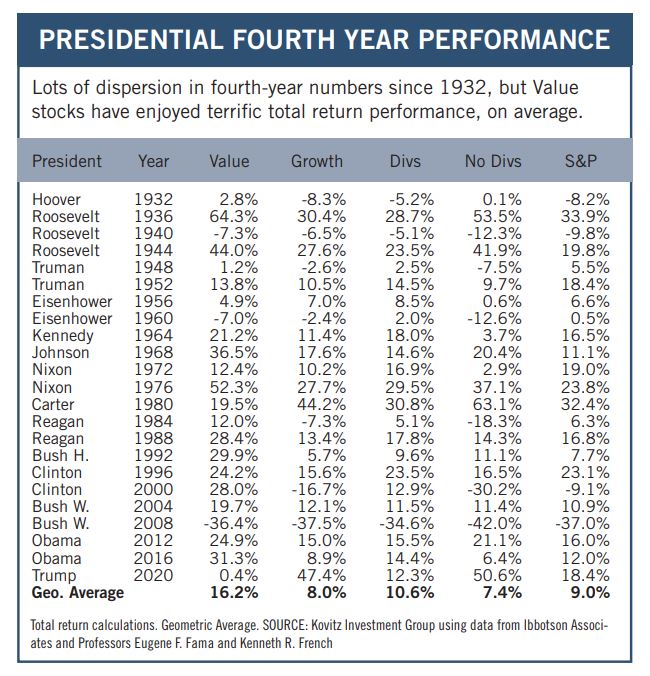
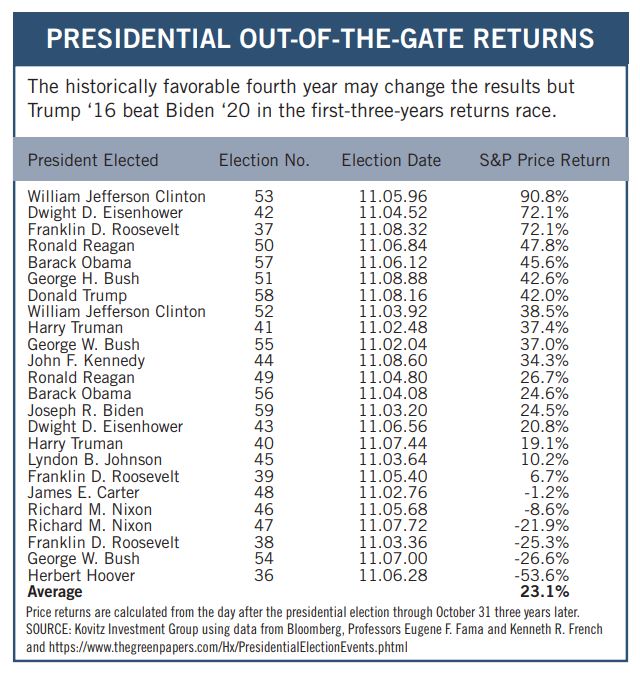
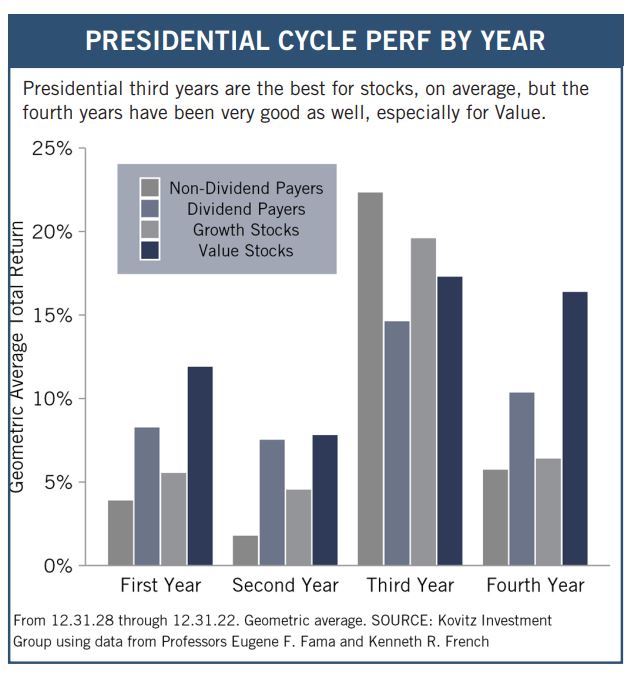
We must always be careful about drawing significant conclusions from a small number of data points, but it is interesting to look at equity market returns in each of the four calendar years of the Presidential Cycle. Given that the Commander in Chief often makes tough choices early on, while doing everything possible to spur the economy late in the four years to ensure personal or party re-election, we suppose that it should not be a big surprise that equities in general have not performed as well on average in the first couple of years of the presidency and much better on average over the last two years.
To be sure, the last two presidencies have been anything but ordinary, yet the solid 24.5% price appreciation for the S&P 500 since Election Day 2020 and the 42.0% gain over the first three years after Election Day 2016 were not bad, especially as those returns do not include dividends and so many supposed market experts were predicting that a Biden victory three years ago and a Trump victory seven years ago would lead to big losses in the equity markets. We’ll see what 2024 brings, but nine decades of history show that Value Stocks have enjoyed a superb geometric average annual total return of 16.2% in the fourth calendar year of the Presidential Cycle, with 1940, 1960 and 2008 the only years in the red, while Dividend Payers have also won their performance derby.
Prior returns are no guarantee of future returns or even profitability, and we note that despite the long-term numbers in the bottom chart below, 2023 has not been grand thus far for most stocks. Still, though history is merely a guide and never the gospel, we find it quite valuable.
Recommended Stock List
In this space, we list all of the stocks we own across our multi-cap-value managed account strategies and in our four newsletter portfolios. See the last page for pertinent information on our flagship TPS strategy, which has been in existence since the launch of The Prudent Speculator in March 1977.
Readers are likely aware that TPS has long been monitored by The Hulbert Financial Digest (“Hulbert”). As industry watchdog Mark Hulbert states, “Hulbert was founded in 1980 with the goal of tracking investment advisory newsletters. Ever since it has been the premiere source of objective and independent performance ratings for the industry.” For info on the newsletters tracked by Hulbert, visit: http://hulbertratings.com/since-inception/.
Keeping in mind that all stocks are rated as “Buys” until such time as we issue an official Sales Alert, we believe that all of the companies in the tables on these pages trade for significant discounts to our determination of long-term fair value and/or offer favorable risk/reward profiles. Note that, while we always seek substantial capital gains, we require lower appreciation potential for stocks that we deem to have more stable earnings streams, more diversified businesses and stronger balance sheets. The natural corollary is that riskier companies must offer far greater upside to warrant a recommendation. Further, as total return is how performance is ultimately judged, we explicitly factor dividend payments into our analytical work.
While we always like to state that we like all of our children equally, meaning that we would be fine in purchasing any of the 100+ stocks, we remind subscribers that we very much advocate broad portfolio diversification with TPS Portfolio holding more than eighty of these companies. Of course, we respect that some folks may prefer a more concentrated portfolio, however our minimum comfort level in terms of number of overall holdings in a broadly diversified portfolio is at least thirty!
TPS rankings and performance are derived from hypothetical transactions “entered” by Hulbert based on recommendations provided within TPS, and according to Hulbert’s own procedures, irrespective of specific prices shown within TPS, where applicable. Such performance does not reflect the actual experience of any TPS subscriber. Hulbert applies a hypothetical commission to all “transactions” based on an average rate that is charged by the largest discount brokers in the U.S., and which rate is solely determined by Hulbert. Hulbert’s performance calculations do not incorporate the effects of taxes, fees, or other expenses. TPS pays an annual fee to be monitored and ranked by Hulbert. With respect to “since inception” performance, Hulbert has compared TPS to 19 other newsletters across 62 strategies (as of the date of this publication). Past performance is not an indication of future results. For additional information about Hulbert’s methodology, visit: http://hulbertratings.com/methodology/.

Portfolio Builder
Each month in this column, we highlight 10 stocks with which readers might populate their portfolios: Norfolk Southern (NSC), NY Community Bancorp (NYCB), Hasbro (HAS) and seven others.