
Every month, The Prudent Speculator produces a newsletter that includes a market summary, helpful charts and graphs, recent equity market news, economic outlook and specific stock investment strategies focused on value stock investing. This month, our Graphic Detail reviews Newsletter Portfolio Sector Weightings as well as Index Performance Attribution, while our Editor’s Note provides more support for our oft-stated admonition, “The only problem with market timing is getting the timing right!”. We also include a preview of our current Recommended Stock List and Portfolio Builder section with ten highlighted stocks. Note that the entire list is available to our community of loyal subscribers only.

Editor’s Note: “The only problem with market timing is getting the timing right!”
With equities enjoying a sensational December, pushing the full-year total return for the average stock in the Russell 3000 index to 13.8% and in the Russell 3000 Value index to 12.5%, we again witnessed last year why the only problem with market timing is getting the timing right. After all, The Wall Street Journal in the final edition of 2023 proclaimed, “Almost no one thought 2023 would be a blockbuster year for stocks. They could hardly have been more wrong. The Federal Reserve raised interest rates at the fastest clip since the 1980s, a regional banking crisis felled Silicon Valley Bank, and war broke out in the Middle East. Yet stocks kept climbing.”
The WSJ did not inquire on our outlook, but your Editor thought 2023 would be a good year, though it would be front-page news if we were ever pessimistic about the prospects of our broadly diversified portfolios of what we believe to be undervalued stocks. Still, this is what was said in print in the annual ThinkAdvisor Buckingham interview in December 2022.
Stocks will perform better than they have historically, on average, because they performed far worse this year, on average. I expect returns to be about 13% for the market and 15% for value [stocks].
Another factor supporting higher prices next year is that it will be the third year in the presidential cycle, and that historically is the best of the four years. It’s also likely that investors will look at stocks a little more favorably because the Federal Reserve is likely to be done raising interest rates next year. So the potential of more rate increases won’t be hanging over investors’ heads.
The stock market is an anticipating mechanism; the fact that we’re down this year means it has discounted something. It could be that interest rates have gone up more than people had thought, or it’s discounted an economic slowdown.
That upbeat take was suspect in late-October, but we are perplexed that many seem to forget that traders always discount some vision of the future, with the pain of 2022 likely having much to do with the pleasure of 2023.
To be sure, it didn’t hurt that the economy managed to avoid a recession last year and the Fed did signal that it is likely done with rate hikes for this tightening cycle, but it isn’t as if a guess of double-digit returns for Value was going out on a limb. Indeed, inexpensively priced equities have gained more than 13% per annum since 1977!
We claim no prognostication prowess and we will always believe that time in the market trumps market timing, but this is what was said in the latest early-November 2023 ThinkAdvisor Buckingham interview: Anybody who thinks that stocks will not appreciate next year is super-bearish. I expect an overall market return of 9% to 10% amid high volatility, with a 15% return for value stocks partly because it’s been a couple of lousy years for value.
We concede that the big gains of November and December make that 15% prediction for Value tougher to achieve, but we continue to believe the economy will remain supportive of higher corporate profits, even if we endure a mild recession. Further, Value stocks on a price-to-earnings basis remain undervalued versus their average over the last 28 years, while the big drop in interest rates over the last two months adds to the relative appeal of equities. In addition, the Fourth Year of the Presidency historically has been very favorable for Value.
Obviously, there is plenty to worry about, with the Russia/Ukraine and Hamas/Israel conflicts still raging, but we see no reason to alter our time-tested approach of simply buying undervalued stocks and patiently harvesting when they approach fair value. Yes, we won’t be able to sidestep downside volatility, but we do not fear the ups and downs as they provide long-term opportunity, while we agree with the Yankee Hall-of-Famer who said, “It’s tough to make predictions, especially about the future.”
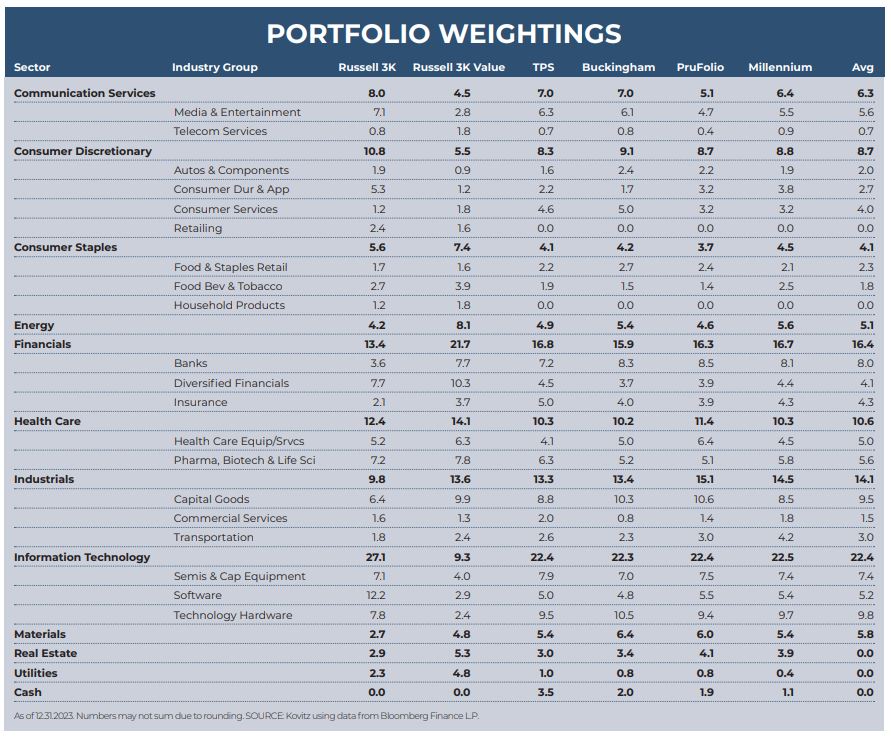
Graphic Detail: Sector and Industry Group Weightings, Value vs. Growth Sector Attribution
Time again to compare the current sector and industry group weightings of our four newsletter portfolios to those of the broad-based Russell 3000 and Russell 3000 Value indexes, noting that our valuation metrics more closely resemble those of Value-oriented gauges. While we very much remain bottom-up stock pickers focused on the merits of individual companies, we also keep an eye on the composition of the indexes in order to ensure that we are comfortable in the over- or under-weighting of a particular sector or industry group. As such, we are able to better focus our subjective reviews on the output of the objective new-idea generation screens that we run every day on areas in which we might desire additional exposure, be it to augment a sector with minimal ownership or to add to a particularly undervalued industry. Illustrative of this process were new recommendations in 2023 of stocks in the Consumer Staples, Energy and Financial sectors.
There is a great deal of art accompanying the science of portfolio construction and sector and industry group weightings are always used as a guide and not as the gospel. Over time, the gaps have narrowed, but inevitably there will be dispersion across the newsletter portfolios due to the timing of purchases and modest differences in the names held, even as the same desire for broad diversification has always been pervasive.
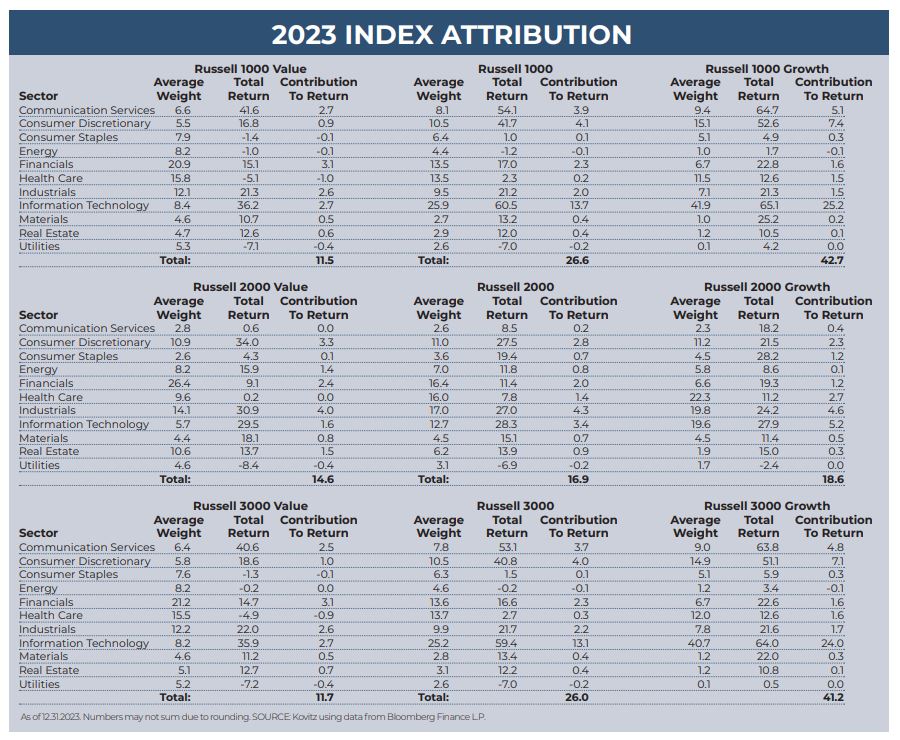
The following two paragraphs hardly do the subject justice, but the simple attribution displayed below helps to better understand which market sectors contributed the most (or least) to index returns. Given our willingness to buy stocks of any market capitalization, we look at the large-cap Russell 1000, the small-cap Russell 2000 and the all-cap Russell 3000 indexes, as well as the Value and Growth versions of each benchmark. We note that our portfolios, with what we believe to be their inexpensive valuations, have long resembled the Value indexes in terms of their financial metrics, even as our sector weightings have more often than not been lighter in Financials and heavier in Information Technology stocks.
Completely reversing what was witnessed in 2022 when Growth was battered, there was another large return chasm for the Russell indexes last year, though it is difficult to complain about the handsome double-digit percentage gains for Value in 2023. Returns for the Russell 2000 indexes had the smallest dispersion, even as the Growth component beat the Value, due almost entirely to its much-heavier weighting in Info Tech. The larger-cap Russell 1000 and 3000 Growth benchmarks benefitted mightily from exposure to the Magnificent Seven (Alphabet, Amazon, Apple, Meta Platforms, Microsoft, Nvidia & Tesla), while the Financial sector provided the largest contribution to return for the Value indexes.
Recommended Stock List
In this space, we list all of the stocks we own across our multi-cap-value managed account strategies and in our four newsletter portfolios. See the last page for pertinent information on our flagship TPS strategy, which has been in existence since the launch of The Prudent Speculator in March 1977.
Readers are likely aware that TPS has long been monitored by The Hulbert Financial Digest (“Hulbert”). As industry watchdog Mark Hulbert states, “Hulbert was founded in 1980 with the goal of tracking investment advisory newsletters. Ever since it has been the premiere source of objective and independent performance ratings for the industry.” For info on the newsletters tracked by Hulbert, visit: http://hulbertratings.com/since-inception/.
Keeping in mind that all stocks are rated as “Buys” until such time as we issue an official Sales Alert, we believe that all of the companies in the tables on these pages trade for significant discounts to our determination of long-term fair value and/or offer favorable risk/reward profiles. Note that, while we always seek substantial capital gains, we require lower appreciation potential for stocks that we deem to have more stable earnings streams, more diversified businesses and stronger balance sheets. The natural corollary is that riskier companies must offer far greater upside to warrant a recommendation. Further, as total return is how performance is ultimately judged, we explicitly factor dividend payments into our analytical work.
While we always like to state that we like all of our children equally, meaning that we would be fine in purchasing any of the 100+ stocks, we remind subscribers that we very much advocate broad portfolio diversification with TPS Portfolio holding more than eighty of these companies. Of course, we respect that some folks may prefer a more concentrated portfolio, however our minimum comfort level in terms of number of overall holdings in a broadly diversified portfolio is at least thirty!
TPS rankings and performance are derived from hypothetical transactions “entered” by Hulbert based on recommendations provided within TPS, and according to Hulbert’s own procedures, irrespective of specific prices shown within TPS, where applicable. Such performance does not reflect the actual experience of any TPS subscriber. Hulbert applies a hypothetical commission to all “transactions” based on an average rate that is charged by the largest discount brokers in the U.S., and which rate is solely determined by Hulbert. Hulbert’s performance calculations do not incorporate the effects of taxes, fees, or other expenses. TPS pays an annual fee to be monitored and ranked by Hulbert. With respect to “since inception” performance, Hulbert has compared TPS to 19 other newsletters across 62 strategies (as of the date of this publication). Past performance is not an indication of future results. For additional information about Hulbert’s methodology, visit: http://hulbertratings.com/methodology/.

Portfolio Builder
Each month in this column, we highlight 10 stocks with which readers might populate their portfolios: Comerica (CMA), Juniper Networks (JNPR), Lockheed Martin (LMT) and seven others.