Every month, The Prudent Speculator produces a newsletter that includes a market summary, helpful charts and graphs, recent equity market news, economic outlook and specific stock investment strategies focused on value stock investing. This month, in addition to our monthly 10-stock Portfolio Builder feature, we offer our semiannual review of sector and industry weightings for our newsletter portfolios as well as first-half 2023 performance attribution for the Russell indexes. We also include a preview of our current Recommended Stock List and Portfolio Builder section with ten highlighted stocks. Note that the entire list is available to our community of loyal subscribers only.

Editor’s Note: Sector Weightings, Value vs. Growth Sector Attribution and more Economic News
“Investing should be more like watching paint dry or watching grass grow. If you want excitement, take $800 and go to Vegas.” — Paul Samuelson
Noted economist John Kenneth Galbraith once proclaimed, “The only function of economic forecasting is to make astrology look respectable,” while Nobel Prize winning economist Paul Samuelson famously quipped, “The stock market has predicted nine of the last five recessions.” Is it any wonder, then, that famed physicist Neils Bohr argued, “Prediction is very difficult, especially about the future!”
Indeed, the economic stats and the performance of equities this year and last have left many scratching their heads. After all, stocks struggled mightily in 2022, even as relatively few thought an economic contraction was in the cards, given that the probability of recession, per tabulations from Bloomberg, started the year at 15% and did not rise to 50% until August AFTER the U.S. economy had endured two quarters of negative real (inflation-adjusted) GDP growth. Of course, the arbiter of recessions, the National Bureau of Economic Research, did not count the respective -1.6% and -0.6% real GDP growth readings in Q1/Q2 2022 as an official contraction, even though the definition of recession is accepted to be two consecutive quarters of negative growth.
Interestingly, equities bottomed as the fourth quarter began last year, right when Bloomberg’s calculation of the odds of recession moved up to 60%, with the rebound gathering steam this year, despite the supposed experts raising their forecast of an economic contraction in the ensuing 12 months to 65%. No doubt, stocks often climb a Wall of Worry, so we suppose that we should not be unhappy that the Leading Economic Index (LEI) fell by 0.7% in May, with the gauge’s keeper, The Conference Board, proclaiming, “The U.S. LEI has declined in each of the last fourteen months and continues to point to weaker economic activity ahead. Rising interest rates paired with persistent inflation will continue to further dampen economic activity. While we revised our Q2 GDP forecast from negative to slight growth, we project that the U.S. economy will contract over the Q3 2023 to Q1 2024 period. The recession likely will be due to continued tightness in monetary policy and lower government spending.”
Further muddying the waters, The Conference Board’s latest survey of Consumer Confidence saw a big jump to 109.7 in June, up from 102.5 in May to a well-above average reading. Trying to save face, we suppose, The Conference Board argued, “Consumer confidence improved in June to its highest level since January 2022, reflecting improved current conditions and a pop in expectations…Nonetheless, the expectations gauge continued to signal consumers anticipating a recession at some point over the next 6 to 12 months.”
Obviously, time will tell whether the economy eventually contracts, but real GDP growth came in at 3.2% in Q3 2022, 2.6% in Q4 2022 and 2.0% in Q1 2023, while the latest projection from the Atlanta Fed is for 1.9% growth in Q2 2023 and the Federal Reserve is predicting 1.0% growth for 2023. And speaking of the Fed, we respect that there is still great concern about the fight against inflation, despite the core Personal Consumption Expenditure index falling last month, but just one or two more interest rate hikes are now expected.
We will leave the economic fretting to others as we note that most who expect a recession believe it will be mild, while we think nominal GDP will continue to expand. Since corporate profits are measured in nominal (actual) and not real dollars, we are not surprised that the latest estimates from Standard & Poor’s itself for bottom-up operating EPS for the S&P 500 stand at $217.46 this year and $243.91 in 2024, compared to $196.95 in 2022.
With the Fed seemingly near the end of its tightening cycle and valuations for TPS Portfolio (forward P/E ratio of 13 and dividend yield of 2.9%) still very attractive, we retain our long-term optimism, especially as the last nine months affirm Lao Tzu’s assertion, “If you do not change direction, you may end up where you are heading.”
Graphic Detail:
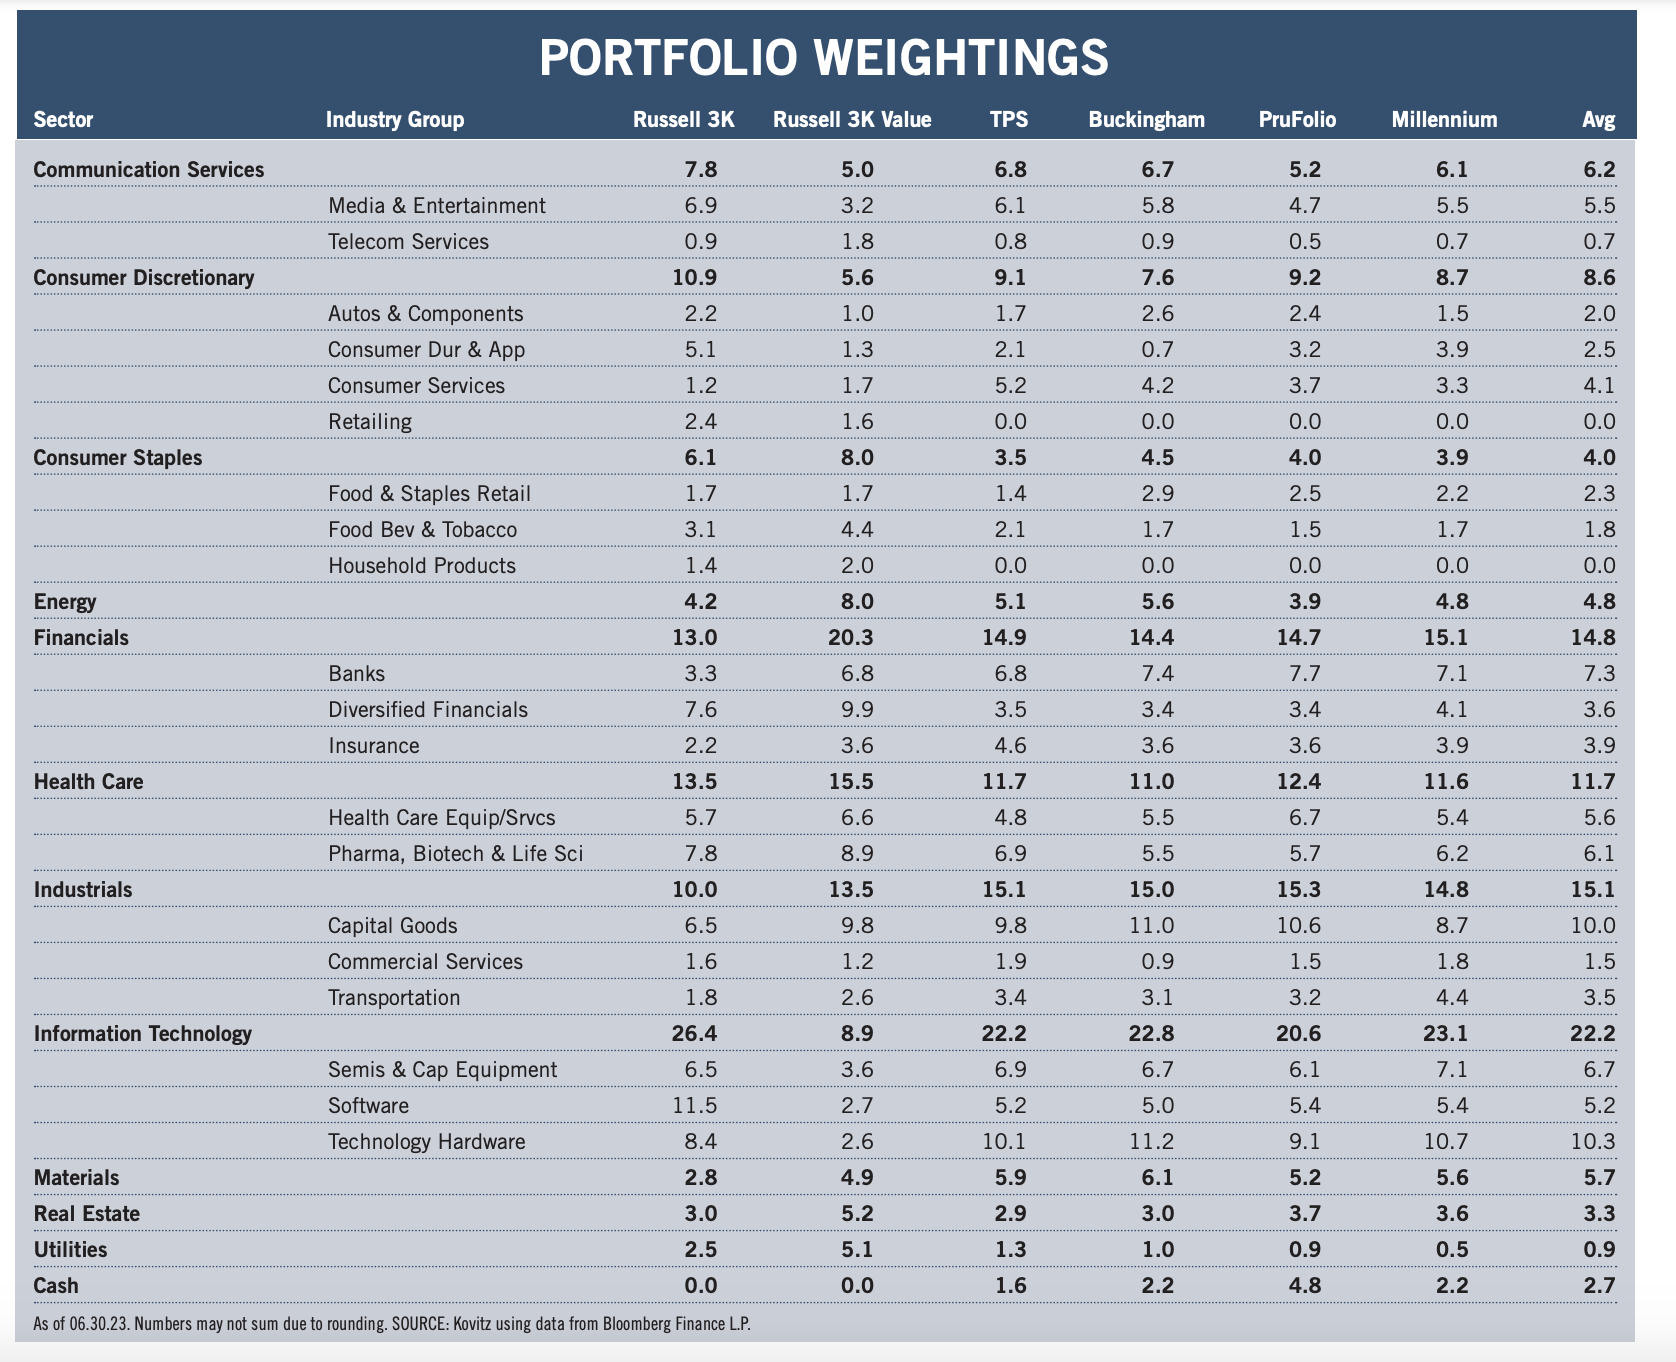
Sector and Industry Group Weightings
Time again to compare the current sector and industry group weightings of our four newsletter portfolios to those of the broad-based Russell 3000 and Russell 3000 Value indexes, noting that our valuation metrics more closely resemble those of Value-oriented gauges. While we very much remain bottom-up stock pickers focused on the merits of individual companies, we also keep an eye on the composition of the indexes in order to ensure that we are comfortable in the over- or under-weighting of a particular sector or industry group. As such, we are able to better focus our subjective reviews on the output of the objective new-idea generation screens that we run every day on areas in which we might desire additional exposure, be it to augment a sector with minimal ownership or to add to a particularly undervalued industry. Illustrative of this process are additions made this year to TPS Portfolio in the Consumer Discretionary, Consumer Staples, Financial, Energy and Real Estate sectors.
There is a great deal of art accompanying the science of portfolio construction and sector and industry group weightings are always used as a guide and not as the gospel. Over time, the gaps have narrowed, but inevitably there will be dispersion across the newsletter portfolios due to the timing of purchases and modest differences in the names held, even as the same desire for broad diversification has always been pervasive.
Value vs. Growth Sector Attribution
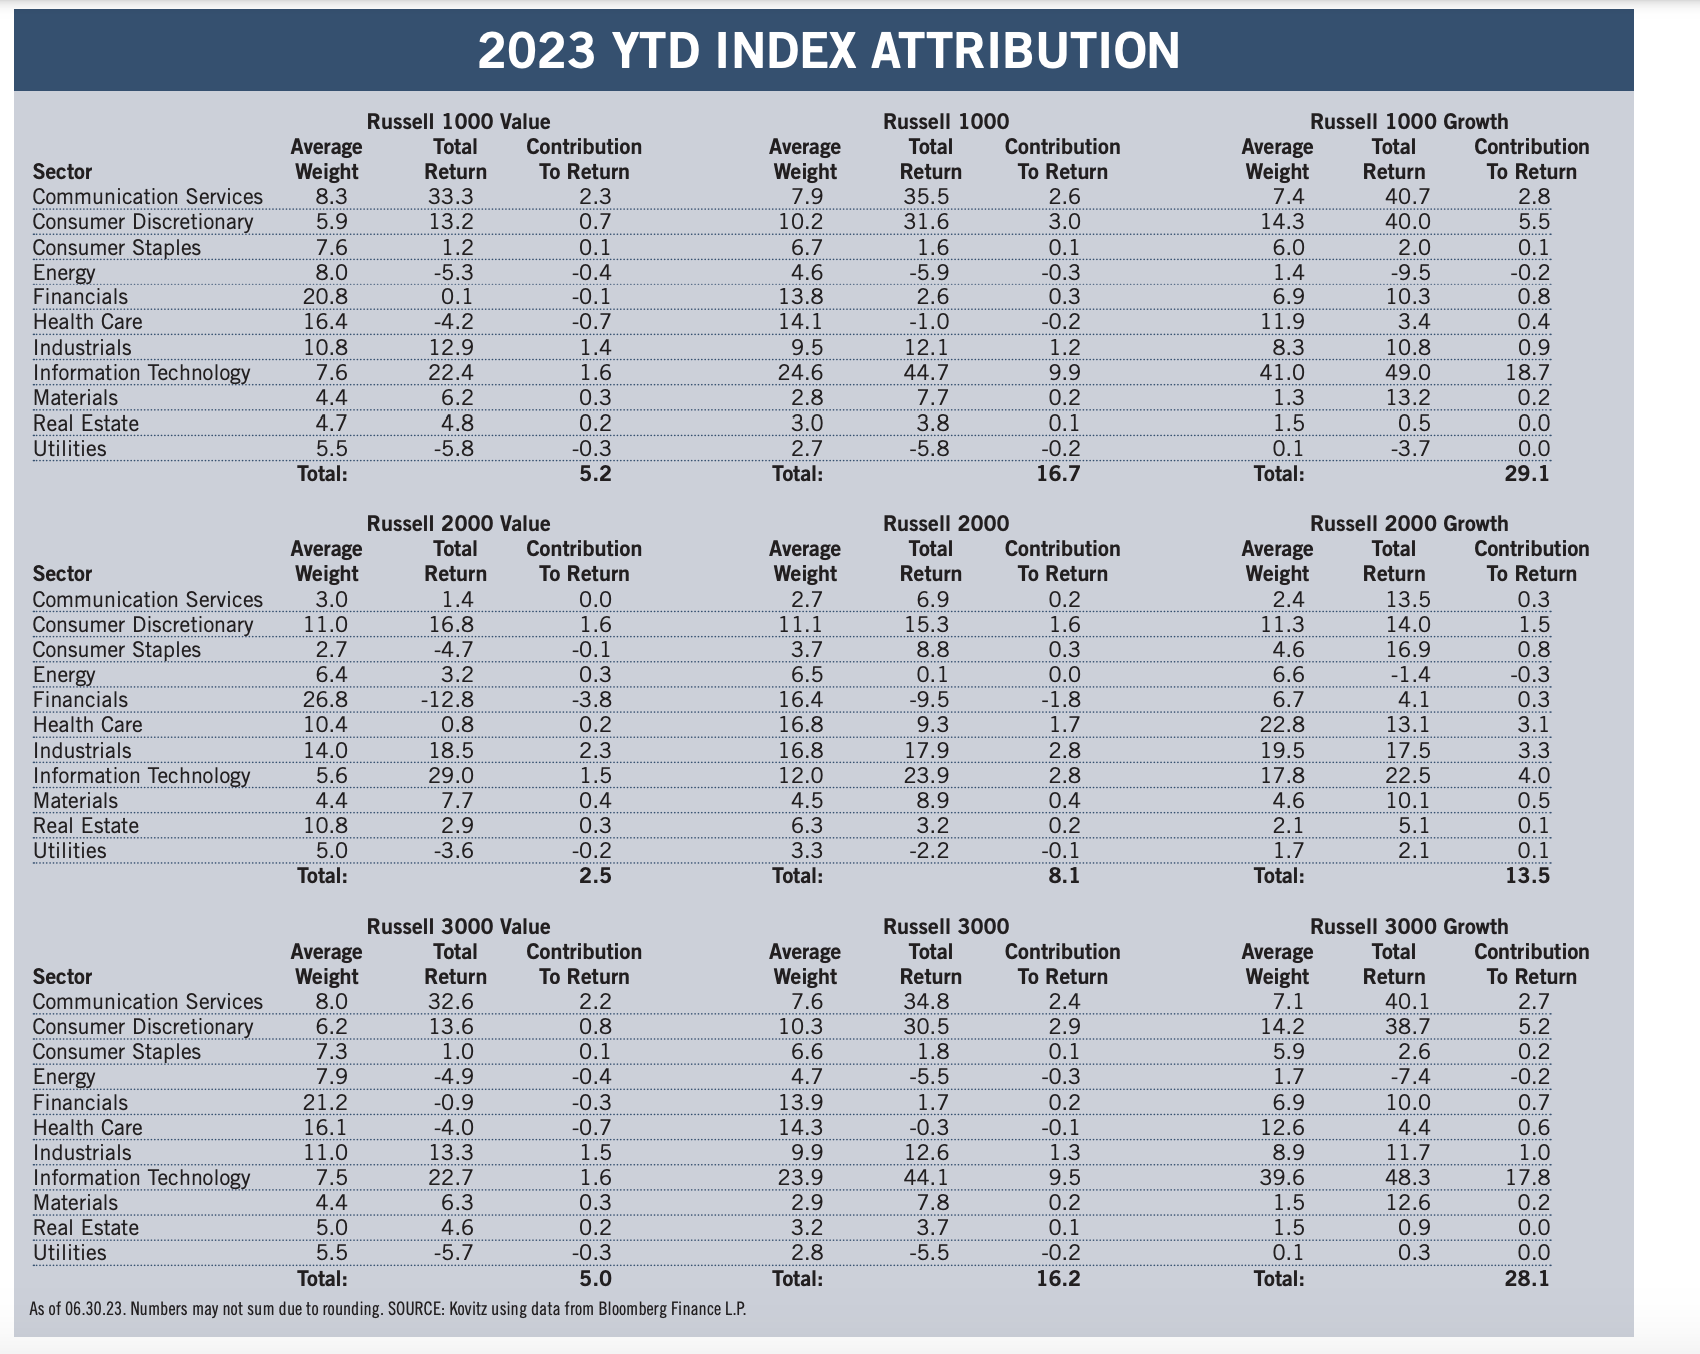
The following two paragraphs hardly do the subject justice, but the simple attribution displayed below helps to better understand which market sectors contributed the most (or least) to index returns. Given our willingness to buy stocks of any market capitalization, we look at the large-cap Russell 1000, the small-cap Russell 2000 and the all-cap Russell 3000 indexes, as well as the Value and Growth versions of each benchmark. We note that our portfolios, with what we believe to be their inexpensive valuations, have long resembled the Value indexes in terms of their financial metrics, even as our sector weightings have more often than not been lighter in Financials and heavier in Information Technology stocks.
While 2022 witnessed a sizable return gap in favor of Value, the first six months of 2023 saw Growth significantly outperform. Returns for the Russell 2000 indexes had the smallest difference, with larger weightings in Health Care and Info Tech, and less exposure to the Financial sector, boosting the Growth index. The larger-cap Russell 1000 and 3000 Growth benchmarks benefitted mightily from a handful of mega-cap Info Tech and Consumer Discretionary stocks, reversing their awful performance last year, while losses in the Energy, Financial, Health Care and Utility sectors held back returns for the Value indexes. The wide dispersion in returns, we think, creates plenty of opportunity going forward in the Value space.
Recommended Stock List
In this space, we list all of the stocks we own across our multi-cap-value managed account strategies and in our four newsletter portfolios. See the last page for pertinent information on our flagship TPS strategy, which has been in existence since the launch of The Prudent Speculator in March 1977.
Readers are likely aware that TPS has long been monitored by The Hulbert Financial Digest (“Hulbert”). As industry watchdog Mark Hulbert states, “Hulbert was founded in 1980 with the goal of tracking investment advisory newsletters. Ever since it has been the premiere source of objective and independent performance ratings for the industry.” For info on the newsletters tracked by Hulbert, visit: http://hulbertratings.com/since-inception/.
Keeping in mind that all stocks are rated as “Buys” until such time as we issue an official Sales Alert, we believe that all of the companies in the tables on these pages trade for significant discounts to our determination of long-term fair value and/or offer favorable risk/reward profiles. Note that, while we always seek substantial capital gains, we require lower appreciation potential for stocks that we deem to have more stable earnings streams, more diversified businesses and stronger balance sheets. The natural corollary is that riskier companies must offer far greater upside to warrant a recommendation. Further, as total return is how performance is ultimately judged, we explicitly factor dividend payments into our analytical work.
While we always like to state that we like all of our children equally, meaning that we would be fine in purchasing any of the 100+ stocks, we remind subscribers that we very much advocate broad portfolio diversification with TPS Portfolio holding more than eighty of these companies. Of course, we respect that some folks may prefer a more concentrated portfolio, however our minimum comfort level in terms of number of overall holdings in a broadly diversified portfolio is at least thirty!
TPS rankings and performance are derived from hypothetical transactions “entered” by Hulbert based on recommendations provided within TPS, and according to Hulbert’s own procedures, irrespective of specific prices shown within TPS, where applicable. Such performance does not reflect the actual experience of any TPS subscriber. Hulbert applies a hypothetical commission to all “transactions” based on an average rate that is charged by the largest discount brokers in the U.S., and which rate is solely determined by Hulbert. Hulbert’s performance calculations do not incorporate the effects of taxes, fees, or other expenses. TPS pays an annual fee to be monitored and ranked by Hulbert. With respect to “since inception” performance, Hulbert has compared TPS to 19 other newsletters across 62 strategies (as of the date of this publication). Past performance is not an indication of future results. For additional information about Hulbert’s methodology, visit: http://hulbertratings.com/methodology/.

Portfolio Builder
Each month in this column, we highlight 10 stocks with which readers might populate their portfolios: Albemarle (ALB), Leggett & Platt (LEG), Exxon Mobil (XOM) and seven others.