Preview of November 2022 Newsletter
Editor’s Note
“What lies in our power to do, lies in our power not to do.” — Aristotle
Maybe all that was needed to turn October into one of the best months in stock market history was for many Wall Street professionals to join Main Street investors on the sidelines! Following near-record levels of Bearishness (fourth- and fifth highest ever) for the 35-year-old American Association of Individual Investors weekly Sentiment Survey as an ugly September came to a close, we learned from Bank of America that fund managers had raised their cash positions in October to the highest level since April 2001.
With B of A calculating that a net 49% of its survey participants were underweight equities last month, we yet again saw why the only problem with market timing is getting the timing right. After all, stocks enjoyed a fantastic October, with the 14.1% total return for the Dow Jones Industrial Average the best monthly advance for that gauge since the Bicentennial. The broader-based benchmarks did not fare as well, as the S&P 500 rebounded only 8.1% last month, but Value again trounced Growth by a score of 10.4% to 6.1% for the Russell 3000 factor-based indexes in October.
To be sure, stocks may move lower in the near term and the major market averages are still deep in the red for the year. However, it would seem that more than a few folks were guilty of buying high and selling low, as there was little in the way of pessimism in the sentiment surveys at the start of the year. And, we are perplexed that the supposed smart money would close the proverbial barn doors after the horses have run out, given that B of A concluded, “The sentiment on stocks and global growth among fund managers surveyed shows full capitulation, opening the way to an equities rally in 2023.”
Indeed, it isn’t like a whole lot improved in October versus September. The war in Ukraine raged on, the yield on the 10-Year U.S. Treasury moved above 4%, the chance of a more hawkish Federal Reserve increased, the odds of recession rose and inflation remained elevated. The media was also quick to trumpet negative views, such as this from Amazon founder Jeff Bezos: “The probabilities in this economy tell you to batten down the hatches.”
What we think the naysayers are missing is that the dismal downturn over the first nine months of the year discounted a tremendous amount of bad news that has yet to materialize. Yes, numbers on the health of the manufacturing and services sectors have deteriorated, housing statistics have headed south and consumer confidence has weakened.
However, the labor market has remained remarkably robust, consumers have continued to spend and Q3 GDP grew at an inflation-adjusted 2.6%. As a result, corporate profits have held up very well, even as outlooks have continued to be subdued and stock prices sometimes have reacted negatively. In fact, with 74% of the S&P 500 having reported Q3 results as of November 2, 70.0% of companies have topped EPS estimates with 56.5% delivering a positive revenue surprise. Analysts are often overly rosy in their projections, but the forecast is for modest overall EPS growth for Q3 when all is said and done, with Standard & Poor’s presently expecting 2023 bottom-up operating EPS for the S&P 500 to rise to $231.78 from $204.31 this year.
No doubt, some will argue that the S&P 500 trading at 16 times the 2023 EPS estimate and yielding 1.8% is not a bargain, but we do not invest in indexes. While we still find the overall market to be reasonably priced, we very much like that TPS Portfolio boasts a forward P/E ratio of 11.3 and a 2.9% dividend yield. More importantly, perhaps, we are happy that investors are again focusing on the price they are paying for stocks today and not just on the top-line growth they may or may not get tomorrow.
Yes, we have to be braced for heightened volatility, especially as traders are fixated on the Federal Reserve, but we continue to think that if the undervalued businesses we own do well their stocks eventually will be rewarded.
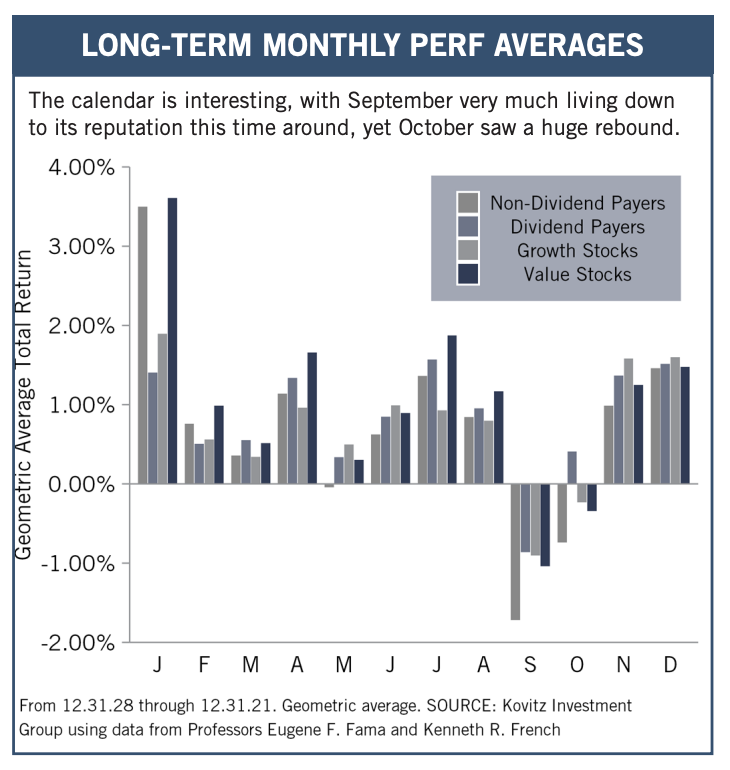
Graphic Detail: Seasonal Favoritism
Ninety-three years of data show September and October to be the two worst months of the year, but this time around, the scary duo provided tricks the first month and treats the second, illustrating yet again why we like to say that time in the market trumps market timing.
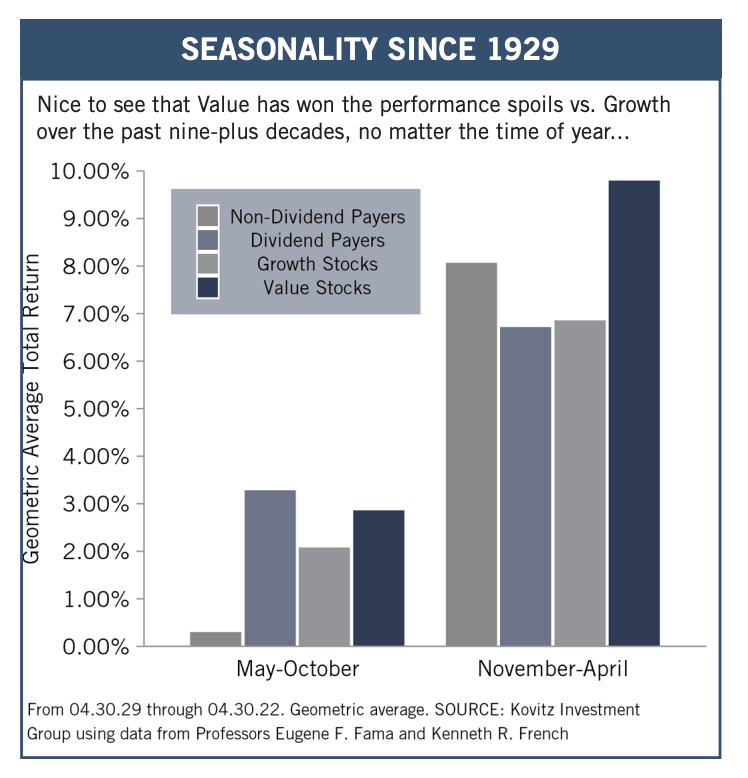
Of course, we confess to having an extra bounce in our step now that the calendar has hit the Thanksgiving month, and the start of the seasonally favorable six months of the year. Indeed, the period between Halloween and May Day has seen terrific performance, on average, since 1990 and going all the way back to 1929. And Value Stocks historically have asserted their dominance during this span, even as Non-Dividend Payers have beaten Dividend Payers. Alas, with the war in Ukraine, a slowing economy, elevated inflation and a hawkish Federal Reserve largely to blame, the latest November through April total return span was lousy, with the S&P 500 skidding 9.66% and the Russell 3000 Value index dipping 4.32%.
Because the other six months have not performed as well, some might argue to “Sell in May and Go Away,” but the less-favorable period also has been positive on average, though the one just completed saw the Russell 3000 Value index drop 3.10% from April 30 to October 31. We also note that while trading commissions generally are now zero, gains generated from short-term trading strategies would be taxed at the higher ordinary income rate, so we think it far better to focus on the long-term prospects of our stocks, rather than the calendar. Still, we don’t mind that the November-to-January period historically has been the most wonderful time of the year!
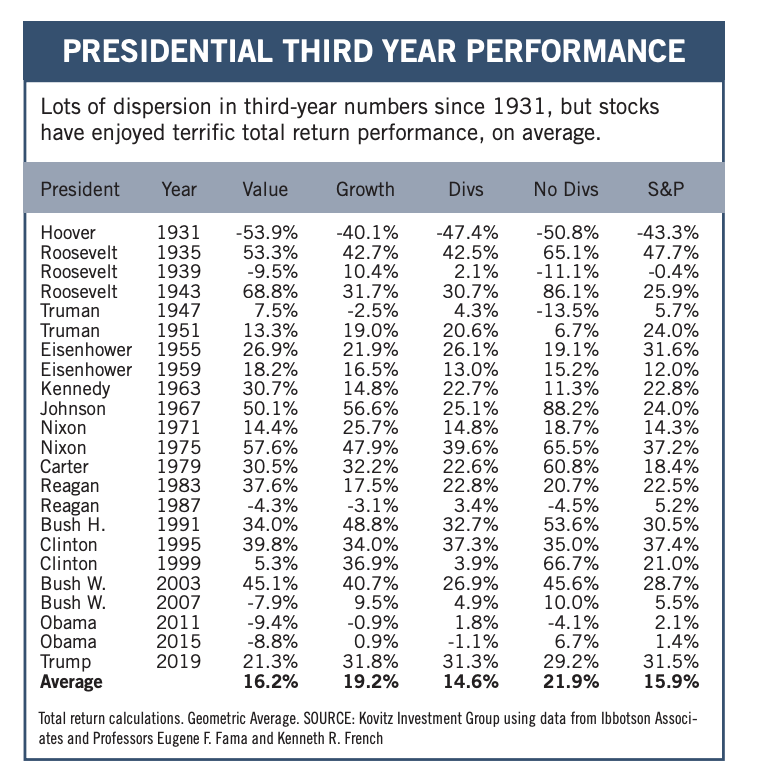
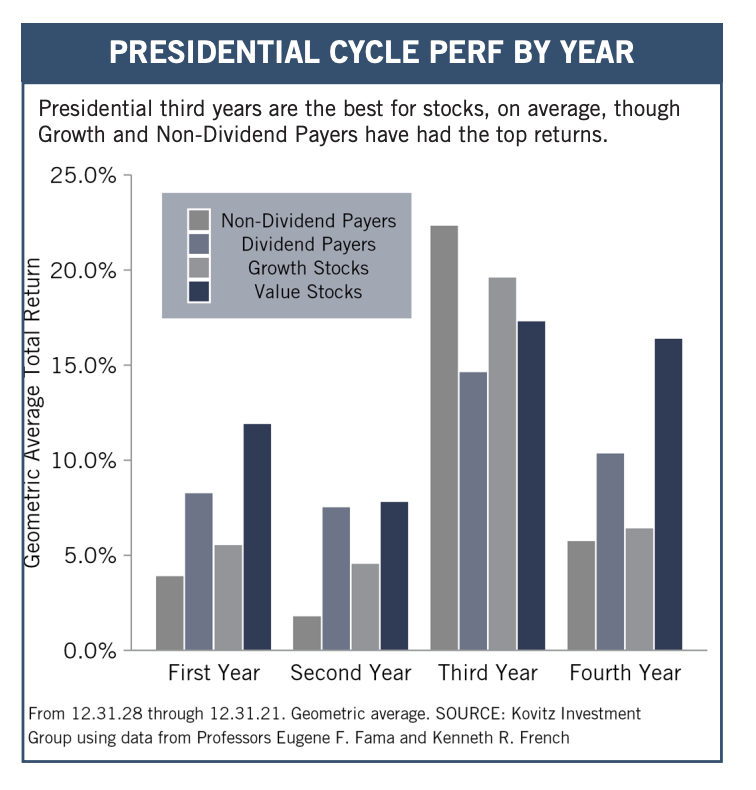
Graphic Detail: Presidential Cycle
We must always be careful about drawing significant conclusions from a small number of data points, but it is interesting to look at equity market returns in each of the four calendar years of the Presidential Cycle. Given that the Commander in Chief often makes tough choices early on, while doing everything possible to spur the economy late in the four years to ensure personal or party re-election, we suppose that it should not be a big surprise that equities in general have not performed as well on average in the first couple of years of the presidency and much better on average over the last two years.
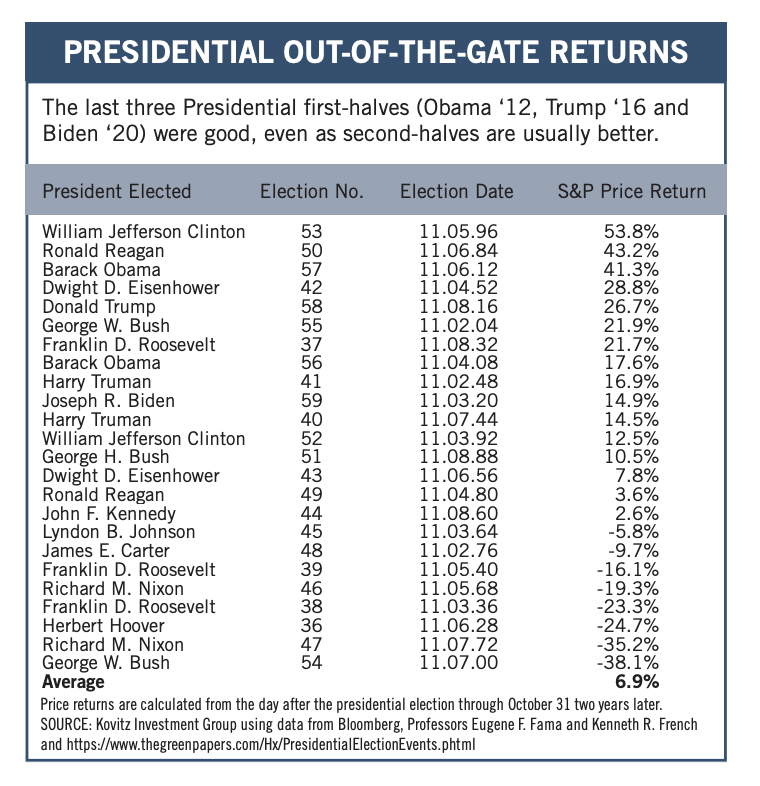
To be sure, the last two presidencies have been anything but ordinary, yet the solid 14.9% price appreciation for the S&P 500 since Election Day 2020 and the 26.7% gain over the first two years after Election Day 2016 were not bad, especially as those returns do not include dividends and so many supposed market experts were predicting that a Biden victory two years ago and a Trump victory six years ago would lead to big losses in the equity markets. We’ll see what 2023 brings, but nine decades of history show that the S&P has managed a superb geometric average annual total return of 15.9% in the third calendar year of the Presidential Cycle, with 1931 and 1939 the only two years in the red, while Value Stocks and Dividend Payers have had excellent returns, on average.
We recognize that past performance is no guarantee of future performance or even profitability, and we note that despite the long-term numbers in the bottom chart below, 2022 has not been grand thus far for most stocks. Indeed, history is merely a guide and never the gospel!
Recommended Stock List
In this space, we list all of the stocks we own across our multi-cap-value managed account strategies and in our four newsletter portfolios. See the last page for pertinent information on our flagship TPS strategy, which has been in existence since the launch of The Prudent Speculator in March 1977.
Readers are likely aware that TPS has long been monitored by The Hulbert Financial Digest (“Hulbert”). As industry watchdog Mark Hulbert states, “Hulbert was founded in 1980 with the goal of tracking investment advisory newsletters. Ever since it has been the premiere source of objective and independent performance ratings for the industry.” For info on the newsletters tracked by Hulbert, visit: http://hulbertratings.com/since-inception/
Keeping in mind that all stocks are rated as “Buys” until such time as we issue an official Sales Alert, we believe that all of the companies in the tables on these pages trade for significant discounts to our determination of longterm fair value and/or offer favorable risk/reward profiles. Note that, while we always seek substantial capital gains, we require lower appreciation potential for stocks that we deem to have more stable earnings streams, more diversified businesses and stronger balance sheets. The natural corollary is that riskier companies must offer far greater upside to warrant a recommendation. Further, as total return is how performance is ultimately judged, we explicitly factor dividend payments into our analytical work.
While we always like to state that we like all of our children equally, meaning that we would be fine in purchasing any of the 100+ stocks, we remind subscribers that we very much advocate broad portfolio diversification with TPS Portfolio holding more than eighty of these companies. Of course, we respect that some folks may prefer a more concentrated portfolio, however our minimum comfort level in terms of number of overall holdings in a broadly diversified portfolio is at least thirty!
TPS rankings and performance are derived from hypothetical transactions “entered” by Hulbert based on recommendations provided within TPS, and according to Hulbert’s own procedures, irrespective of specific prices shown within TPS, where applicable. Such performance does not reflect the actual experience of any TPS subscriber. Hulbert applies a hypothetical commission to all “transactions” based on an average rate that is charged by the largest discount brokers in the U.S., and which rate is solely determined by Hulbert. Hulbert’s performance calculations do not incorporate the effects of taxes, fees, or other expenses. TPS pays an annual fee to be monitored and ranked by Hulbert. With respect to “since inception” performance, Hulbert has compared TPS to 19 other newsletters across 62 strategies (as of the date of this publication). Past performance is not an indication of future results. For additional information about Hulbert’s methodology, visit: http://hulbertratings.com/methodology/.

Portfolio Builder
Each month in this column, we highlight 10 stocks with which readers might populate their portfolios: Digital Realty (DLR), Gilead Sciences (GILD), Microsoft (MSFT) and seven others.