Our 12 Stock Picks for the Festive Season Special Report is available in Adobe pdf format by clicking here.
EVERYONE TELLING YOU BE OF GOOD CHEER
No, it’s not the parties for hosting or the marshmallows for toasting or caroling out in the snow. With apologies to Andy Williams, it’s the most wonderful time of the year when the calendar rolls past Halloween, heralding the start of the seasonally favorable six-month period for stocks.
While we have long thought that the only problem with market timing is getting the timing right, and we are always focused on the long-term prospects of our stocks, we do not mind that November to April is the period in which the equity markets typically perform well.
There is no assurance that the six months will produce stellar gains, and we need go back only one year to see red ink. Alas, with the war in Ukraine, a slowing economy, elevated inflation and a hawkish Federal Reserve, the most recent November through April total return span was lousy as the S&P 500 skidded 9.66% and the Russell 3000 Value index dipped 4.32%.
However, over the last three decades, as shown in Figure 1, the Halloween-to-May-Day returns for the Russell 3000 Value index have been negative only six times. Happily, the Value stock benchmark had outpaced the S&P 500 and Russell 3000 Growth indexes in the average performance derby, including by a wide margin in the most recent race.
SCARY GHOST STORIES – SEPTEMBER AND OCTOBER
We know that many are fond of the Mark Twain saying, “October: This is one of the peculiarly dangerous months to speculate in stocks. The others are July, January, September, April, November, May, March, June, December, August and February.” Of course, based on historical data, September and October have been the two worst months of the year (see Figure 2).
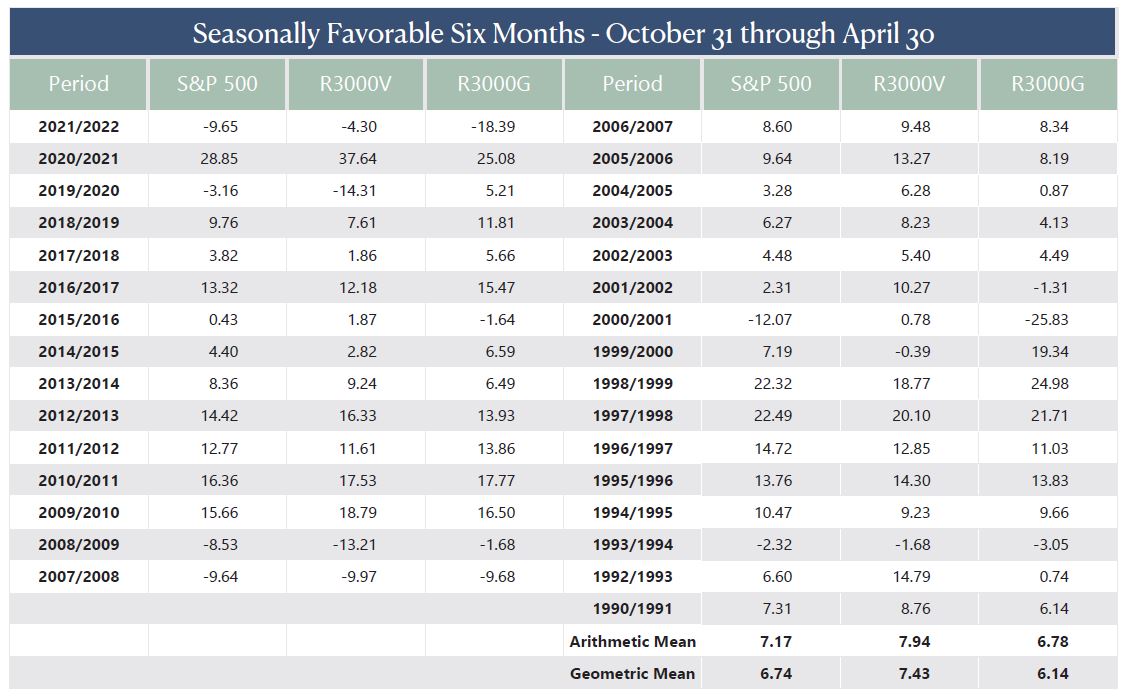
- Figure 1: Halloween to May Day is a Favorable Time for Stocks – SOURCE: Kovitz using data from Bloomberg Finance L.P
The latest time around, the scary duo provided tricks the first month and treats the second. September certainly lived down to its lousy track record in 2022, as the S&P 500 index tumbled 9.22% on a total-return basis, while the Russell 3000 Value index dropped 8.86%. No doubt, Fed Chair Jerome H. Powell stating in August, “I wish there was a painless way to get [inflation] behind us. There isn’t,” provided a stiff headwind that month.
Illustrating why we believe that time in the market trumps market timing, October turned out to be one of the best months in years, with the Russell 3000 Value index completing recouping September’s plunge with a rebound of 10.39%, and the S&P 500 bouncing back by 8.10%. Incredibly, the price-weighted Dow Jones Industrial Average skyrocketed by more than 14% in October, the largest monthly gain since the Bicentennial.
All that seemingly was needed to turn things around was for many Wall Street professionals to join Main Street investors on the sidelines! Following near-record levels of Bearishness (fourth- and fifth-highest ever) for the 35-year-old American Association of Individual Investors weekly Sentiment Survey as September came to a close, we learned from Bank of America that fund managers had raised their cash positions in October to the highest level since April 2001. ‘Twas ever thus, as our founder Al Frank liked to say, given that history is filled with numerous periods where traders have zigged when they should have zagged.
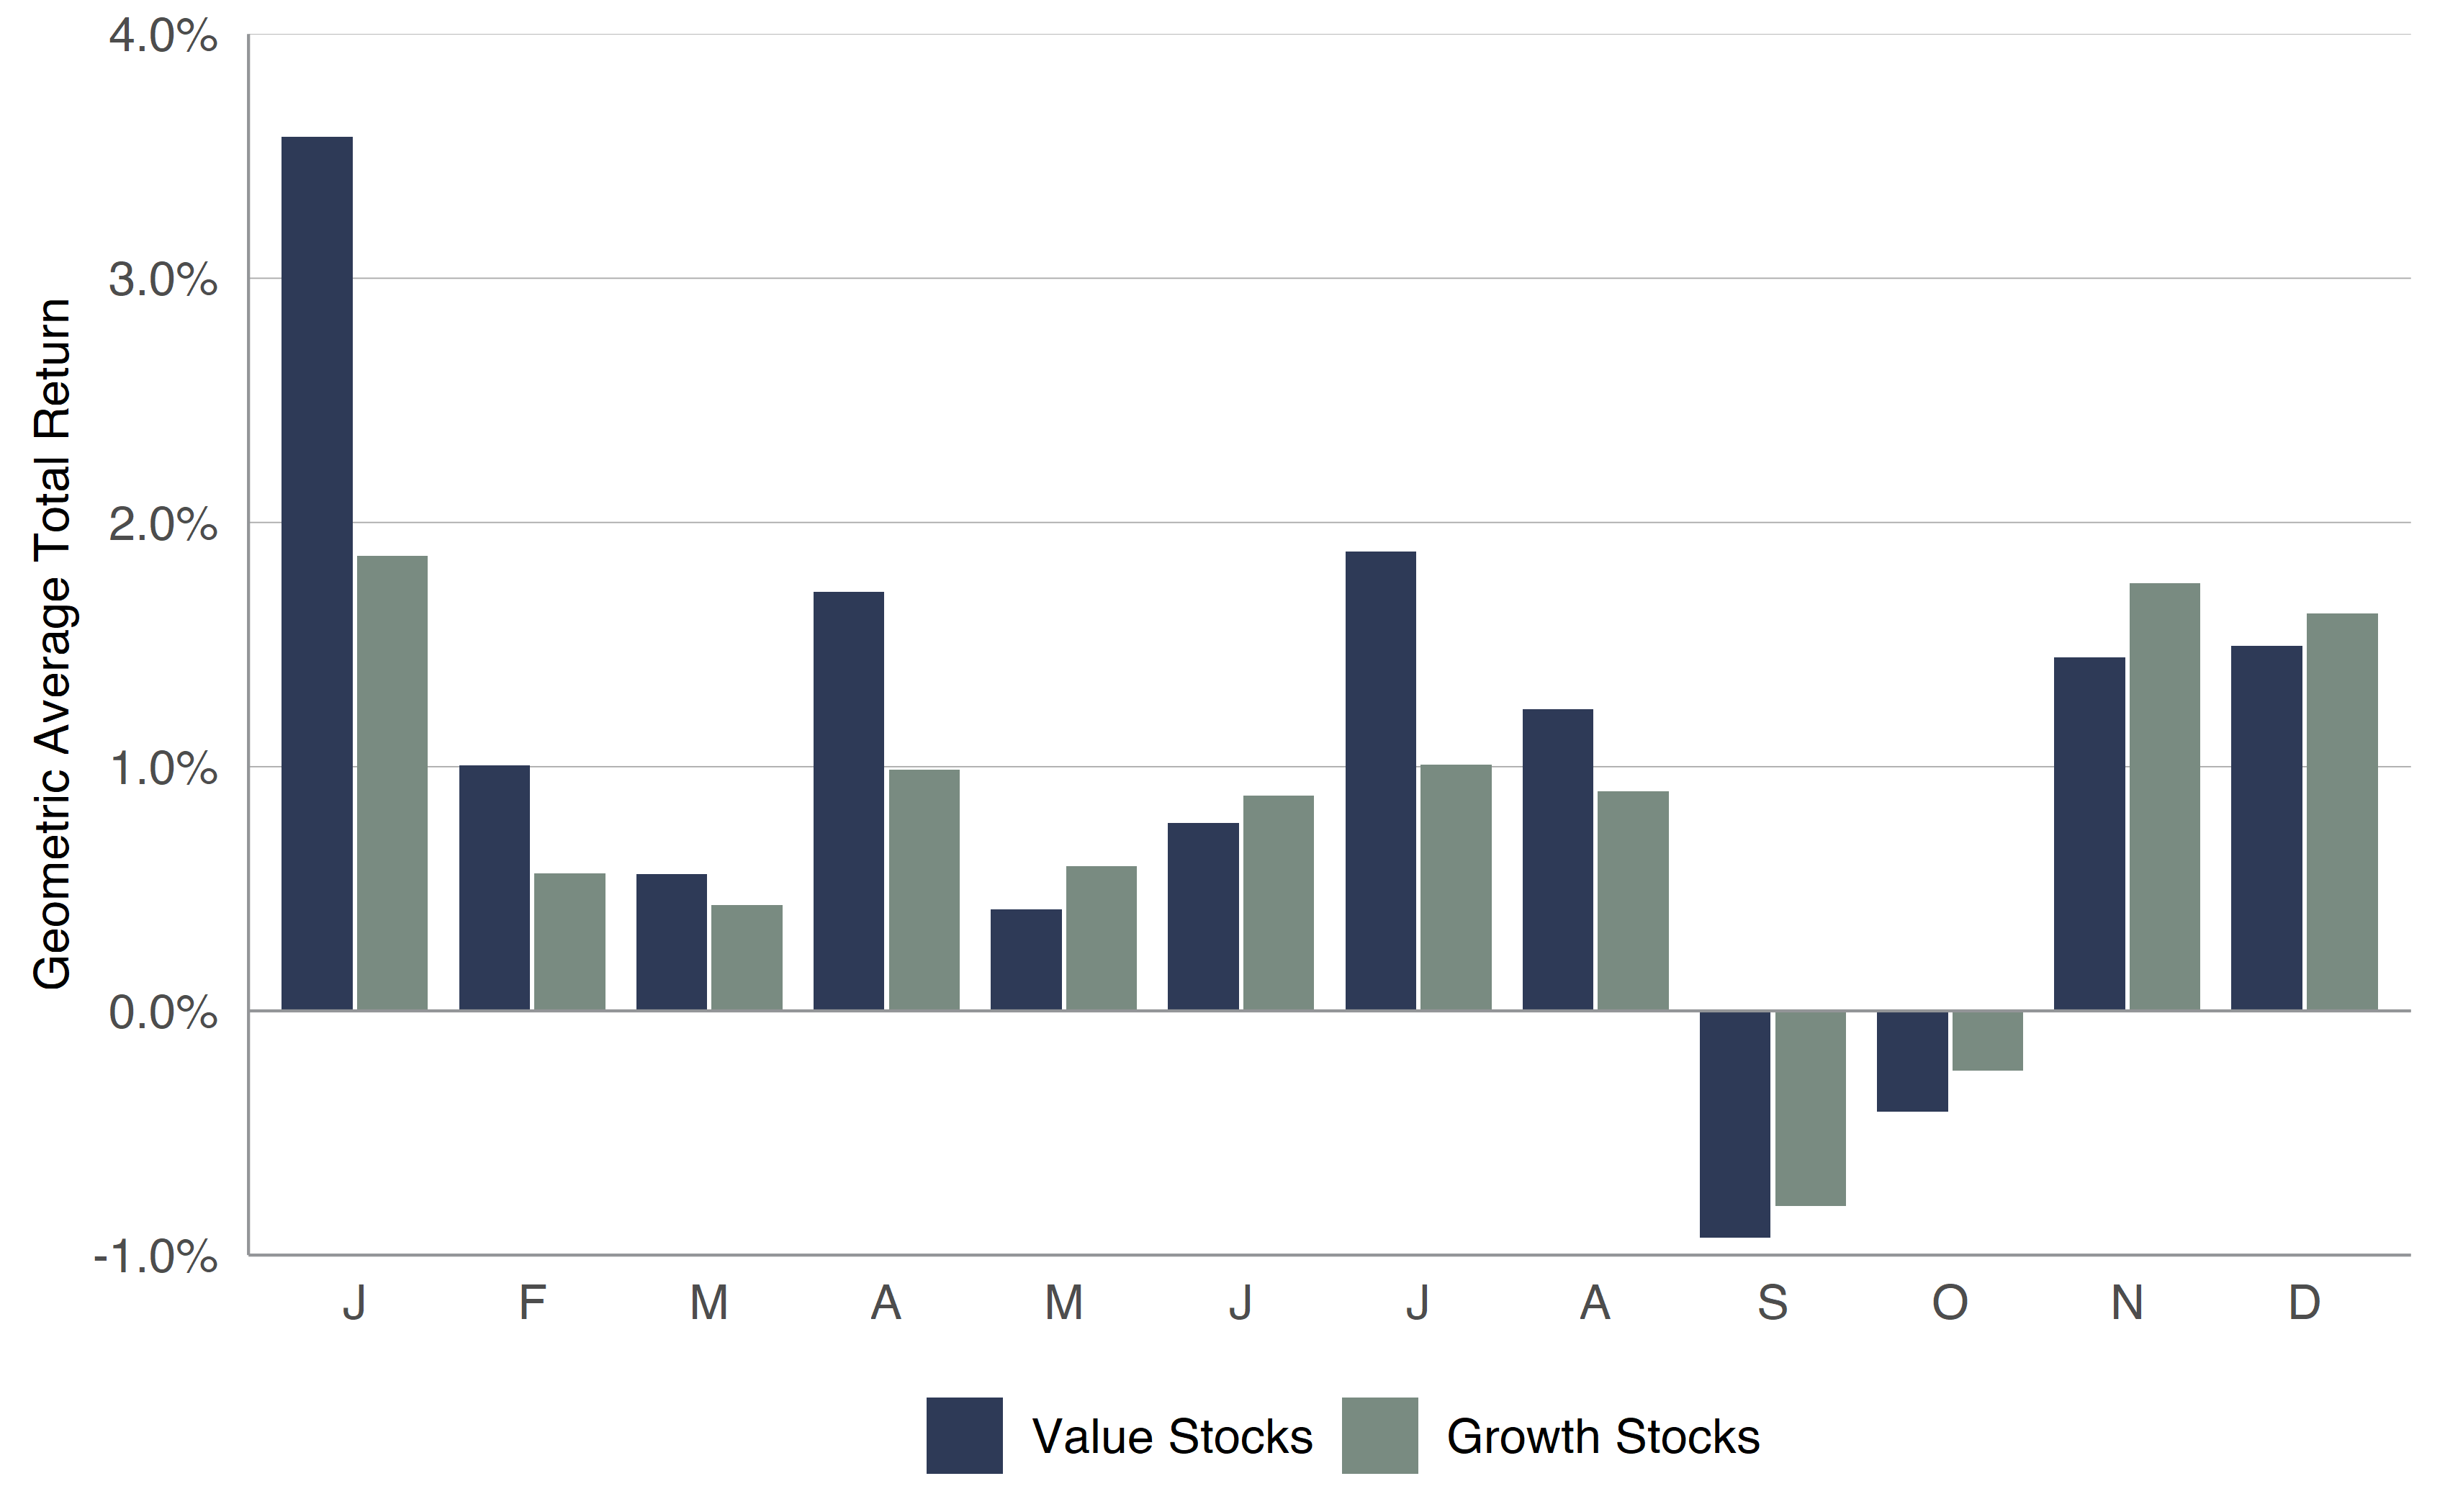
- Figure 2: Long-Term Monthly Performance – SOURCE: Kovitz using data from Bloomberg Finance L.P
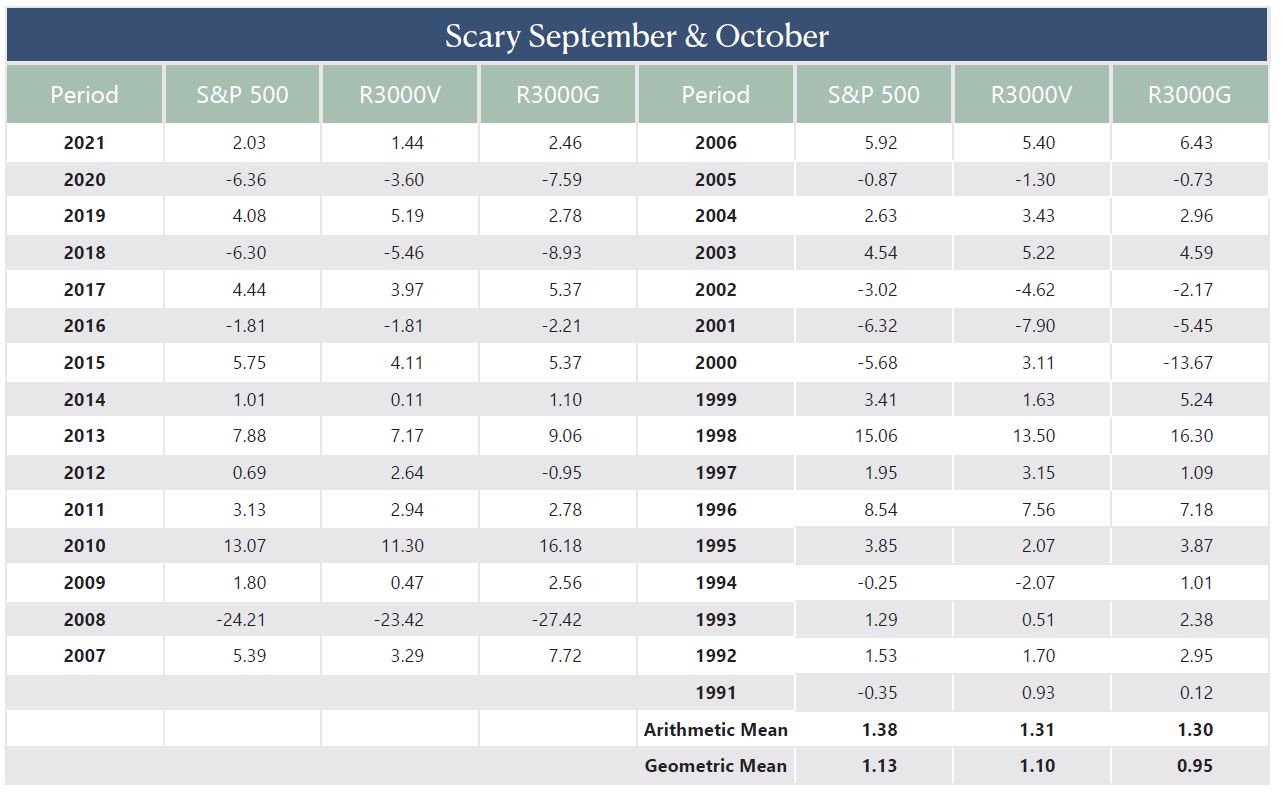
- Figure 3: September and October are Not Always Frightening – SOURCE: Kovitz using data from Bloomberg Finance L.P
Interestingly, as shown in Figure 3, the seasonally scary two months have witnessed positive geometric and arithmetic average returns since 1990, with the Russell 3000 Value index again beating the Russell 3000 Growth index. Of course, there is plenty of dispersion in the two-month returns with 1998 seeing a terrific rally and 2008 enduring a terrible sell-off. Still, the weight of the evidence suggests that Mr. Twain’s warning might be hazardous to one’s wealth.
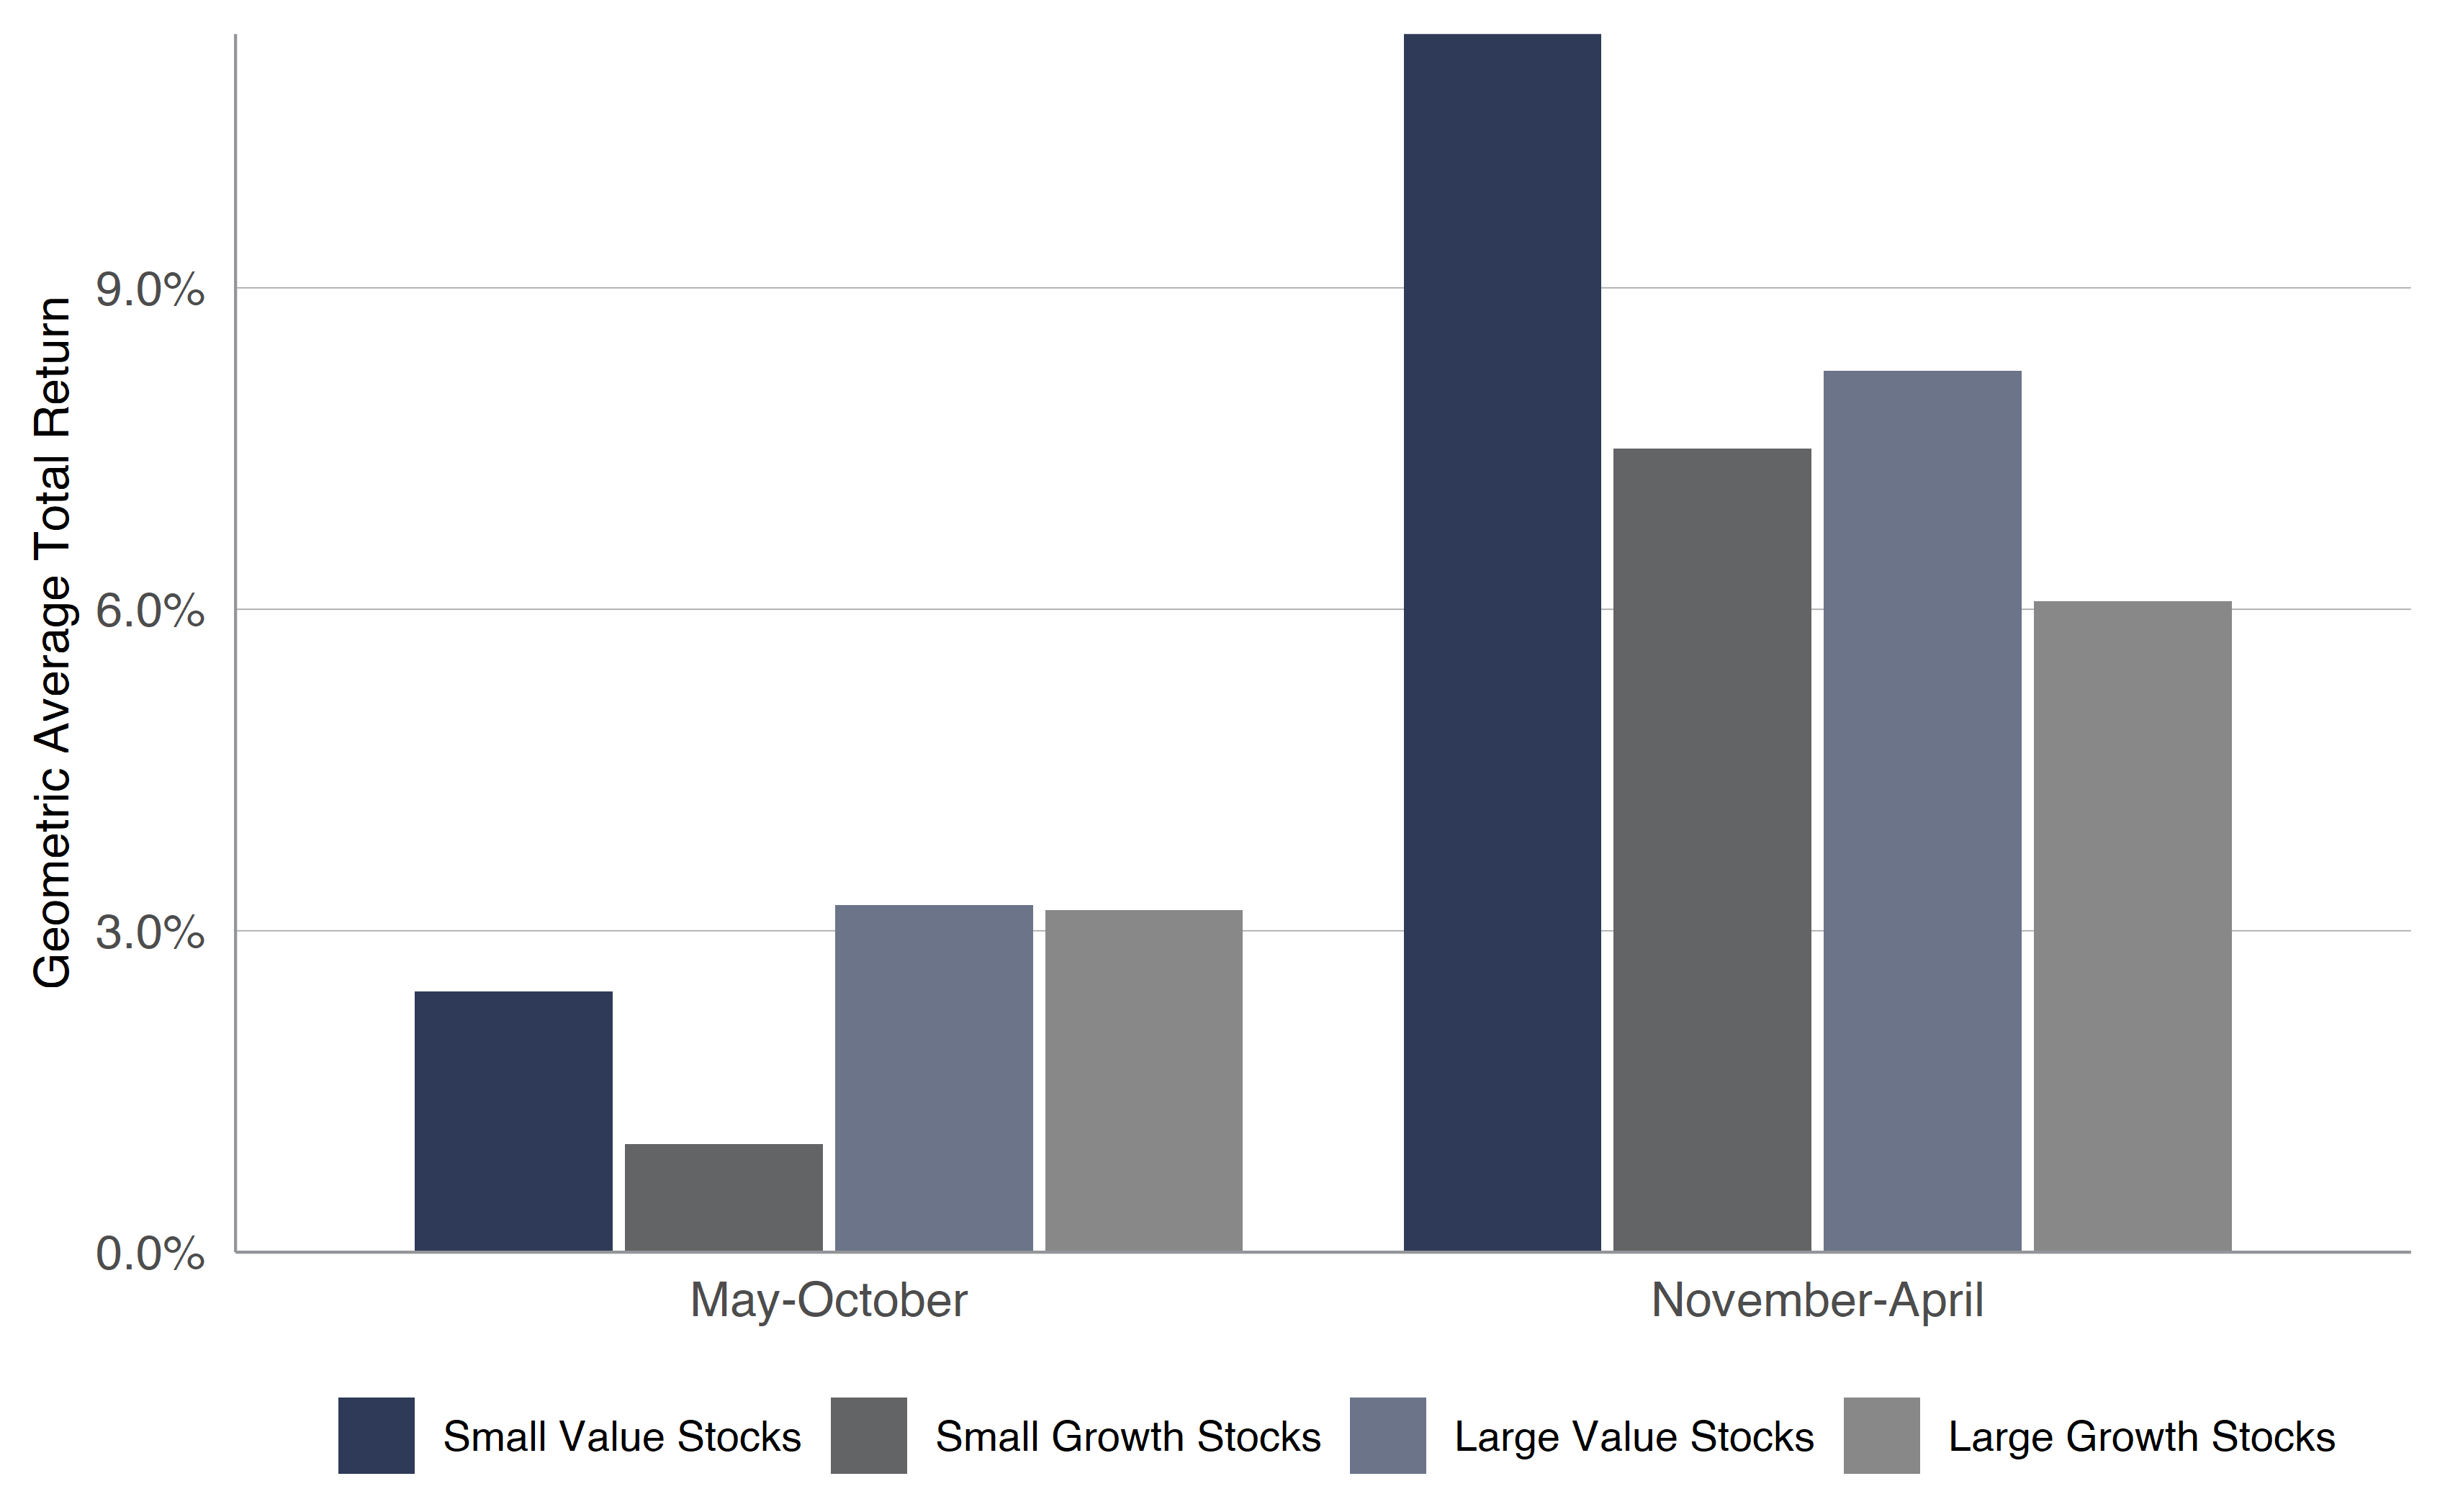
- Figure 4: Value Stocks – SOURCE: Kovitz using data from Bloomberg Finance L.P
- Figure: 5 Dividend Payers – SOURCE: Kovitz using data from Bloomberg Finance L.P
MARKET HISTORIES LONG LONG AGO – VALUE AND DIVIDEND PAYERS
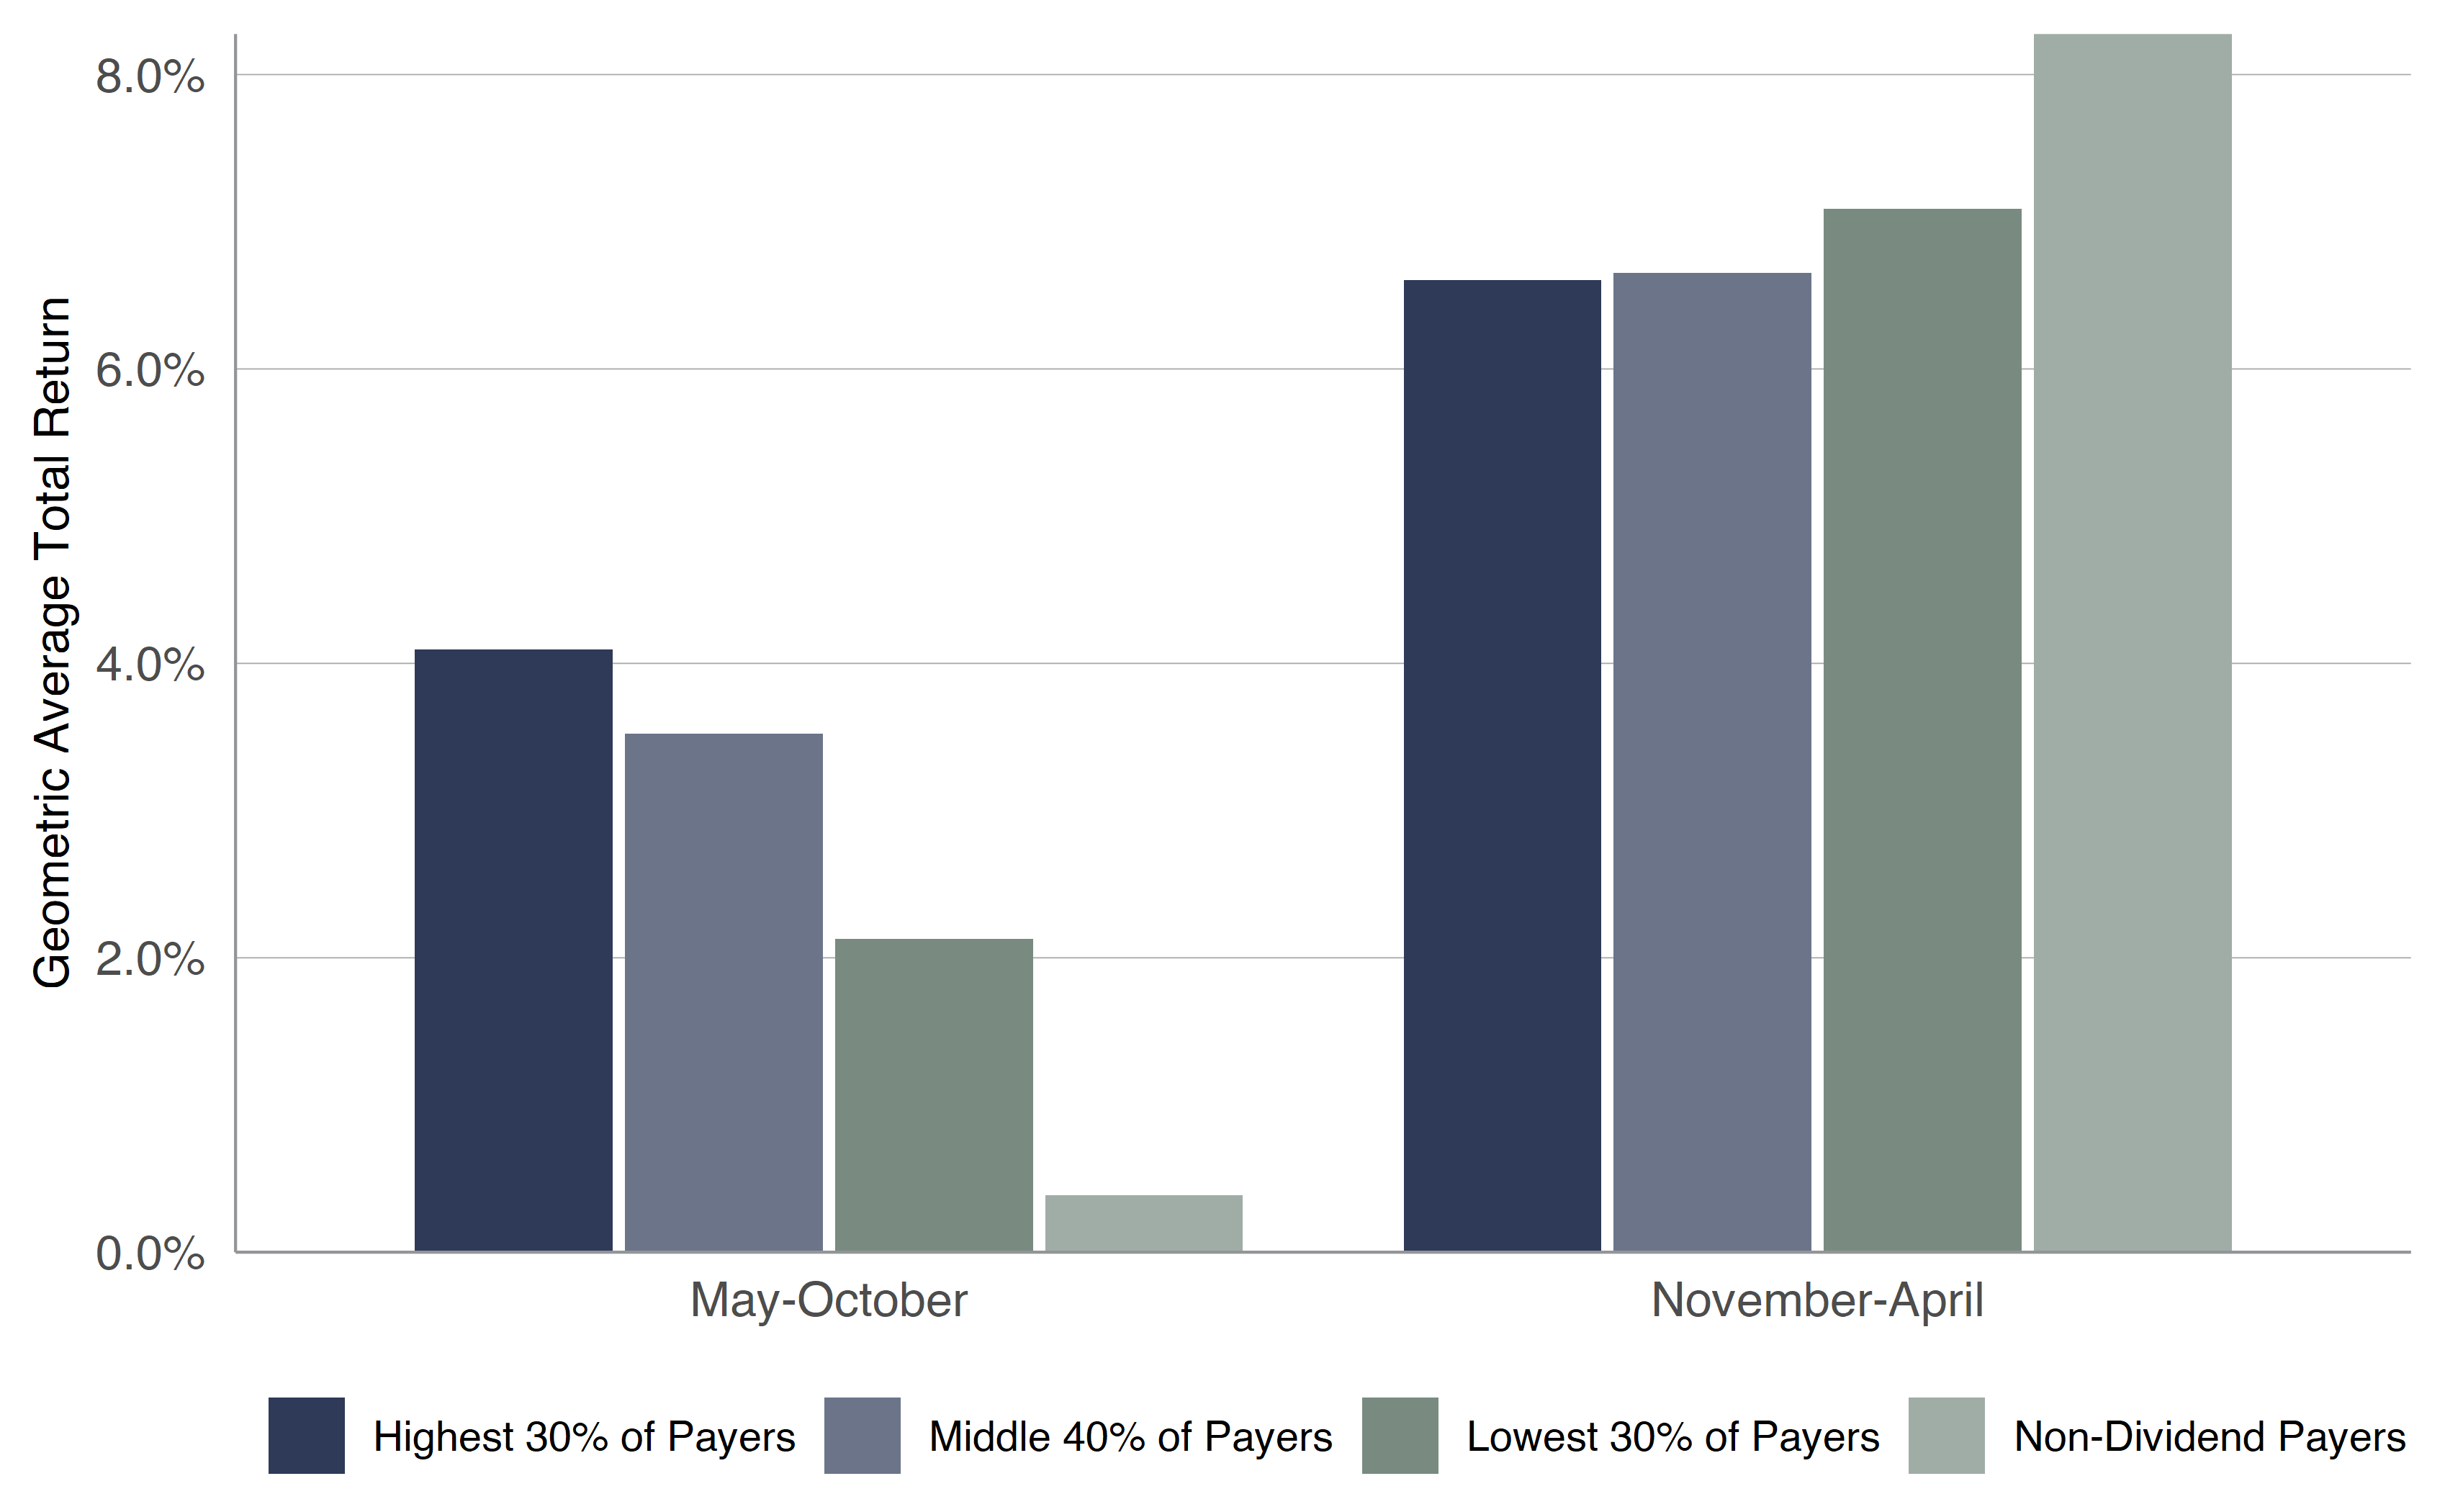
Certainly, 31 years is a long time, but looking back over more than nine decades, Figures 4 and 5 contrast the historical returns between Value stocks and Growth stocks, as well as between Dividend Payers and Non-Dividend Payers for the May-October and November-April periods. The data displayed are monthly portfolio returns as calculated by Professors Eugene F. Fama and Kenneth R. French, but the story remains the same. Equities of all shapes and sizes have performed best from November through April, with the most wonderful returns, on average, favoring Value no matter the time of year and Dividend Payers enjoying a much more consistent ride.
Not surprisingly, because the other six months have not performed as well, some might argue to “Sell in May and Go Away,” but the less-favorable period also has been positive on average, though the one just completed saw the Russell 3000 Value index drop 3.10% from April 30 to October 31.
While data on stocks and the calendar presented above hopefully offers some comfort, we constantly endeavor to provide historical evidence and analysis to keep folks on the path to achieving their long-term investment objectives. We realize that it is hard to stay disciplined as the siren songs of the doom-and-gloom purveyors are not easy to resist, with many making seemingly sound arguments.
No doubt, downturns are part of the investment process as 5% pullbacks happen three times a year, on average, 10% corrections occur every 11 months, on average, and 20% Bear Markets take place every 3.4 years, including this one.
However, despite what investors have endured this year, whether the worry is prior periods of rising interest rates, higher inflation rates, Fed Tightening or the lead up to/the aftermath of recessions, equities have performed well, on average, with Value usually leading the way. And every scary event throughout history has been overcome in the fullness of time.
THERE WILL BE PARTIES FOR HOSTING
Believe it or not, the annals offer additional good news these days courtesy of Washington DC. We must always be careful about drawing significant conclusions from a small number of data points, but it is intriguing to look at equity market returns in each of the four calendar years of the Presidential Cycle, as displayed in Figure 6. Given that the Commander in Chief often makes tough choices early on, while doing everything possible to spur the economy late in the four years to ensure personal or party re-election, we suppose that it should not be a big surprise that equities in general have not performed as well on average in the first couple of years of the presidency and much better on average over the last two years.
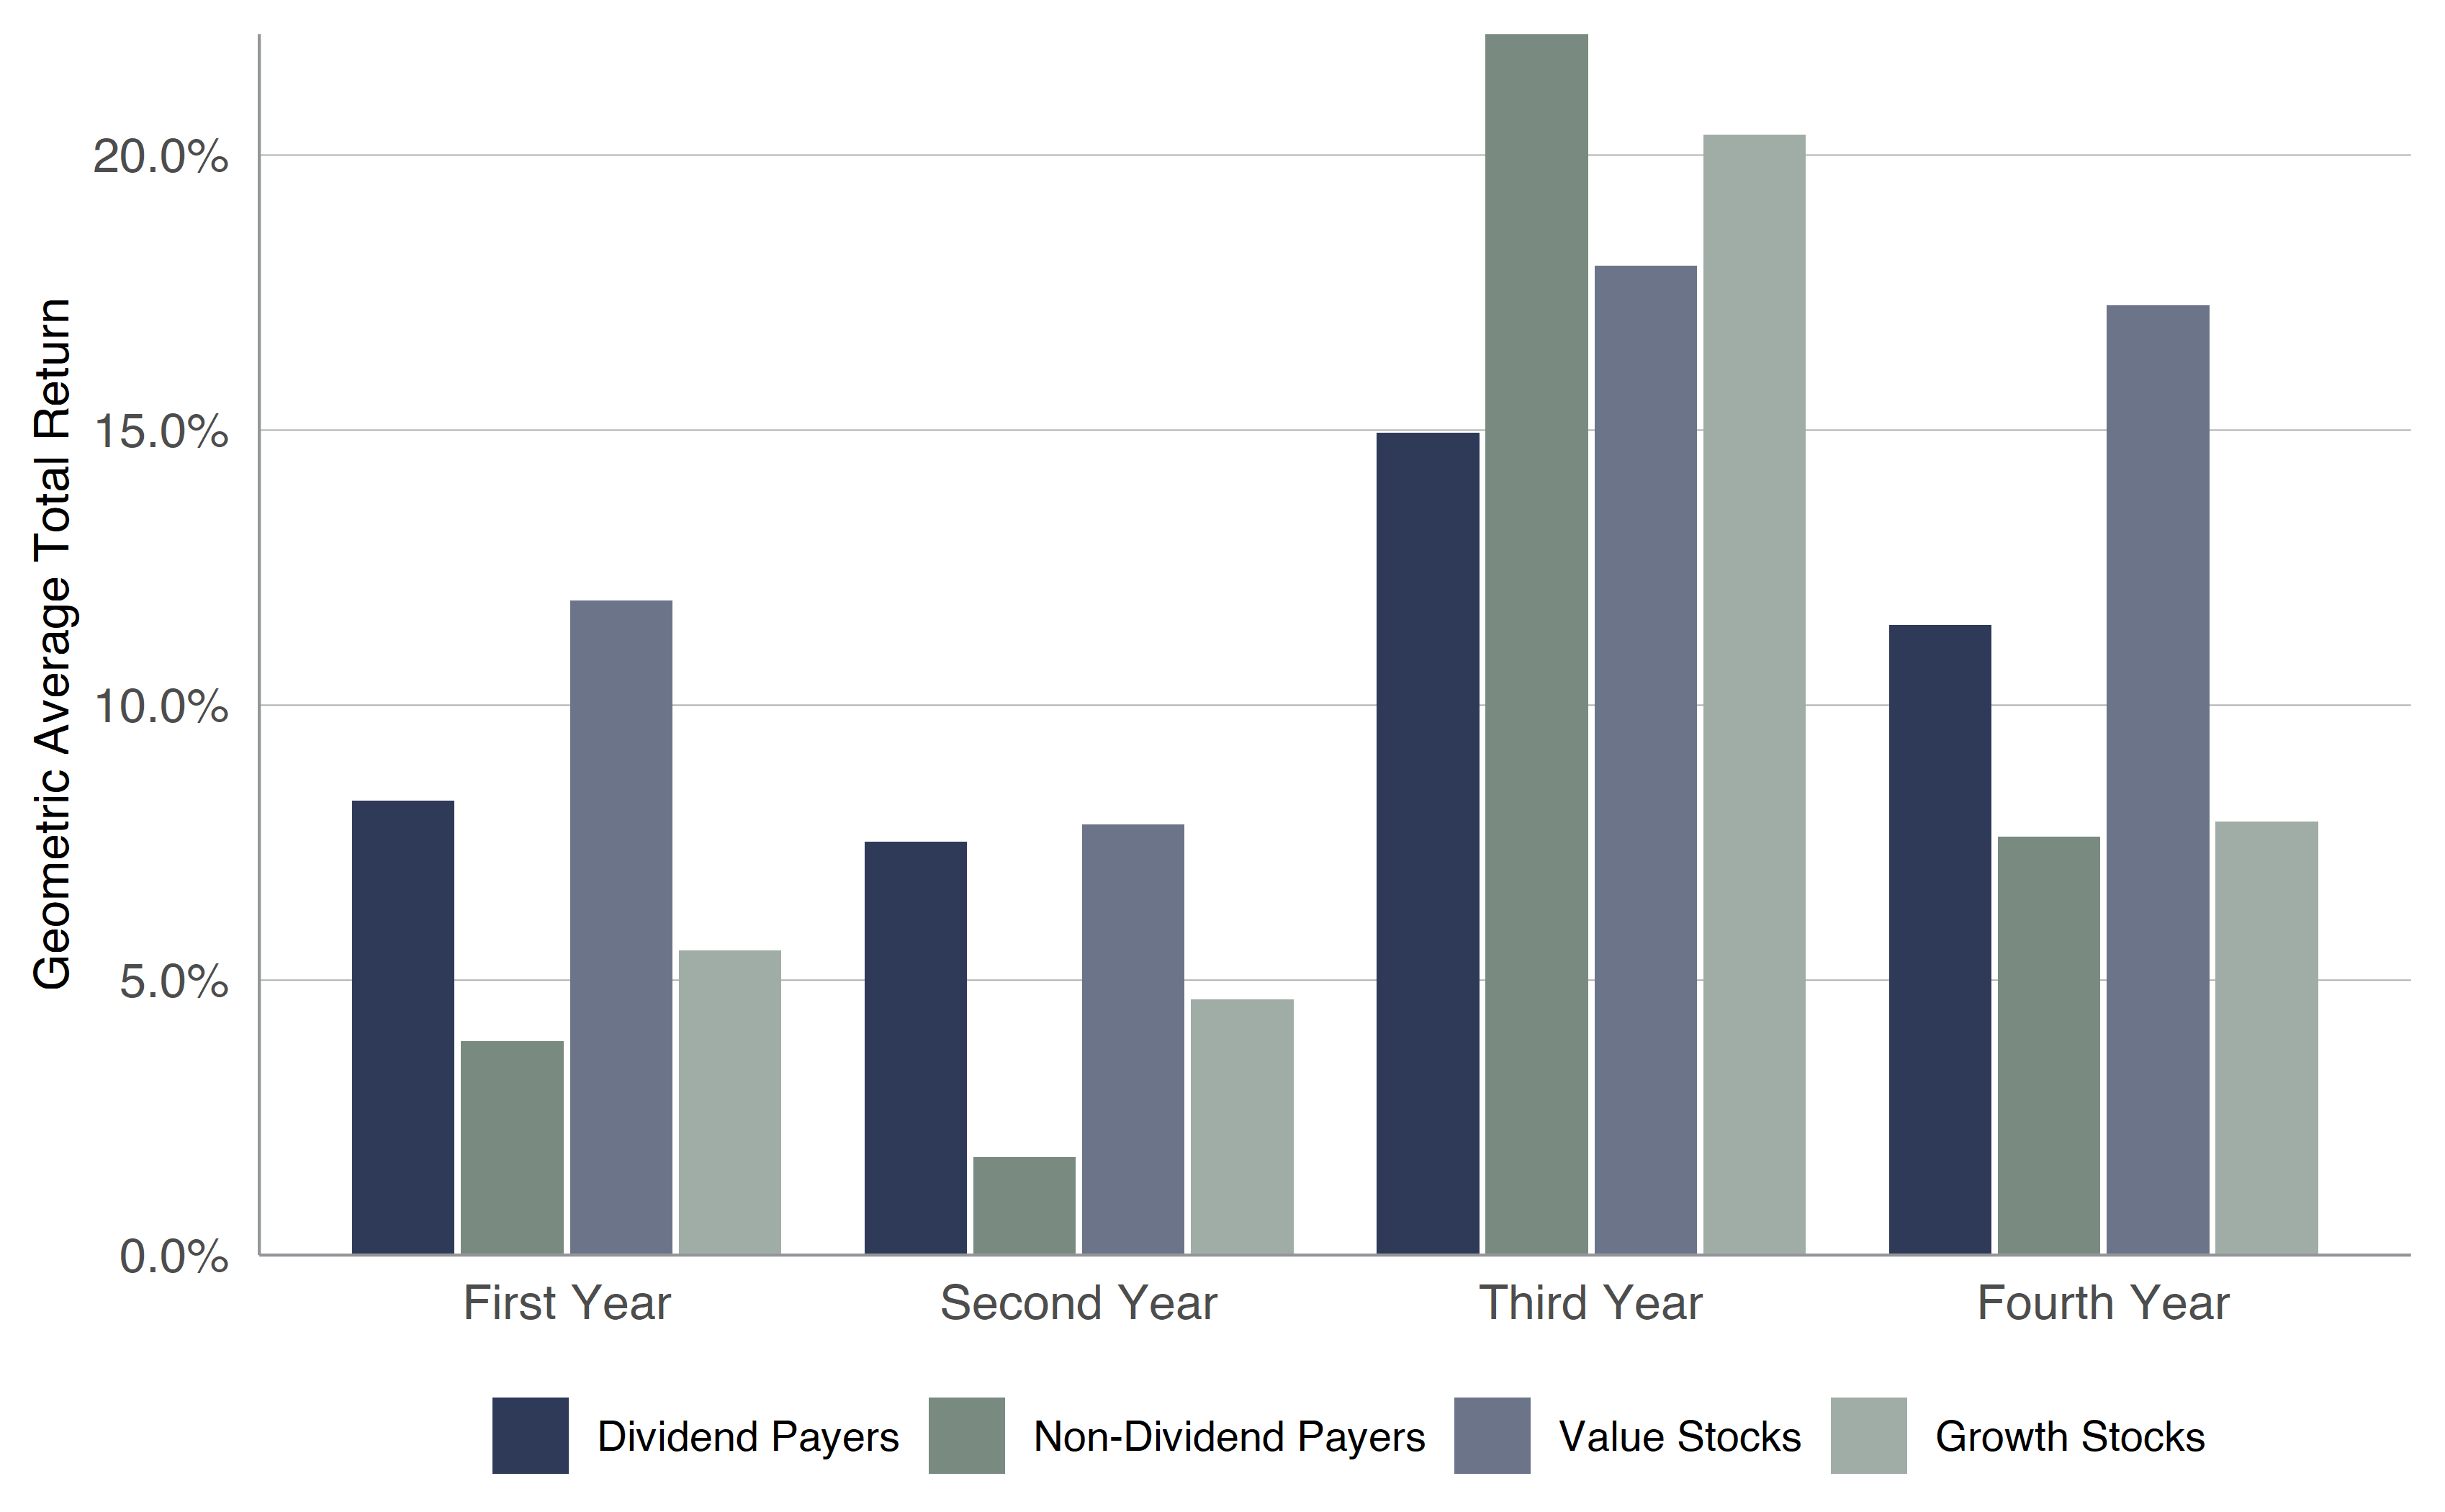
- Figure 6: The Third Year Stands Out from the Others – SOURCE: Kovitz using data from Bloomberg Finance L.P
To be sure, the last two presidencies have been anything but ordinary, yet the solid 14.9% price appreciation for the S&P 500 since Election Day 2020 and the 26.7% gain over the first two years after Election Day 2016 (see Figure 7) were not bad. This is especially true as those returns do not include dividends, while so many supposed market experts were predicting that the Biden victory two years ago and the Trump victory six years ago would lead to big losses in the equity markets.
We’ll see what 2023 brings, but Figure 8 shows that over the past nine-plus decades the S&P has managed a superb geometric average annual total return of 15.9% in the third calendar year of the Presidential Cycle, with 1931 and 1939 the only two years in the red, while Value Stocks and Dividend Payers have had excellent returns, on average.
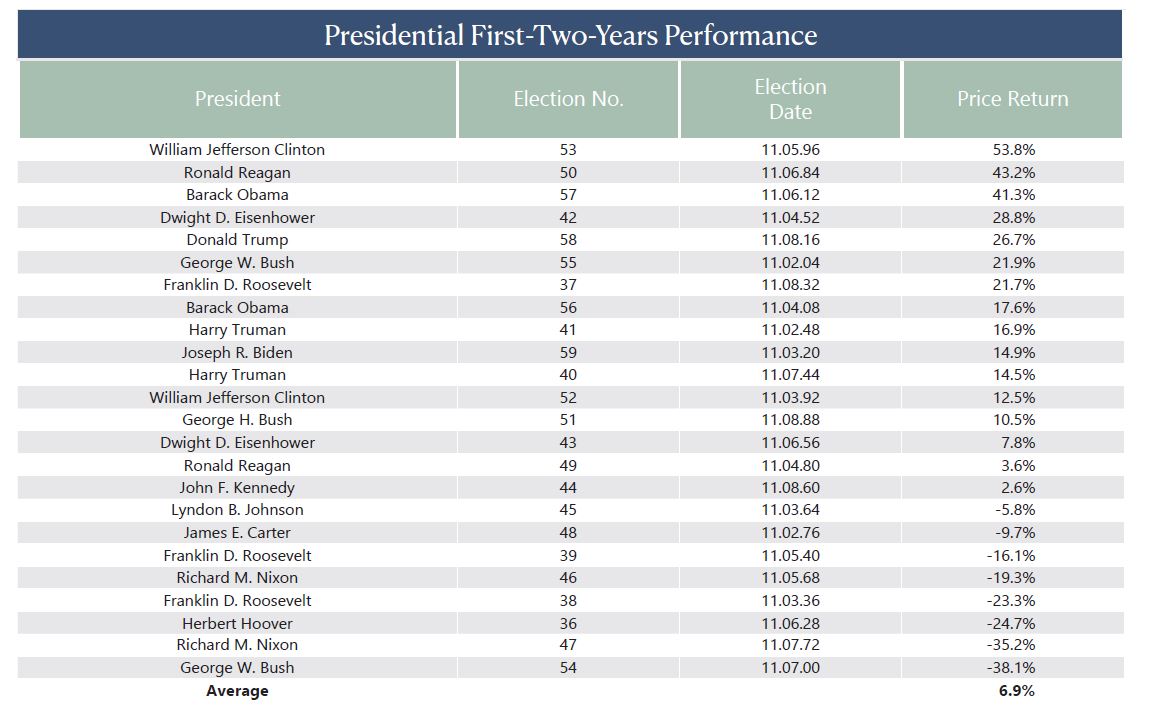
- Figure 7: Since-Election Returns are All over the Map – SOURCE: Kovitz using data from Bloomberg Finance L.P
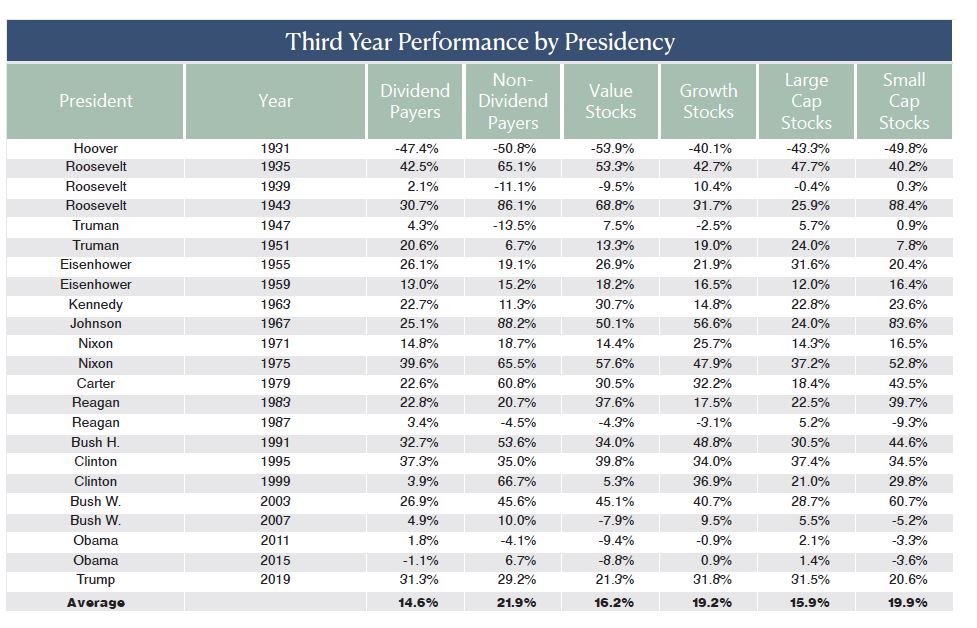
- Figure 8: The Third Year Historically has been Rewarding – SOURCE: Kovitz using data from Bloomberg Finance L.P
The Mid-Term Election votes are still being tabulated, and there is a runoff for the Georgia Senate seat on December 6, but it appears that control of Congress likely will be split with the Democrats retaining their control of the Senate and the Republicans moving to a majority of the House of Representatives. Of course, as Figure 9 details, with a “D” in the Oval Office, stocks have enjoyed terrific two-year returns, on average, no matter the status of Capitol Hill.
KIDS JINGLE BELLING – HOLIDAY GIFTS
For those who are looking to start their festive season shopping early, we think that there are plenty of attractive individual stocks worthy of purchase, but we offer a dozen of our favorites in Figure 10. Each has been marked down considerably this year, while they all sport inexpensive valuation metrics and dividend yields above 3%.
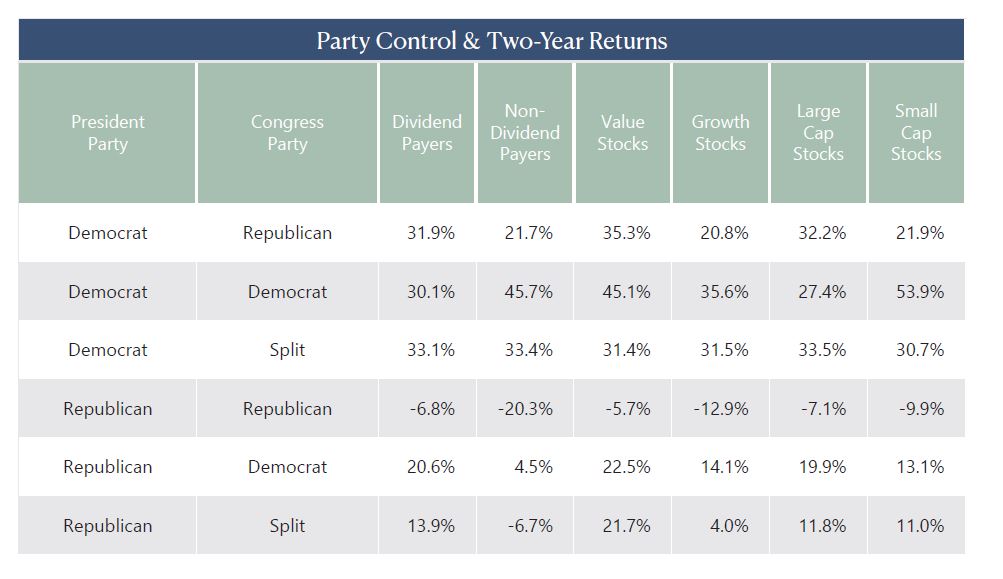
- Figure 9: Investors Seem to be Rewarded by Democrats – SOURCE: Kovitz using data from Bloomberg Finance L.P
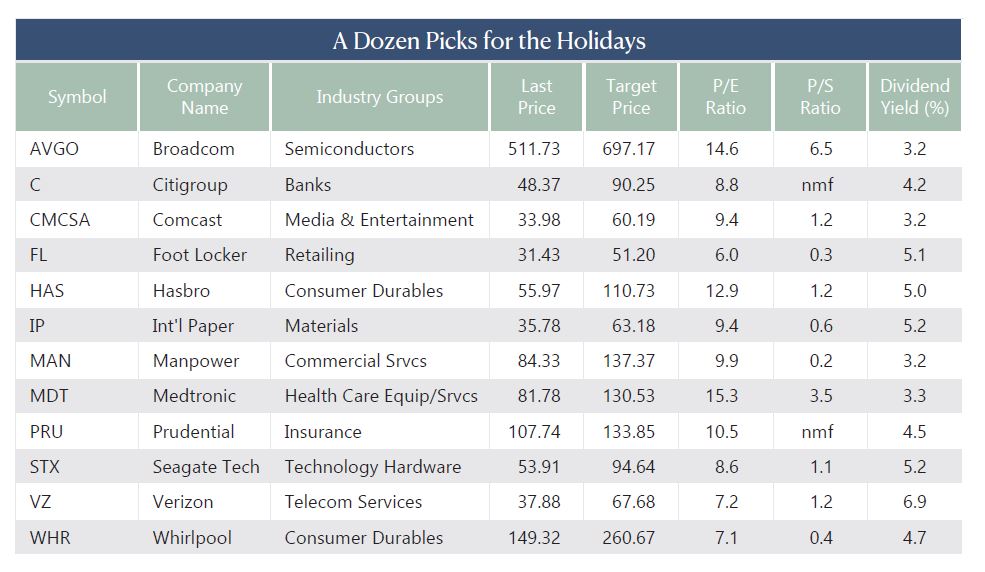
- Figure 10: Undervalued Names to Bring Holiday Cheer – SOURCE: Kovitz using data from Bloomberg Finance L.P
There can be no assurance that hearts will be glowing immediately with the 12 selections, so we offer the reminder that patience is paramount in Value investing, while we always advocate broad diversification. Indeed, our average holding period is measured in years while our Value Plus and Dividend Income managed account strategies contain upwards of 80 undervalued stocks.
Forgotten Financial Favorites
Banking Giant Citigroup (C): Liking the turnaround under new CEO Jane Fraser
Insurance Titan Prudential Financial (PRU): Rising interest rates should soon become a tailwind
Value-Priced Technology Picks
Semiconductor Powerhouse Broadcom (AVGO): Superior integrator of a series of lucrative acquisitions
Data Storage Provider Seagate Tech (STX): Cyclically depressed long-term grower
Battered Communication Services Heavyweights
Media and Television Broadcasting Concern Comcast (CMCSA): Inexpensive free-cash-flow juggernaut
Wireless Telecom Services Provider Verizon (VZ): 5G Leader with 16 straight years of dividend hikes
Globally Exposed Industry Leaders Built to Last
European-Focused Staffing Services Provider ManpowerGroup (MAN): 70 years of profitably helping companies right-size their businesses
Home Appliance King Whirlpool (WHR): Tremendously profitable owner of an iconic brand portfolio
Punishment Doesn’t Fit the Crime Consumer Names
Athletic Footwear and Apparel Retailer Foot Locker (FL): Still highly profitable and buying back stock hand over fist
Toy and Game Maker Hasbro (HAS): Positioned for l0ng-term growth with a focus on fewer, bigger brands, expanded licensing and branded entertainment
Beaten-Down Marquee Names
Paper and Packaging Products Maker Int’l Paper (IP): Inexpensive long-term e-commerce (shipping boxes) play priced at cyclical lows
Medical Device Pioneer Medtronic (MDT): Supply-chain and COVID-19 thunderstorms should dissipate in the fullness of time
HAP-HAPPIEST SEASON OF ALL — IN CONCLUSION
Certainly, we respect that building out a portfolio, maintaining discipline through thick and thin, and consistently making changes to opportunistically take advantage of individual stock price movements is easier said than done. We are always braced for downside volatility, but we have never wavered in our belief that the secret to success in stocks is not to get scared out of them.
We think the Lao Tzu quotation is apt, “If you do not change direction, you may end up where you are heading,” and we would be happy to discuss our asset management and wealth management services, including financial planning and retirement projections.
Learn More:
We frequently publish investment-oriented content on our Blog and reach thousands of subscribers through our weekly Market Commentary and monthly Newsletter. Please click here for subscription information.
For more details about our wealth management and asset management services, kindly fill out this Contact Us form and we’ll reach out to you shortly.
