Our Don’t Forget About Value Special Report, a long-read on value stocks, is available in Adobe pdf format by clicking here.
Value has always been top of mind for us. Despite the broad U.S. equity indexes posting negative returns in January, there was a renewed enthusiasm for stocks in the Value camp, especially those stocks that were left behind in the post-pandemic surge. The Russell 3000 index, which is comprised of the largest 3000 stocks traded in the U.S., posted a total return of -5.9% in the first month of 2022, compared with the Growth subset’s return of -8.9% and the Value subset’s return of -2.6%. Russell’s index methodology allows companies to be represented in both the Value and Growth indexes based on the index provider’s view of a company and the fundamentals. Standard & Poor’s reported an even wider gap between its “pure” indexes, which track the extreme ends of the Value and Growth spectrum. The S&P 500 Pure Value index returned 2.0% in January, compared with the S&P 500 Pure Growth index’s return of -13.3%.
The price of a stock tells us what we should be able to fetch for our shares if we were to sell them or what it would cost us to buy them, but it tells us little about whether a stock is worth selling or buying in the first place. For this, we lean on nearly a century of historical data, academic work, forward-looking data and our own quantitative analysis of the U.S. equity universe.
Value Stocks – What is Value?
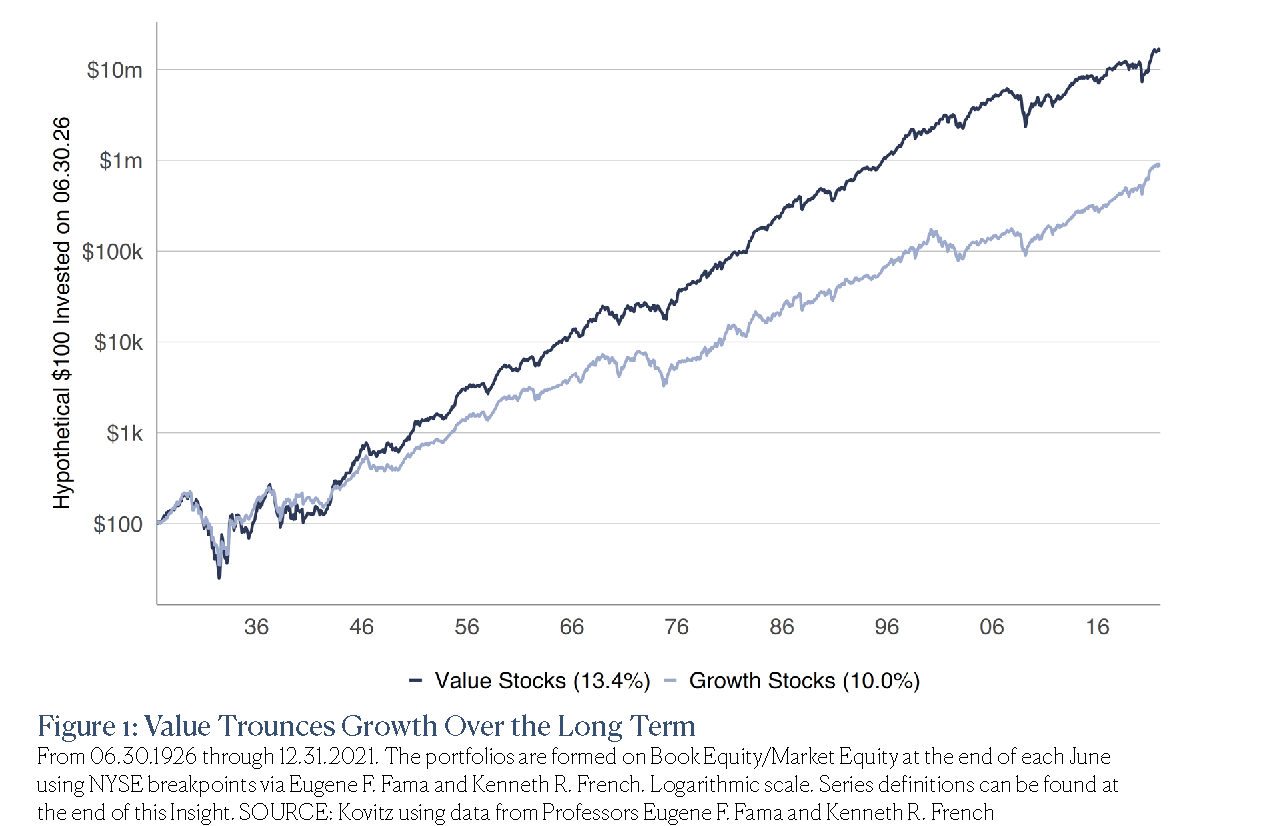
For their academic research, Professors Eugene F. Fama and Kenneth R. French defined Value stocks as those that have high book-to-market ratios, while Growth stocks have a low book-to-market ratios. By “book” the Professors mean the value of the net assets investors should be left with if the company went out of business today. And “market” means the market price of a stock. Presented as a ratio, a higher figure would indicate that the company’s net assets are more valuable relative to the company’s stock (a Value stock), while a lower figure would indicate that the company’s net assets are less valuable relative to the company’s stock (a Growth stock). In Figure 1, we plot the long-term returns for Value and Growth stocks.
Value, But Expanded
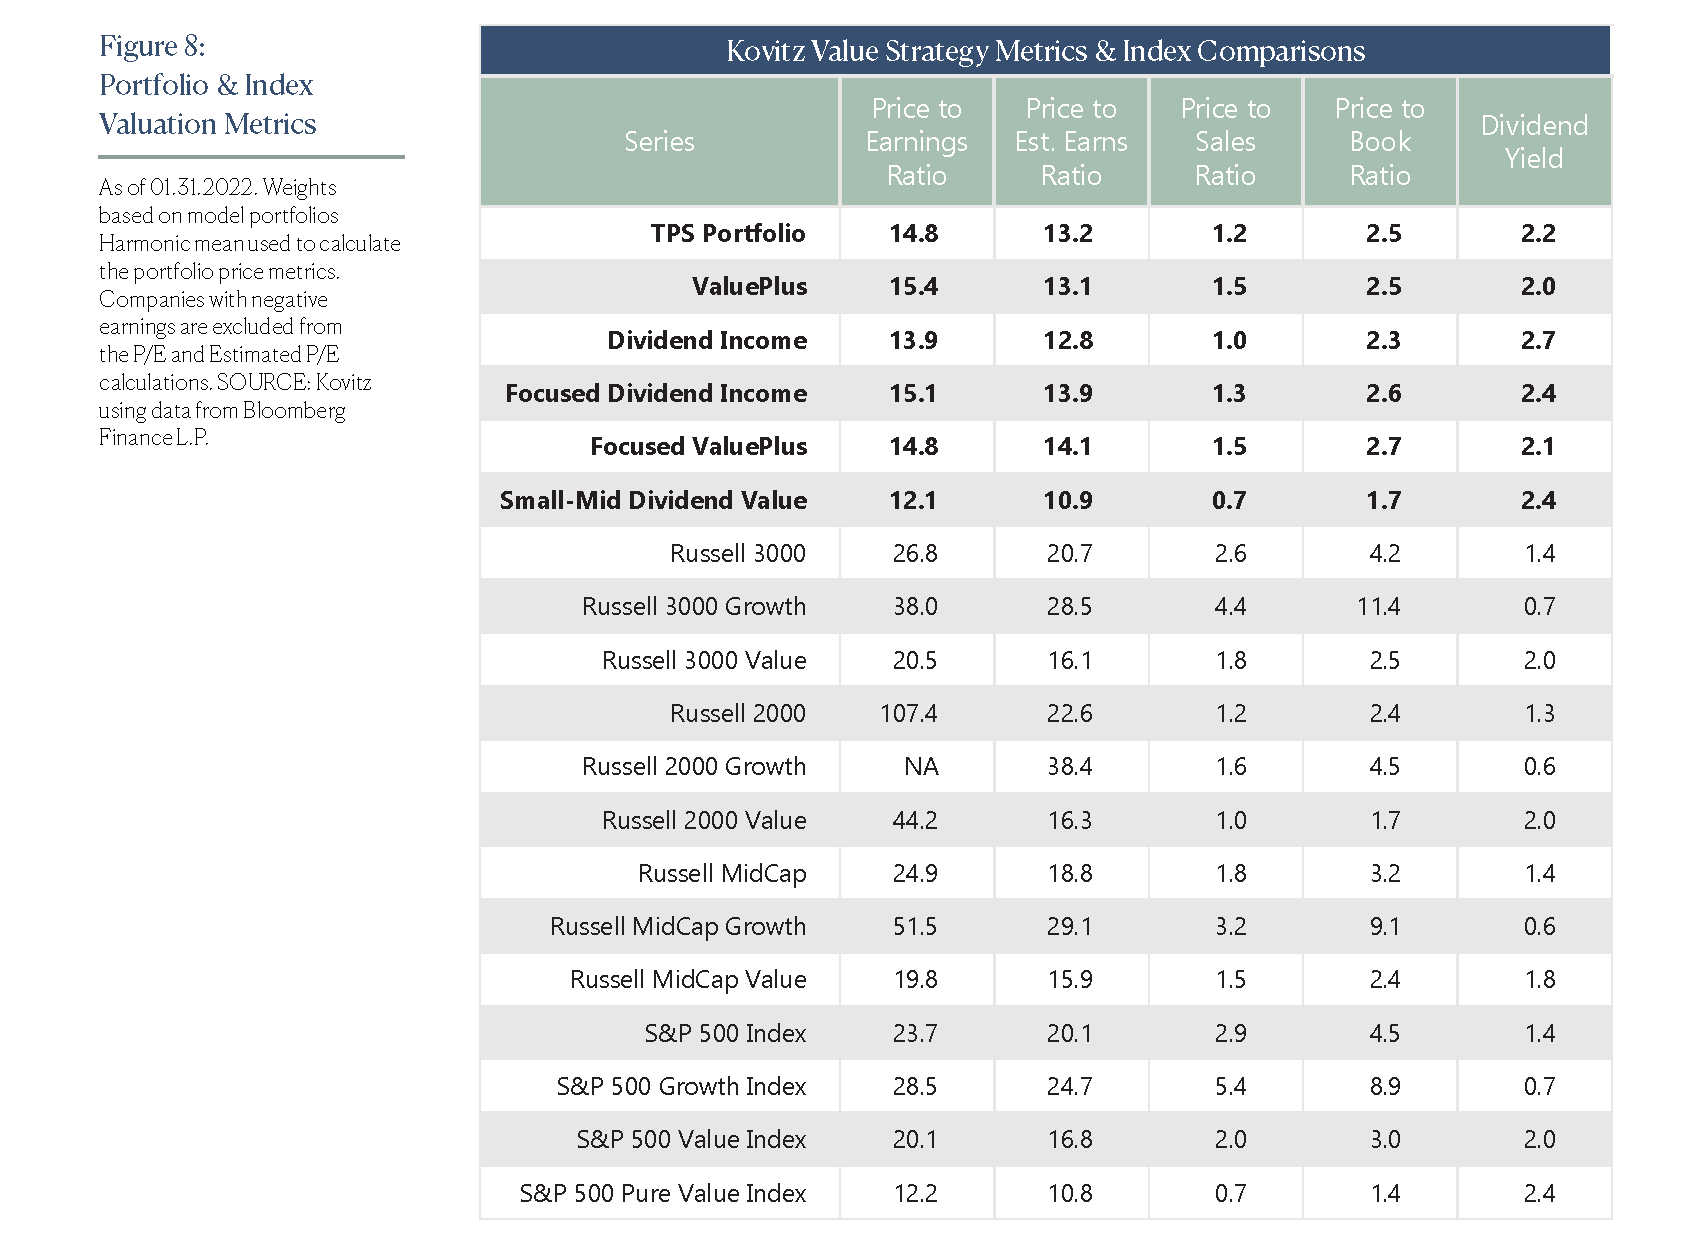
We think it’s too simplistic to differentiate between Value and Growth by just one measure. Therefore, we incorporate multiple valuation measures into the quantitative framework that underpins our ValuePlus, Dividend Income and Small-Mid Dividend Value strategies. On a daily basis, the framework scores more than 3,000 securities across a wide swath of metrics, including measurements of valuation (i.e. Price to Book Ratio or Free Cash Flow Yield) and financial performance (Return on Equity).
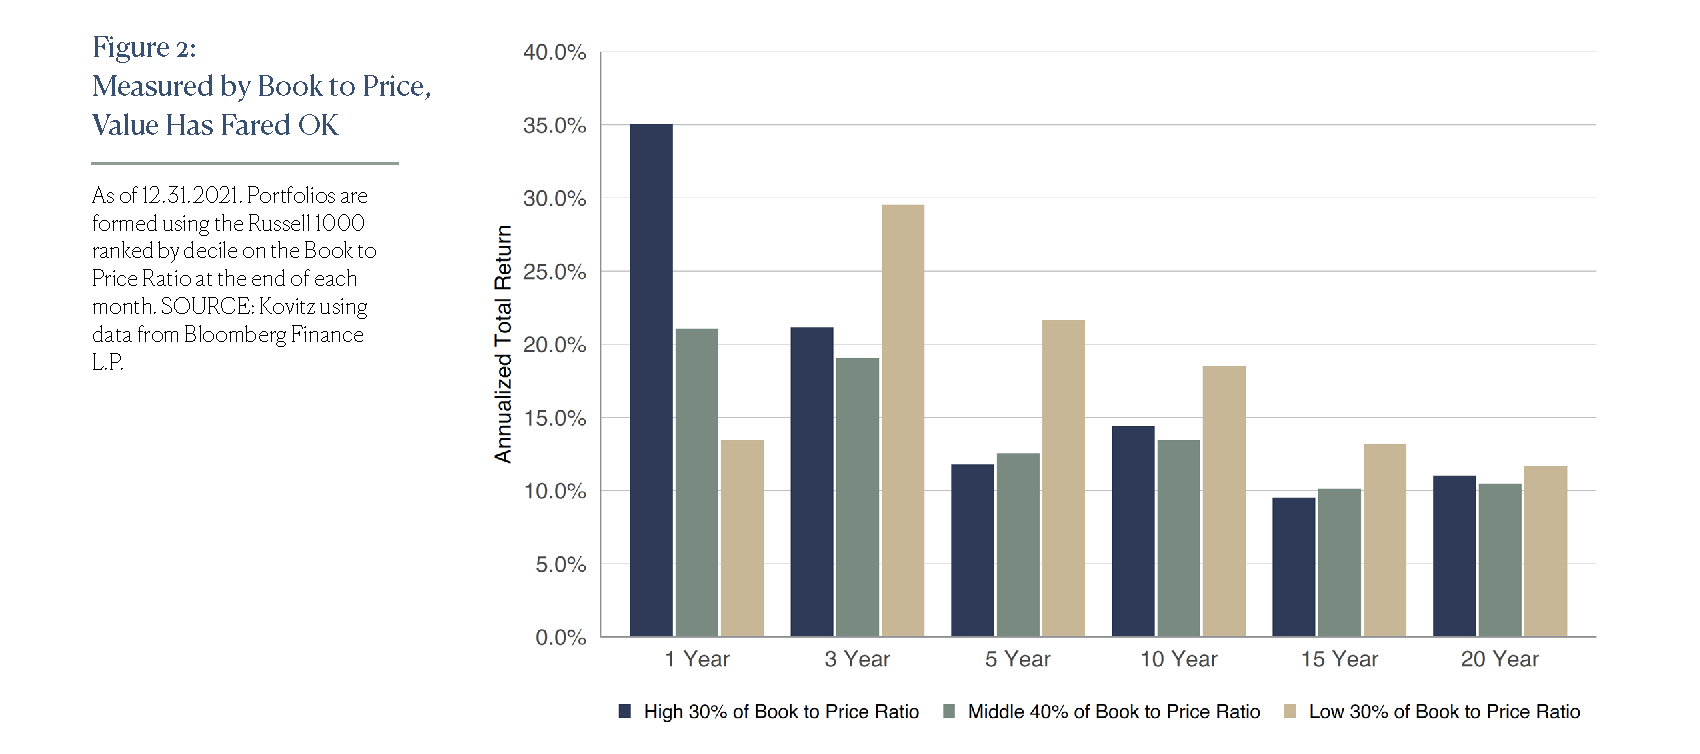
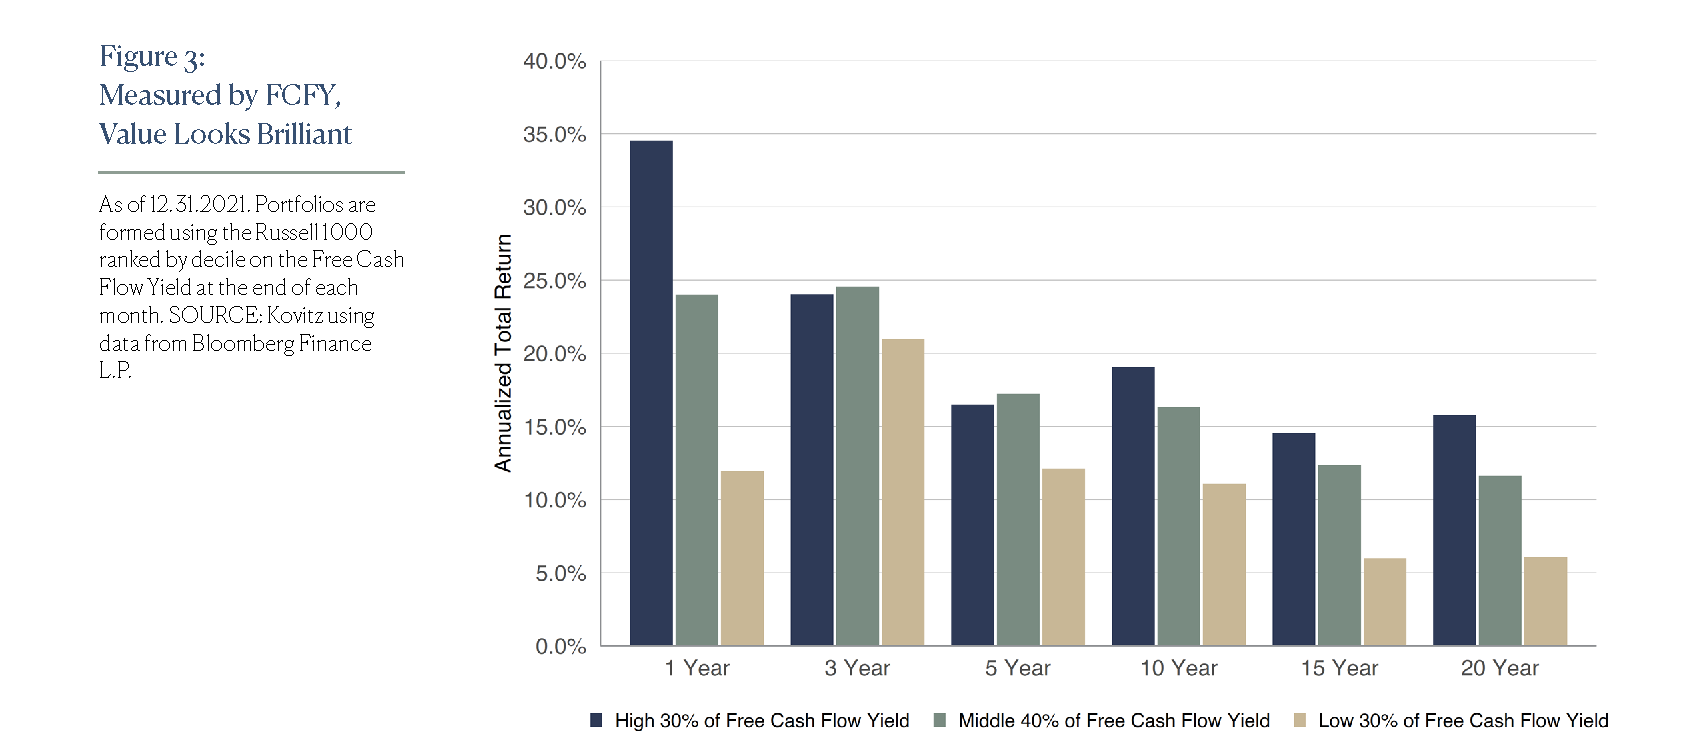
We regularly evaluate our work using data from Bloomberg (historical sources include Thomson Reuters, FactSet and ClariFI) to ensure the existing framework remains useful and to improve it. Select outputs of that work are charted below. Figure 2 shows near-term and long-term performance of companies grouped by the Book to Price ratio (inverse of the frequently cited P/B ratio or analogous to the Book to Market ratio), which we’d consider a classic valuation measure. Figure 3 evaluates the data over the same time period as the preceding figure, but the metric evaluated is Free Cash Flow Yield (FCFY).
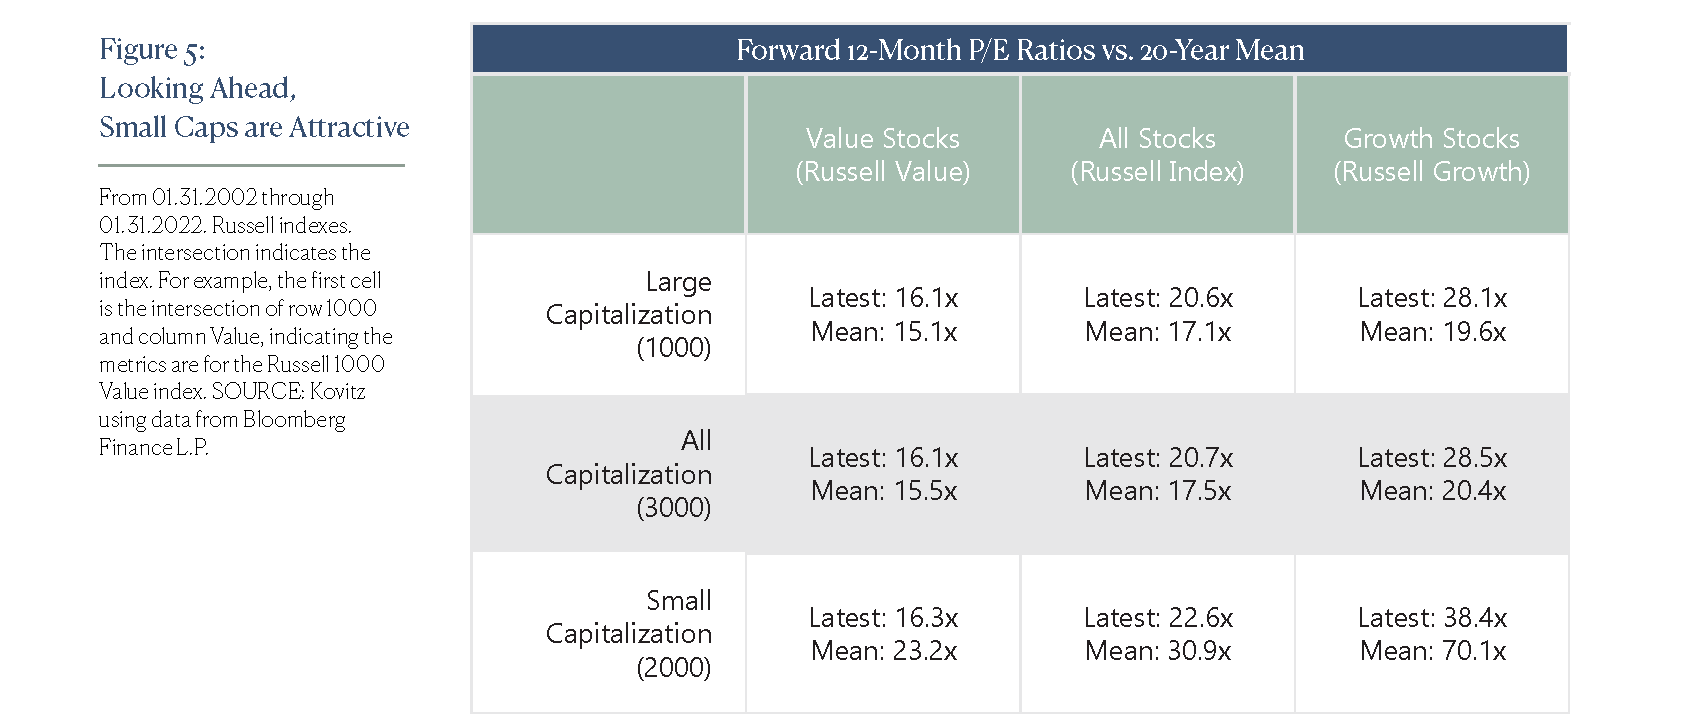
Value Stock Indexes are Comparably Cheap
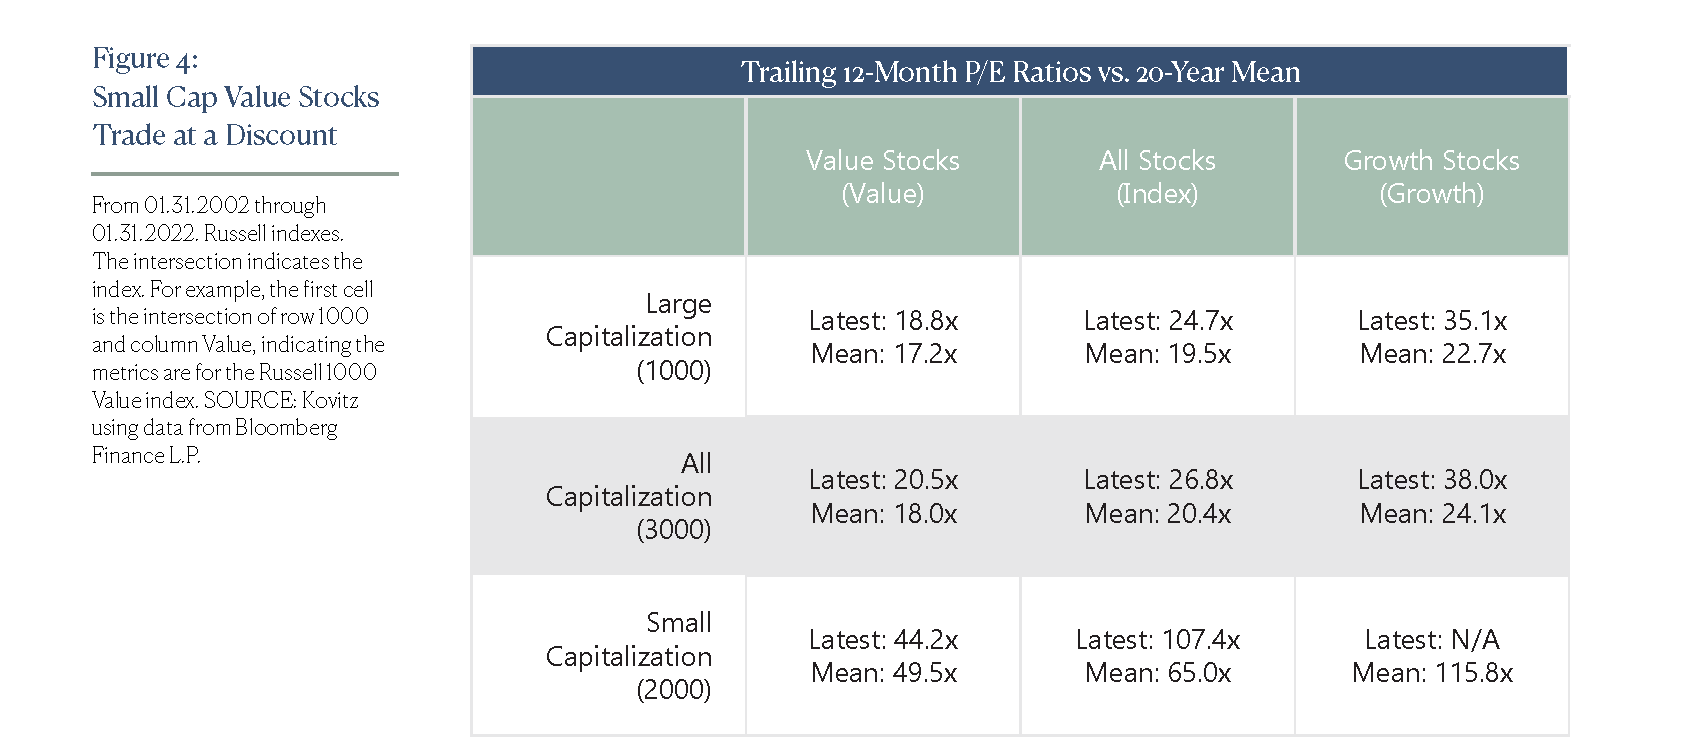
The Russell 3000 (R3000) index is comprised of the 3,000 largest U.S. companies by market capitalization and represents approximately 98% of the investable U.S. equity market. Sub-indexes include the Russell 1000 (largest 1,000 stocks in the R3000 index) and the Russell 2000 (smallest 2,000 in the R3000 index). Each index has a Value subset (companies with higher book-to-price ratios and lower growth values) and a Growth subset (companies with lower book-to-price ratios and higher growth values). In Figure 4, we offer the latest trailing price-to-earnings (P/E) figure and the corresponding 20-year average. The same goes for Figure 5, but instead it uses the forward P/E ratio, which takes into account analyst earnings estimates for the upcoming year. As a group, Value stocks remain near their long-term average valuations, while Growth stocks are planted significantly above their long-term valuation averages. We hear the stock market is very expensive. Fortunately for Value fans, the metrics are much closer to their historical norms and our focus is on stocks that look even less expensive than the indexes.
Value Stocks Have Long Enjoyed Plenty of Sunshine
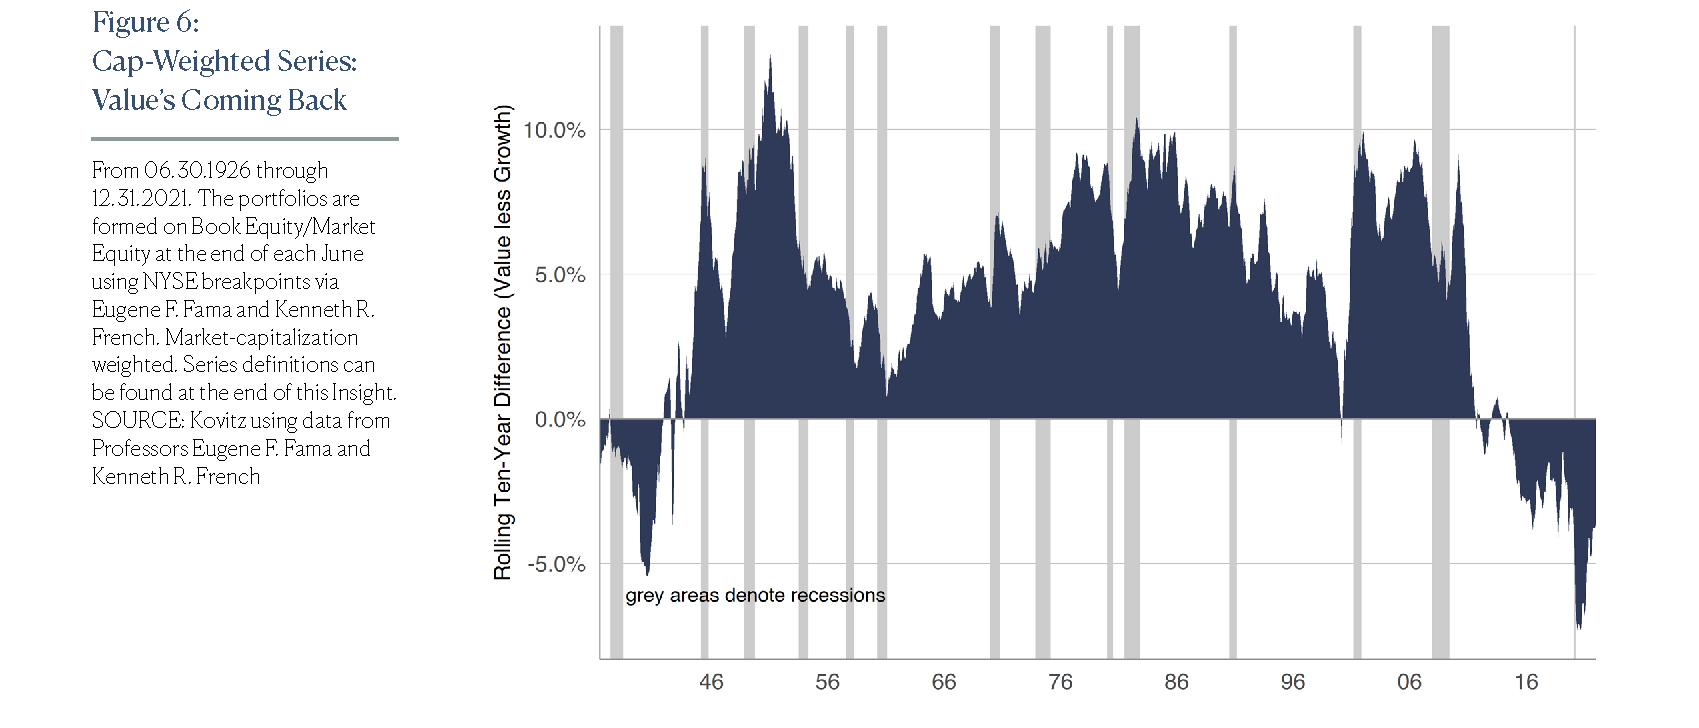
The performance difference between Value stocks and Growth stocks for any rolling ten-year period had never been as wide as it was at the beginning of the pandemic. The chart in Figure 6 shows Value underperformance has been a rare phenomenon over the last nine decades, at least on a market-capitalization-weighted basis, where large stocks have outsized impacts on performance.
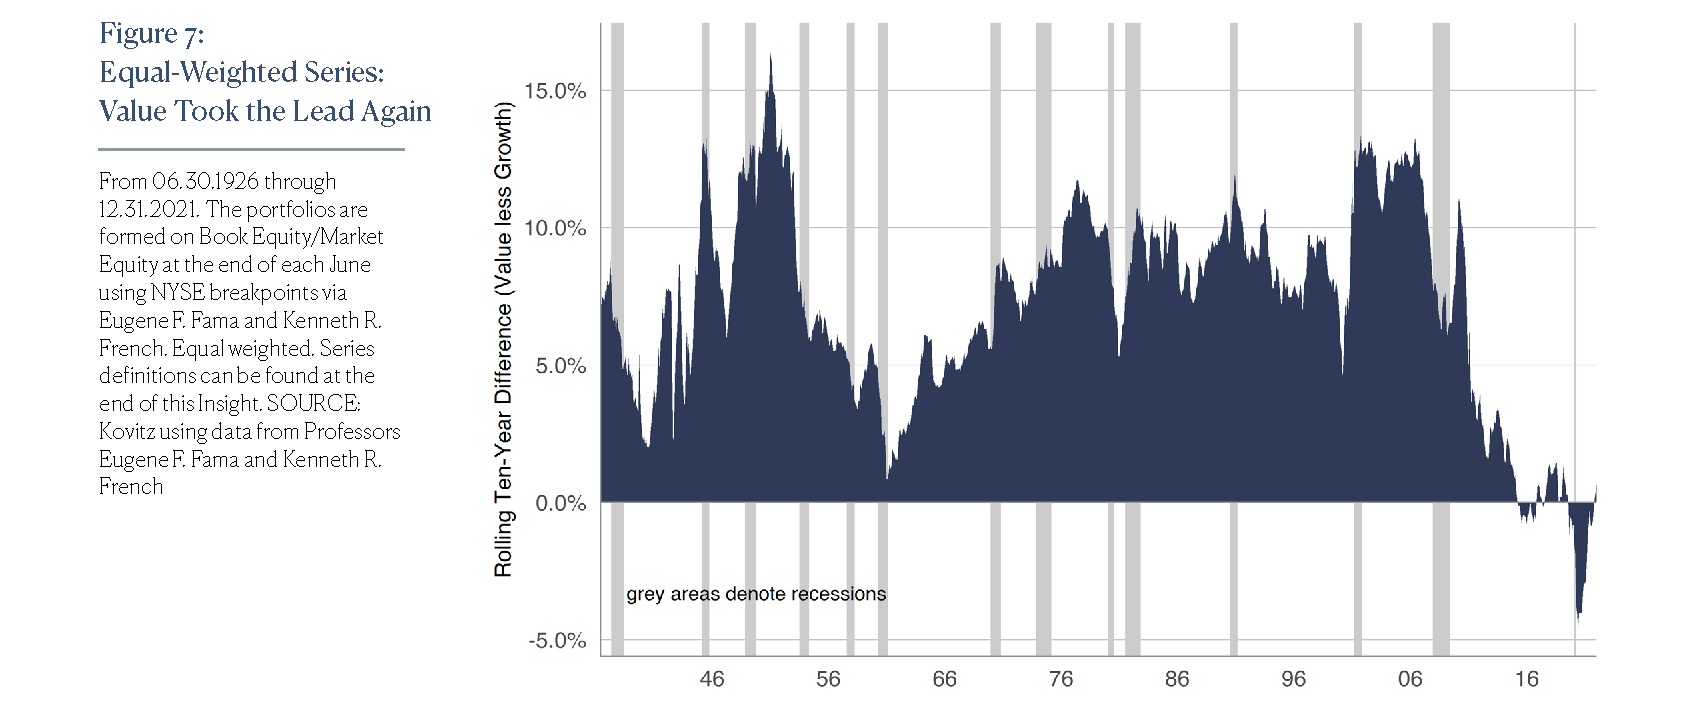
Treat All of the Kids Equally
To solve the issue where big companies with big weights skew returns, the good Professors Fama and French crunched their Value/Growth numbers on equal-weighted portfolios. We argue equal-weighted series are better representations of average Value and Growth stock returns, compared with the capitalization-weighted counterparts. The equal-weighted series in Figure 7 shows Value stocks have recently reclaimed their lead on Growth stocks.
In Search of Value Stocks
Broad market valuation measures are always of interest to us, but we do not rely on them. Instead, our in-house quantitative algorithms sort through time series data for thousands of stocks each day to form the foundation for our ValuePlus, Dividend Income and Small-Mid Dividend Value strategies. We believe distillation of a broad opportunity set into a consolidated list of Value stocks is analogous to “fishing in the appropriate pond.” And once the appropriate short-list is determined, we scrutinize individual equities on a multitude of company-specific factors the algorithms don’t assess. The result aligns with our view that there’s a pocket of Value in any market environment and we remain focused on uncovering bargain-priced stocks with significant appreciation potential.
Learn More:
We frequently publish investment-oriented content on our Blog and reach thousands of subscribers through our weekly Market Commentary and monthly Newsletter. Please click here for subscription information.
For more details about our wealth management and asset management services, kindly fill out this Contact Us form and we’ll reach out to you shortly.