Our Small Companies, Big Potential – An Update Special Report is available in Adobe pdf format by clicking here.
Four and a half decades ago in the first edition of our The Prudent Speculator newsletter, Al Frank (founder of Al Frank Asset Management, which was acquired by Kovitz in 2018), wrote, “Essentially, the PS method is to ‘buy low and sell high.’ Low refers to ‘undervalued’ (in the marketplace) stocks, and high refers to fully- or overvalued stocks. These valuations are based upon historical, current and projected: 1) tangible book value; 2) net working capital; 3) price/earnings ratio; 4) earnings; 5) dividends and dividend policy; 6) price; 7) earned on net-worth percentage; 8) other special considerations unique to the company being analyzed (e.g., management, products, cultural trends); 9) stock market climate; and 10) the individual’s needs, capacities, and portfolio. I include items 9) and 10) in the notion of valuation because it is silly to consider any equity independently of them.”
While substantial analytical work has been completed on these and other quantitative and qualitative factors over the past 45 years, and new metrics have been incorporated into our processes, Al’s initial framework is very much alive in the investment approach by which we manage our ValuePlus, Dividend Income and Small-Mid Dividend Value (SMiD) strategies. True, the markets have evolved over the years, but our basic premise of buying undervalued stocks and patiently holding them until they reach fair value has remained unchanged.
HISTORICAL EVIDENCE
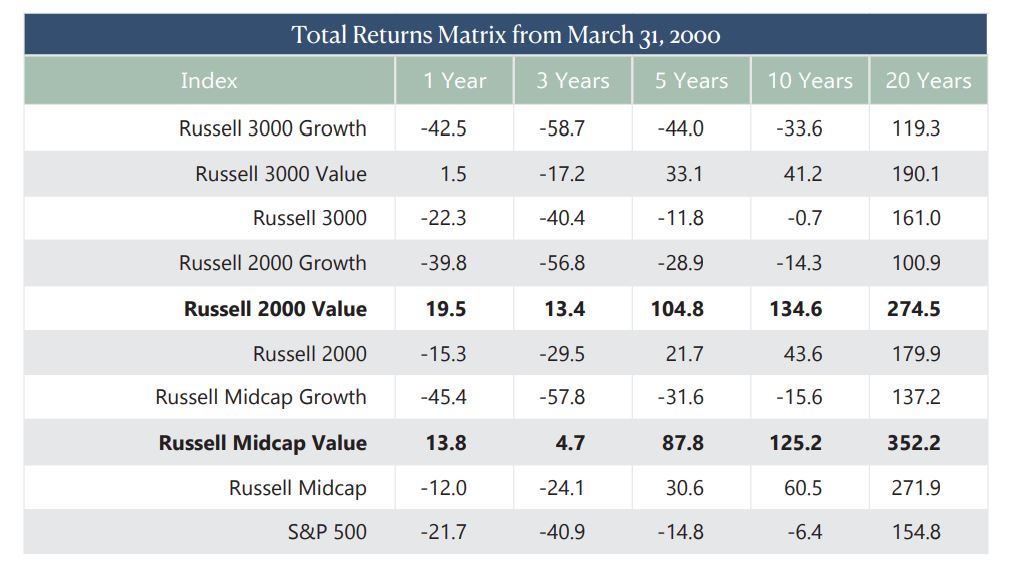
We continue to find value in all market-cap strata, but smaller-cap stocks with reasonable price metrics and generous dividend yields have been largely left behind in recent years. That’s an anomaly for many reasons, especially considering the terrific long-term performance for Small Value stocks (in Figure 1). In addition to some of our more-recent newsletter picks being of the small-cap variety, we have a SMiD strategy to better appreciate this area.
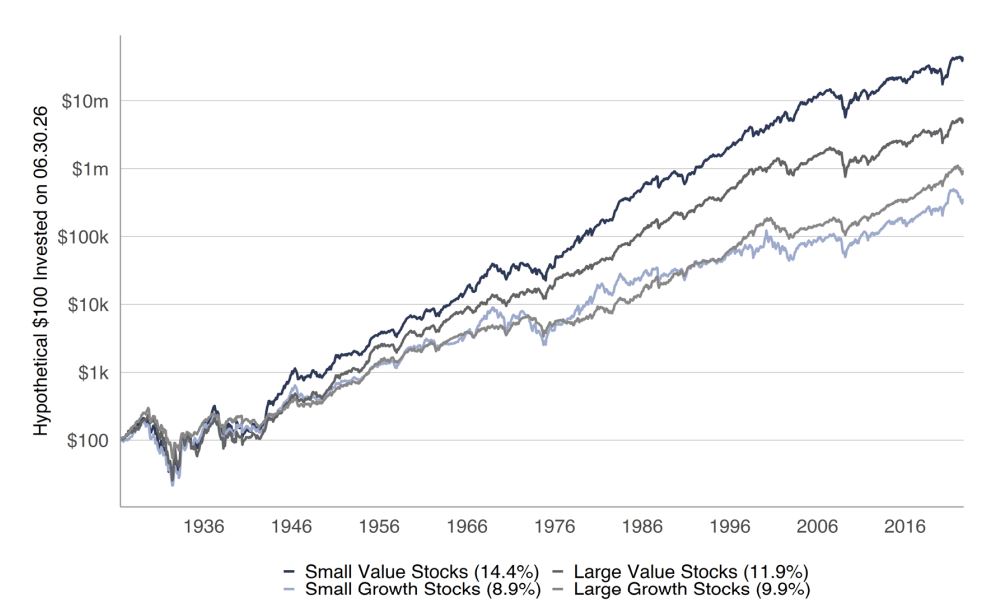
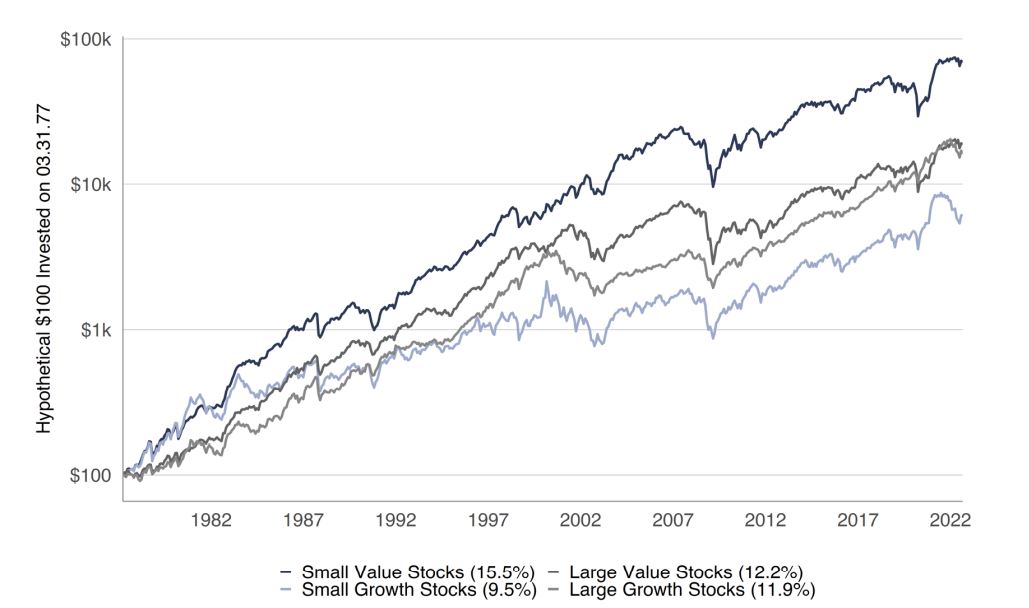
SINCE 1977
Since the inaugural issue of The Prudent Speculator was published in March 1977, the Small-Cap Value subset of stocks (as determined by portfolios constructed by Professors Eugene F. Fama and Kenneth R. French based on size and book-to-market) have trounced the comparable Growth indexes, even as the horse race between Large Value and Large Growth over the same period has been closer and favored the former by a neck.
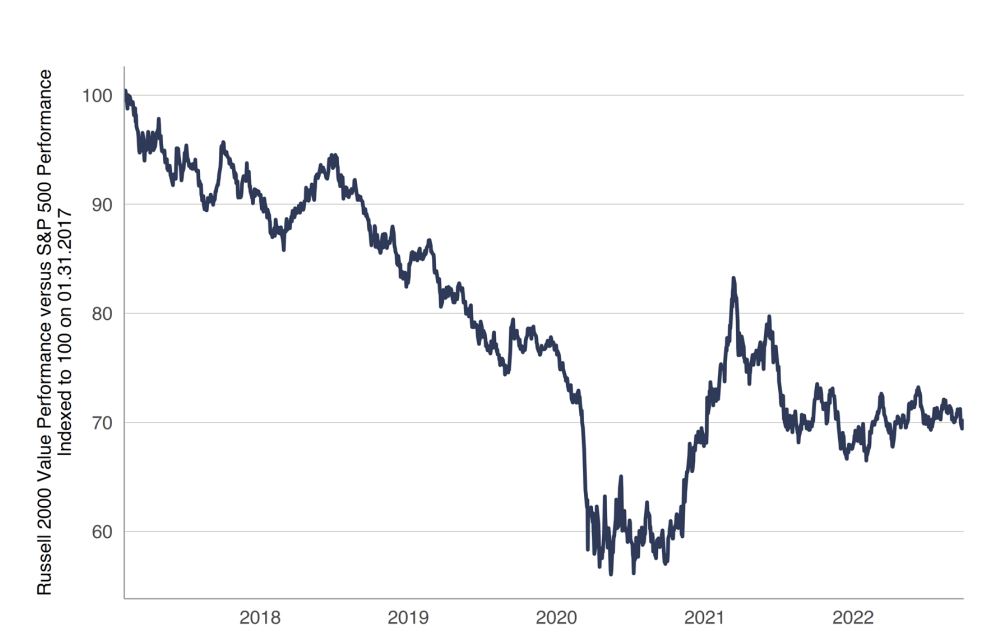
RECENT HISTORY – SMALL VS LARGE
Over the past five-plus years, the performance gap between Small-Cap Value (market caps between $15 million and $6.0 billion on September 30) and the Large-Cap S&P 500 has been unusually wide. The tide started to turn in Q4 2020, but there is a long way to go just to reach equilibrium, much less return Small Cap Value to its leadership position.
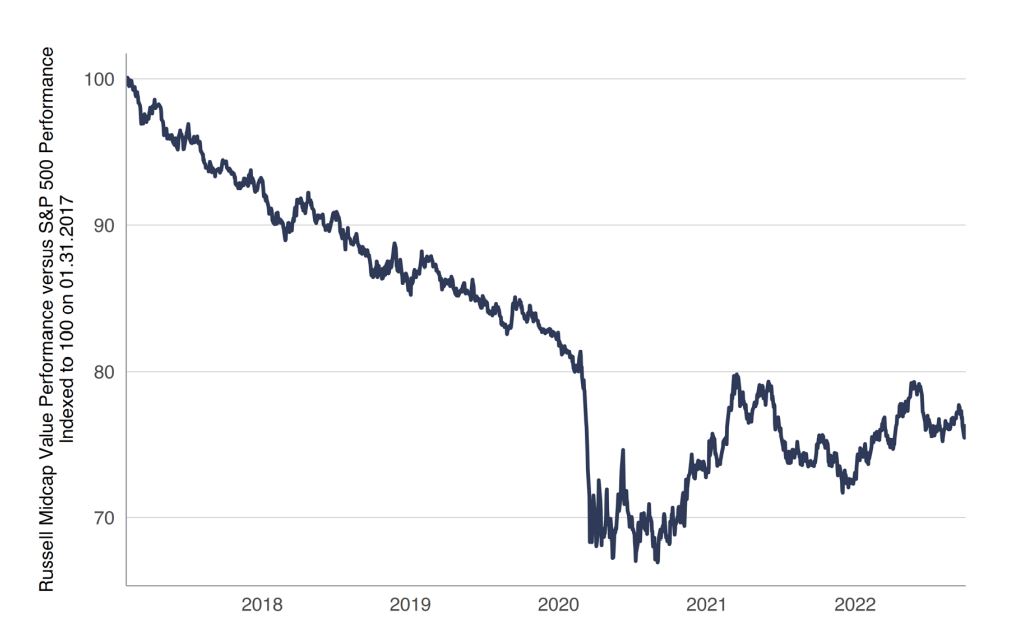
RECENT HISTORY – MID VERSUS LARGE
The story is similar for the relative returns race since 2017 between the S&P 500 and the Russell Mid-Cap Value index. Of course, many Mid-Cap stocks have graduated into Large-Cap territory as the market capitalizations for that index ranged between $697 million and $45.2 billion on September 30, but we continue to find plenty of inexpensive names in this underfollowed section of the market.
DÉJÀ VU ALL OVER AGAIN
With interest rates moving sharply higher as the Federal Reserve has significantly tightened monetary policy, there has been a collapse this year in the share prices of many formerly high-flying meme stocks, special purpose acquisition companies and profitless companies, not unlike what was seen when the Tech Bubble burst in 2000. Mark Twain said, “History never repeats itself, but it does often rhyme,” so we can’t help but like how Small- and Mid-Cap Value performed post March 31, 2000.
SEPARATING THE WHEAT FROM THE CHAFF
Finding attractively priced stocks with strong risk-adjusted appreciation potential in the Small- and Mid-Cap arena is not an easy task. After all, 5,480 issues traded on the New York Stock Exchange and 5,363 traded on the Nasdaq in 2021, so there are plenty of candidates, larger and smaller, from which to choose. To make it into our portfolios, stocks must pass three tests:
(1) A backward-looking quantitative screen to ensure that a company is truly value-priced by our way of thinking relative to its peers and the market in general.
(2) A qualitative review to ensure that we like the long-term prospects of the underlying business.
(3) A forward-looking valuation calculation to determine a Target Price and to ensure that the upside total return potential over the next three-to-five years is sufficient relative to the risk we perceive to be inherent in the investment.
VALUE ALGORITHM
The Value Investment Committee analyzes the fundamentals supporting about 3,000 individual stocks, both domestic and international, with trading liquidity a criterion in the universe selection. The output of this fully automated review is a value scoring algorithm that incorporates a range of metrics historically indicative of future potential outperformance with daily updates of all required fundamental data for each security. A sample of the categories of metrics the Committee reviews: Revenue, Earnings, Earnings Before Taxes, Tangible Book Value, Dividend Yield, Free Cash Flow, ROCE and ROIC.
The algorithm aggregates individual metrics into a composite stock scoring system that ranks individual stock valuations in the context of valuations among peers and the broader universe. Peer-relative scale ensures like-for-like relative valuation context. Universe-relative scale captures sector-relative over-and under-valuation trends over time.
THE NUMBERS TELL ONLY PART OF THE STORY
Our screening algorithm identifies potentially undervalued names, but the team must pick truly unique stocks with the greatest potential reward, while the upside must be sufficient to cover the risk assumed in pursuit of the opportunity. We employ deeper reviews of financial strength and earnings quality and, perhaps more importantly, a qualitative review of the company.
Indeed, as we endeavor to avoid the proverbial buggy-whip maker, we consider brand strength, competitive positioning, intellectual property defensibility, management tenure, product breadth & depth and reporting quality, along with other intangible factors. No guarantee that we will find an Apple, with its now ubiquitous iPhone, but we are endeavoring to avoid stocks like Motorola, Palm and Blackberry, all of which in their day had must-have smartphones/hand-held devices.
GROWTH IS A SIGNIFICANT COMPONENT OF VALUATION
Stocks that pass our initial screening algorithm and our qualitative review are next evaluated via a forward-looking process which determines our long-term Target Prices. This is our assessment of fair value three-to-five years hence and is based on our estimates of the growth in revenue, earnings and stockholders’ equity, multiplied by our determination of a reasonable price multiple for those metrics.
For a simplistic example, recent mid-cap recommendation Dick’s Sporting Goods (DKS), we think, will see its earnings per share grow from the current fiscal ’23 estimate of $11.38 to $12.50 by fiscal ‘25, yet the stock trades for a single-digit P/E ratio. More importantly, Dick’s is the largest pure sporting goods chain in the U.S., with limited competition in many of its markets, while it has a strong position in high school and youth sports as well as a large and popular loyalty program. The balance sheet also is solid, while management has been buying back stock, so we think an earnings multiple of 12 to 14 is warranted.
Obviously, there is plenty of subjectivity in our Target Price setting, so we strive to be conservative in our estimates and multiples, while we also recognize that we are always focused on total return in our investments, meaning that the dividend income produced over the life of our holding must also be considered. Although DKS sports a yield of only 1.7%, the current market price offers plenty of capital gains potential in our view, while we won’t complain about receiving forty-eight-and- three-quarter cents per share of income each quarter to boot.
METRICS & CONCLUSION
Broad market valuation measures are always of interest to us, but we do not rely on them. Instead, our in-house quantitative algorithms sort through time series data for thousands of stocks each day to form the foundation for our ValuePlus, Dividend Income and Small-Mid Dividend Value strategies. We believe distillation of a broad opportunity set into a consolidated list of Value stocks is analogous to “fishing in the appropriate pond.”
And once the finalist candidates are determined, we scrutinize individual equities on a multitude of company-specific factors the algorithms don’t assess. The result aligns with our view that there’s a pocket of Value in any market environment and we remain focused on uncovering bargain-priced stocks with significant appreciation potential.
Our Investment Committee has money across all our strategies, so we do not favor one over the other, but we sure do like to eat our own cooking. Of course, with the opportunity in Small- and Mid-Cap stocks especially interesting these days, we have recently pushed more of our personal chips into our SMiD managed account portfolio.
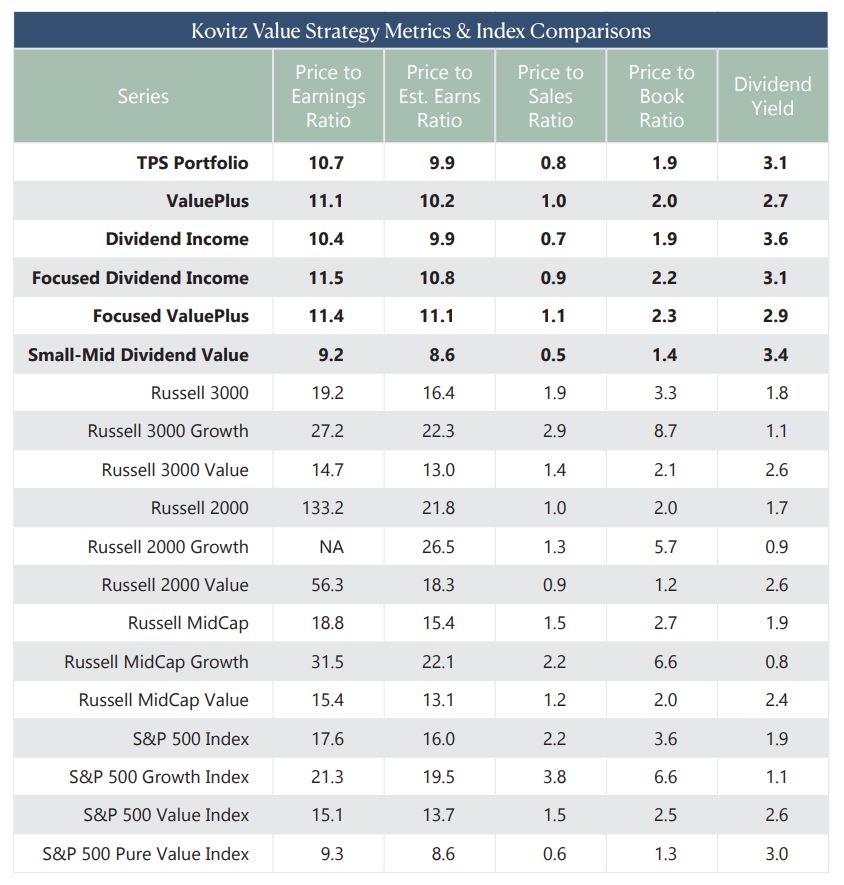
Of course, we sleep better at night with the knowledge that the metrics on our portfolios generally are far less expensive than those of the major market averages and are even priced more favorably than nearly all the Value indexes. What’s more, our dividend payouts are at the top of the charts in the yield derby.
LEARN MORE
We frequently publish investment-oriented content on our Blog and reach thousands of subscribers through our weekly Market Commentary and monthly Newsletter. Please click here for subscription information.
For more details about our wealth management and asset management services, kindly fill out this Contact Us form and we’ll reach out to you shortly.