Our Special Report, Stay The Course is available in Adobe pdf format by clicking clicking here.
After gaining more than 120% between March 23, 2020 and January 3 of this year, the S&P 500 index, a benchmark of the 500 largest companies in the U.S., has fallen nearly 20% over the last four months. In addition to the War in Ukraine, a sharp uptick in inflation, which has been climbing rapidly for a year and hit a high of 8.5% in March, has weighed on consumers and businesses, and led the Federal Reserve to hike interest rates as it tightens monetary policy.
Certainly, downturns can be scary, even though index returns since 1925 show that respective drops of 10%, 15% and 20% have occurred every 11 months, 25 months and 3.5 years, on average. It also takes longer for the index to rise than fall, with 10% gains taking nearly 250 calendar days on average, compared to around 100 days for 10% losses. For respective 15% advances and declines, it takes on average more than 500 days and 200 days. Bear Markets happen even quicker – 286 days –with 20% or greater advances lasting 995 days, on average. The good news, however, is that the magnitude of the rallies has dwarfed the setbacks, with the average gain in Bull Markets more than three times as large as the average loss in Bear Markets.
Q1 EARNINGS Season
With all the disconcerting news, it would be easy to miss the broadly positive figures reported over the Q1 earnings season, even as ‘supply chain issues’ in some form were once again raison du jour this past quarter for soft C-suite guidance. iPhone-maker Apple, known for aggressive management of its supplier network, warned that supply chain challenges are expected to cause a $4 billion to $8 billion revenue-whack in the current quarter. Shares of retail giant Amazon were clobbered after the company’s weaker-than-expected outlook included warnings of wage inflation, soaring transportation costs and supply chain disruptions. Streaming giant Netflix thankfully did not blame supply chain challenges for its 200,000 net subscriber losses, far below guidance of 2.5 million net additions. The result of the first quarterly subscriber loss in a decade was a one-day -35% plunge, part of a drop this year of close to 70%.
Even those companies that performed very well in Q1 and were upbeat in their guidance ran into headwinds. Electric vehicle maker Tesla turned in better-than-expected and record EPS, stating, “In the first quarter, we produced over 305,000 vehicles and delivered over 310,000 vehicles, despite ongoing supply chain challenges and factory shutdowns,” yet the stock price has dropped by more than a quarter this year. No doubt, a trailing-12-month P/E ratio of more than 75, a forward-earnings multiple of greater than 50 and massive share sales by founder Elon Musk as he raises money to finance a bid for Twitter, have more to do with the selloff in Tesla than did the Q1 results.
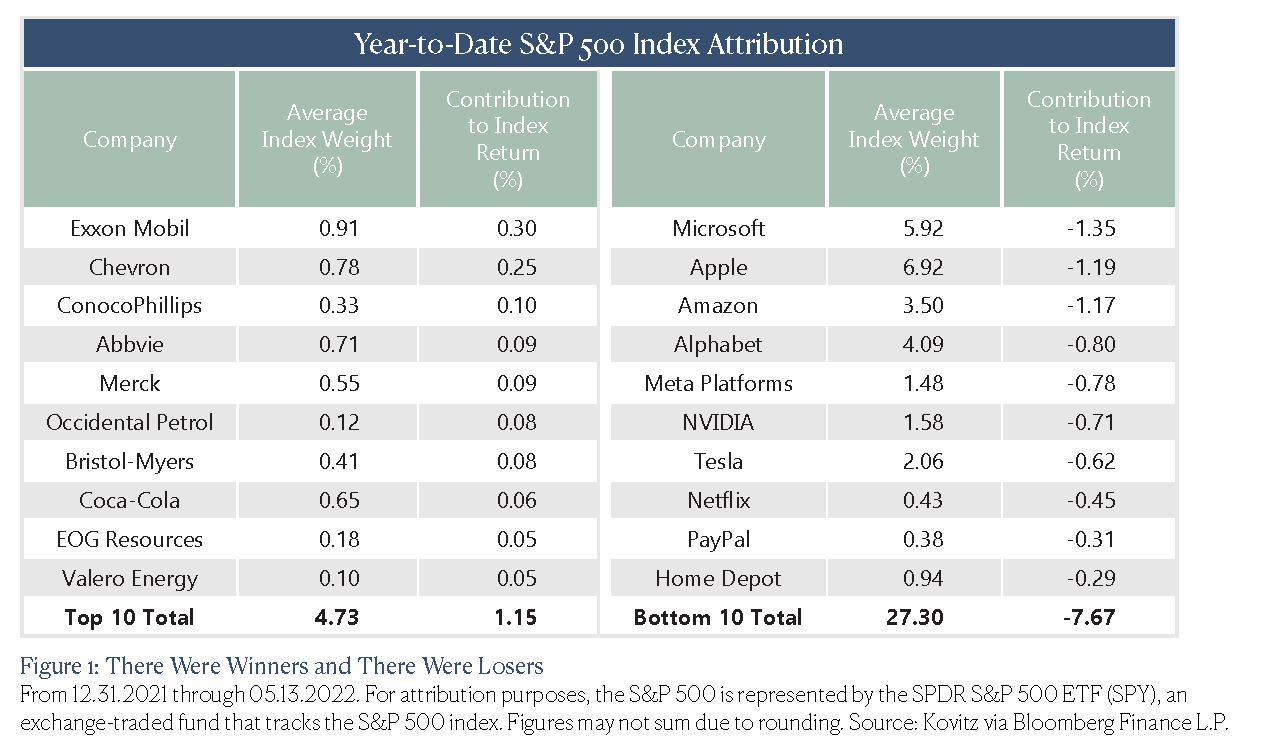
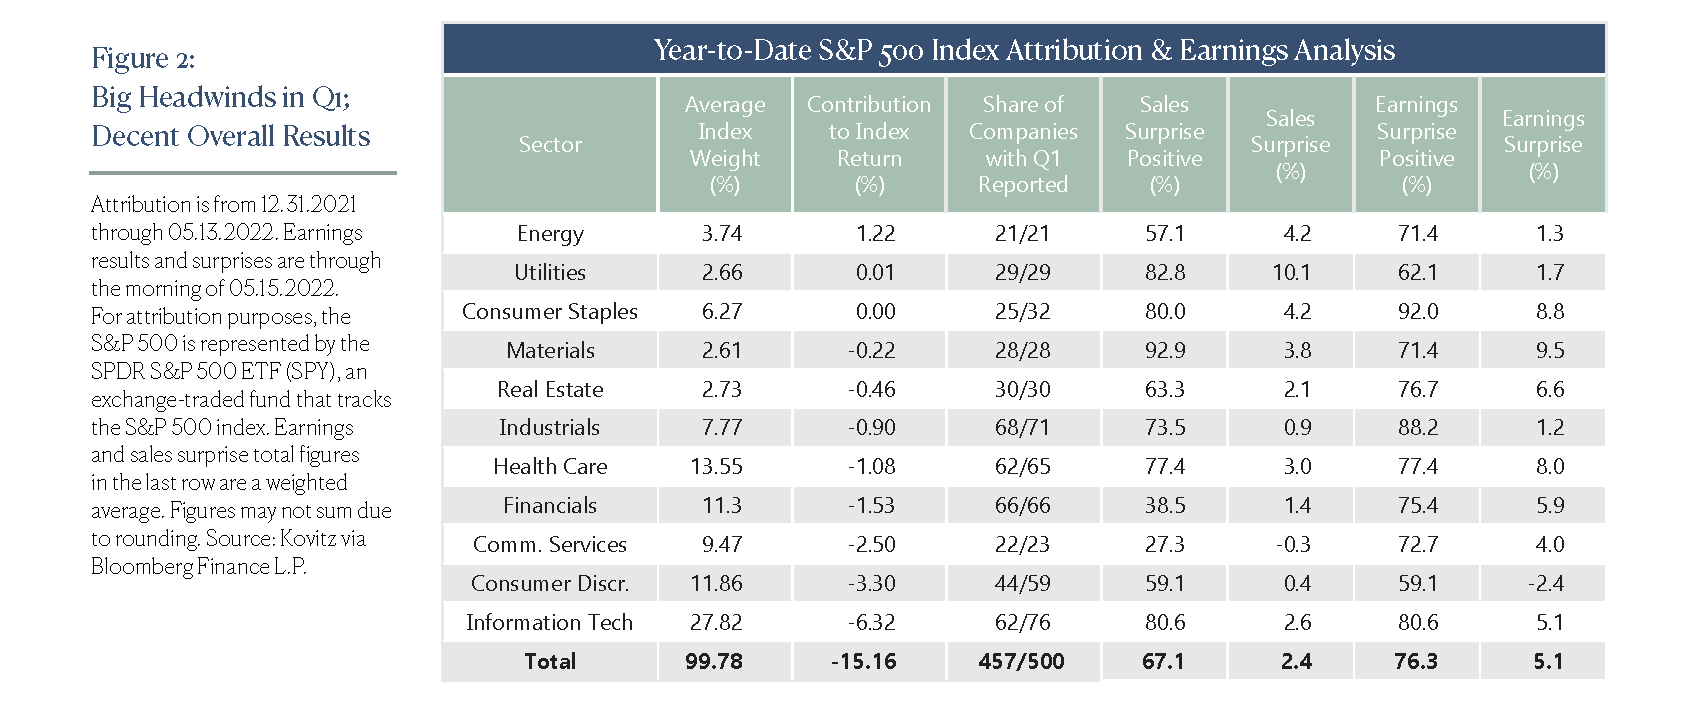
We disaggregate the S&P 500’s performance by company through the middle of May in Figure 1, while Figure 2 breaks performance down by sector. Soaring energy prices resulted in massive Energy sector profits, despite its small weight in the index. Consumer Staples ended the first four-plus months with breakeven performance, led by Coca-Cola and Phillip Morris Int’l. A substantial number of companies in the Info Tech sector with big weights and lackluster outlooks heavily detracted from performance. The rightmost five columns of Figure 2 show summary data for 457 of the 500 companies in the S&P 500 that have reported Q1 results. While management teams were cautious in their outlooks, we think the quarterly reports have been very good. Sales and earnings surprises averaged +2.4% and +5.1%, respectively, meaning companies tended to outperform analyst expectations. In addition, the “beat” rate has been higher than usual, and big price whacks for some companies leave us excited to go shopping for stocks on sale.
ANALYST ESTIMATES LOOK NEAR, NOT FAR
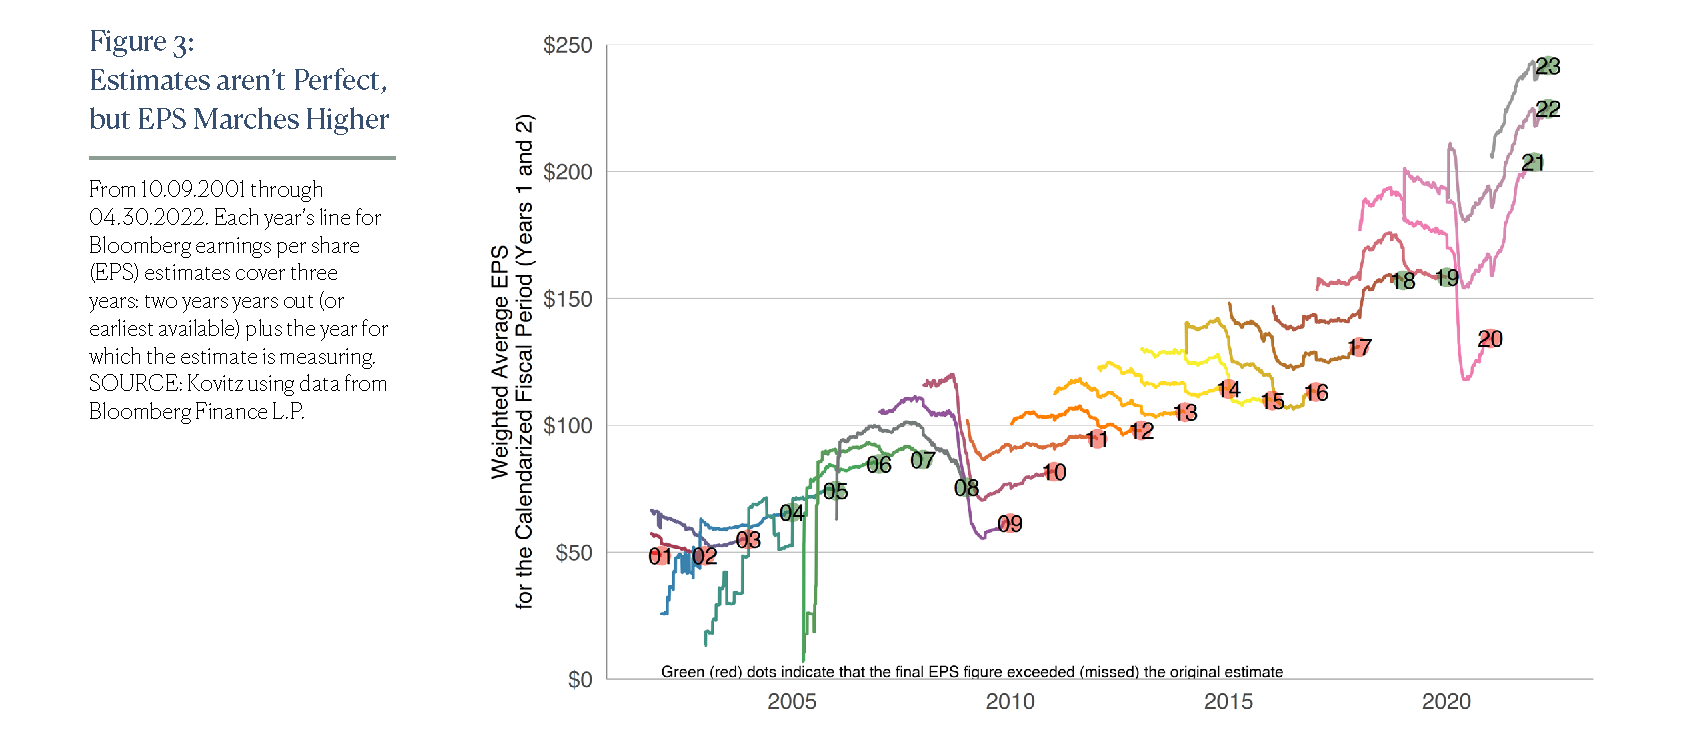
Bearing in mind that the average sell-side research report for external publication usually has a one-year (or shorter) price target (compared to our preferred target price estimates that look out 3-t0-5 years or more), S&P 500 earnings have climbed handsomely over the years, even if analyst consensus earnings projections miss the mark from time to time. And since Figure 3 shows it’s virtually impossible to consistently project near-term earnings for the S&P 500 index with precision, we suggest any assertion to the contrary should be met with a truckload of suspicion. For our wealth management and asset management clients, we prefer to lean heavily on the idea that long-term trends do a better job informing investment decisions for long-term investors. We suggest two take-home messages for Figure 3. The first is that group think (aka ‘consensus’) can be inaccurate, sometimes substantially so. Secondly, S&P earnings have risen dramatically over the most recent two decades, even though stocks always seem to be climbing a Wall of Worry. A near-term drop, even if it’s steep, shouldn’t scare any long-term investor.
TIME IN THE MARKET TRUMPS MARKET TIMING
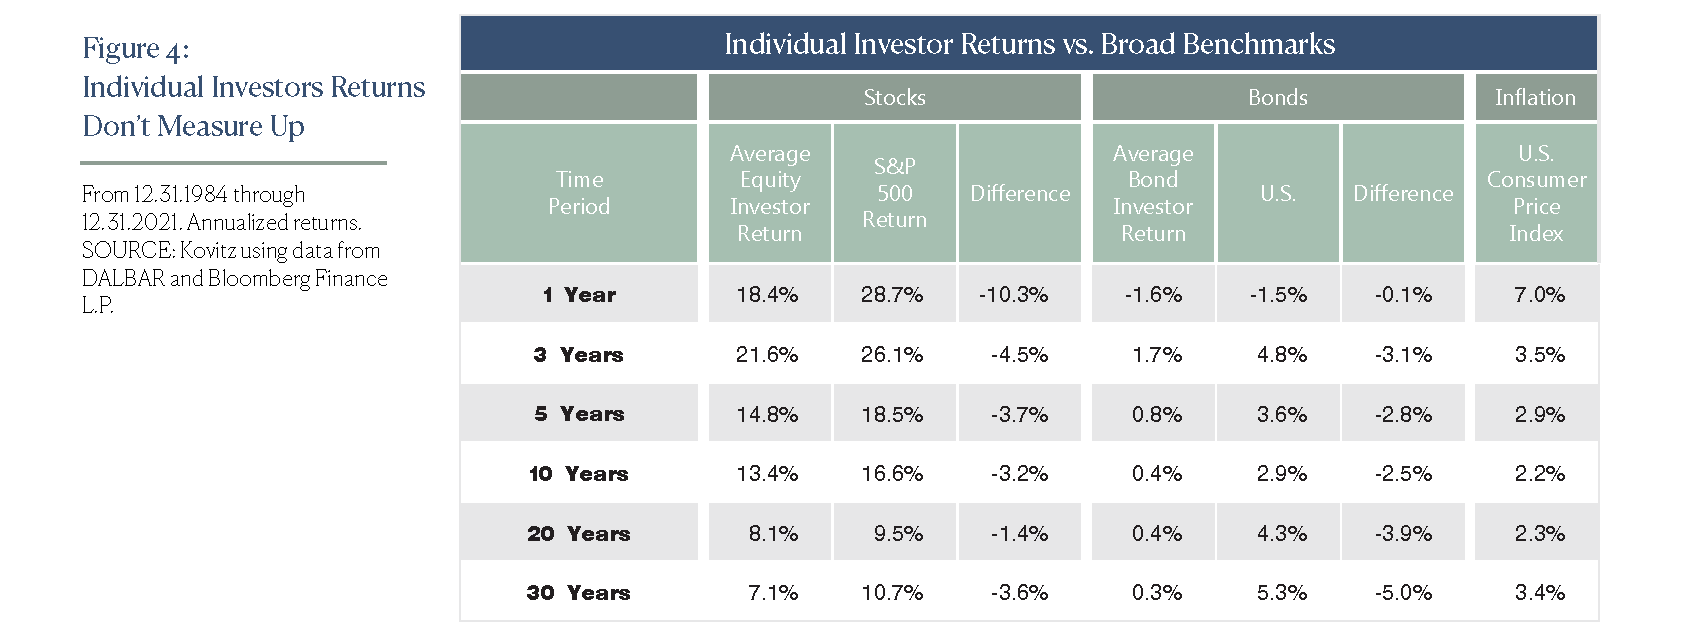
With the consensus often wrong on corporate profits, is it any wonder that investors have great difficulty timing their moves into and out of stocks? Unfortunately, folks must be right twice and the evidence, as shown in Figure 4, is convincing that far too many investors end up buying high and selling low, with this phenomenon including both stocks and bonds. Per data analytics firm DALBAR, equity fund investors had awful relative returns in 2021, gaining only 18.4% on average, compared to a 28.7% return for the S&P 500, for a whopping 1030 basis point (10.3%) difference in performance. The longer-term historical numbers are even worse for bonds as Fixed Income fund investors had an annual return 500 basis points lower than the U.S. Aggregate Bond index over the past three decades. No doubt, there is a reason that we like to say the only problem with market timing is getting the timing right!
DON’T SELL, MORTIMER!
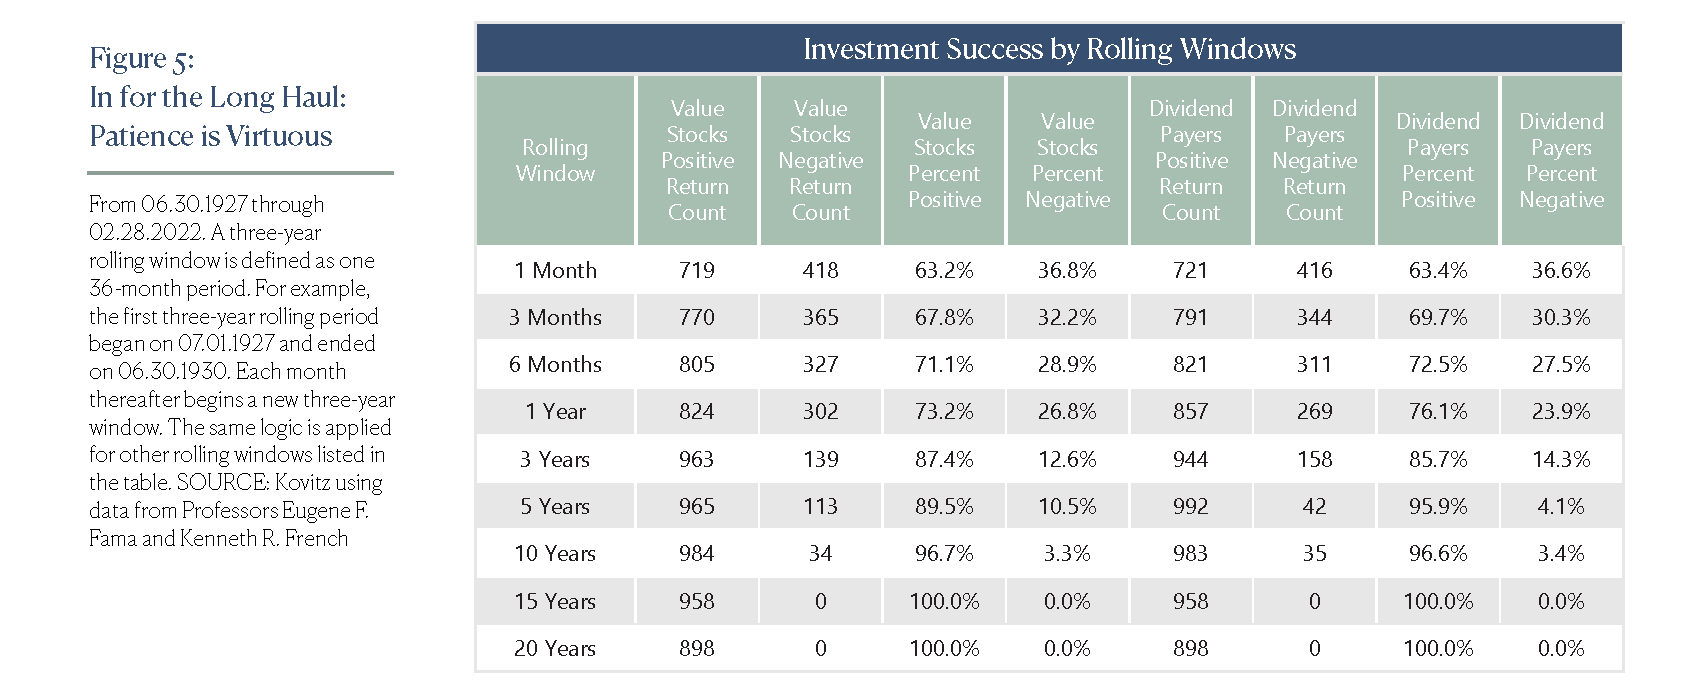
In the iconic 1983 Wall Street movie Trading Places, investor brothers Randolph and Mortimer Duke of Duke & Duke lost their entire fortune after wagering on short-term orange juice futures. The crop report upon which the brothers based their bets turned out to be fake, and the film’s heroes Billy Ray Valentine (played by Eddie Murphy) and Louis Winthorpe (played by Dan Aykroyd) made a fortune. Like the Duke’s orange juice contract debacle, we generally find short-term equity trading (which we would quantify as a year or less) to be deleterious to growing one’s wealth. And for those who retort that it worked for Mr. Valentine and Mr. Winthorpe, we should mention that their gains were actually ill-gotten, given their possession of illegal inside information.
Fortunately, as is shown in Figure 5, the odds of a positive return are strongly in the favor of long-term investors—those who hold for one month have a 63% chance of making money with Value stocks, but increase the holding period to 1 year and the odds of success rise to 73%, with 89% the profitability rate for five-year holding periods. Believe it or not, 100% of Value portfolio returns have been positive over any 15- or 20-year period since 1927 according to data from Professors Eugene Fama and Kenneth French. Needless to say, we believe the most reliable way to create or grow a fortune in equities is with a long time horizon, a solid framework to incorporate new thinking into allocation and investment decisions and the discipline to stick with a sound financial plan.
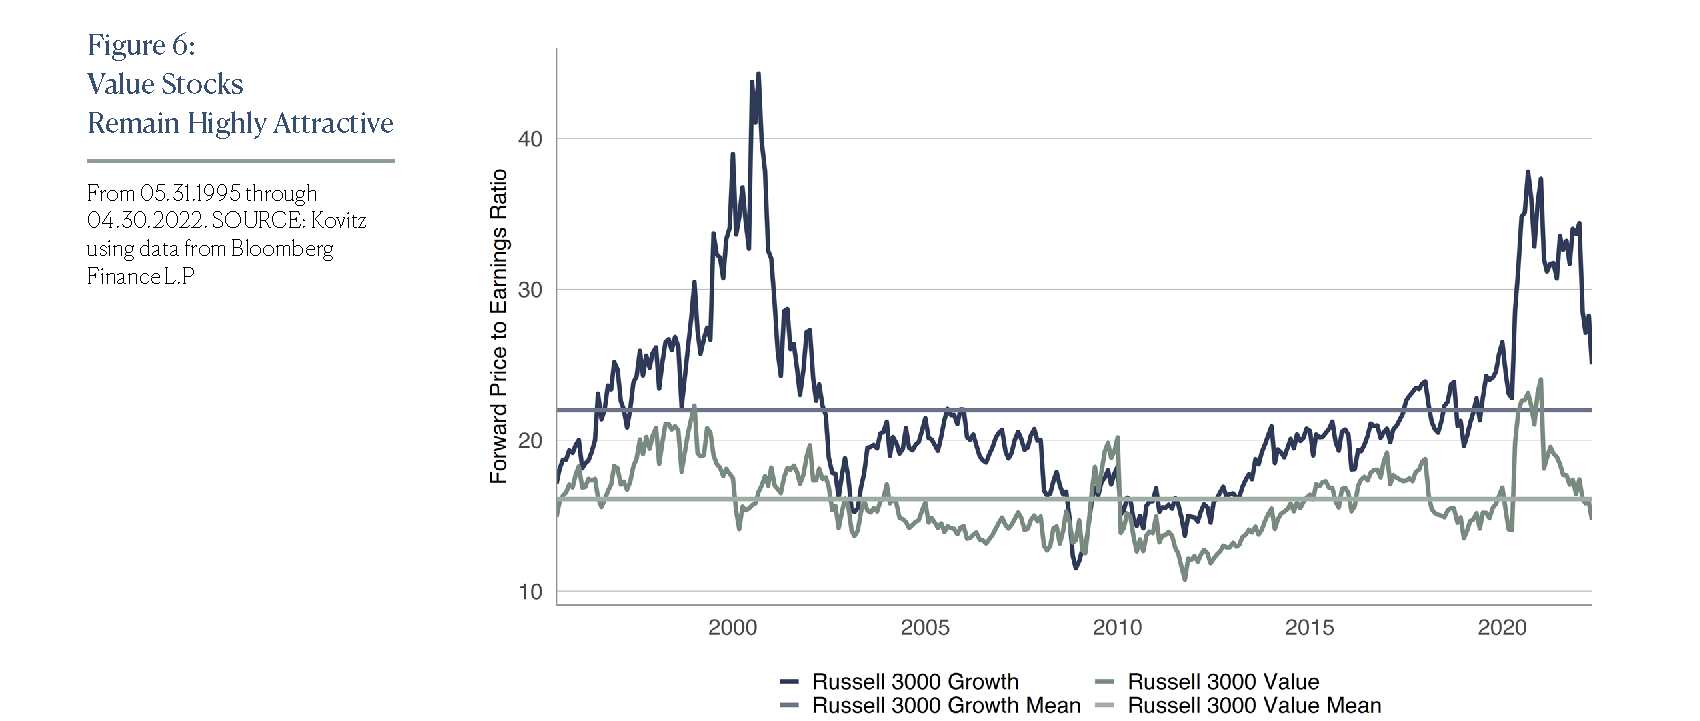
We understand the S&P 500’s drop this year might be disconcerting, but those who pay attention to equity valuations should take comfort (as shown in Figure 6) in the fact that Value stocks are today trading below their historical norm on an earnings basis, while their much more expensive Growth peers are trading above their historical average.
That does not mean that there won’t be more tough sledding in the near term, but we consider the stock market’s periodic ebbs to bring opportunity, while our steadfast commitment to Value investing over the last forty-five years remains the foundation of everything we do. Still, we have evolved over that time, adding arrows to the quiver and replacing pencil-and-paper valuation models with powerful quantitative capabilities.
Come what may, we remain confident that, as Warren Buffett states, “If a business does well, its stock will eventually follow.”
POSTSCRIPT
We know that not everyone possesses nerves of steel, so we think that there is great value in not going it alone, but instead working with a professional partner to assist in keeping one’s goals on track. Jason Clark and John Buckingham partner with clients, investing in a wide variety of strategies tailored for individual situations and taking into account factors like time horizon, risk tolerance and personal goals.
Kindly give Jason a ring at 949.424.1013 for more information on our wealth and asset management offerings, and note that all our investment professionals have significant assets invested in Kovitz strategies, which means that our interests align with those of our clients.
There’s More
We frequently publish market-oriented content on our Blog and reach thousands of subscribers each through our weekly Market Commentary and monthly Newsletter, which are available here.
Should you be interested in our Wealth Management services, please click here.
