Our Inflation 101B Special Report is available in Adobe pdf format by clicking here.
Although the increase in the Consumer Price Index in July was not as high as in June, inflation is front and center in the minds of economists, market watchers and everyday folks. U.S. inflation was ramping up towards the end of 2021 and soared subsequent to the onset of the Russo-Ukrainian War in February. The impact on the stability of European economies was immediate, effects of which destabilized prices and supplies of food, fuel and a host of consumer products. Certainly, price jumps have been noticeable, even as U.S. incomes have risen smartly (5.2% in July) on a nominal basis.
Established as a figure with tremendous impact on policy decisions, consumer behavior and business operating costs, it is less clear in simple terms what “inflation” is actually measuring. In fact, there are two primary gauges of inflation, often used interchangeably despite having different calculation models. Yes, the headline figures generally end up in the same ballpark (which explains some of the interchangeability), but the underlying measurements frequently have wide dispersion.
Consumer price index
The U.S. Bureau of Labor Statistics (BLS) defines the Consumer Price Index (CPI-U or CPI) as “a measure of the average change over time in the prices paid by urban consumers for a market basket of consumer goods and services.” The basket of goods and services evolves over time; the goal is to provide an accurate reflection of consumer spending habits. The latest rejiggering occurred in 2020, using data from 2017 and 2018, which studied 24,000 consumers over the two years, using weekly diaries and quarterly interviews to determine each category’s weight in the final CPI figure.
The Bureau’s process to determine which goods and services to price is based upon a probability-weighted selection of the most popular version of an item. With a specific item determined, it is priced on a monthly or bimonthly basis for four years. A wide variety of types and brands are selected, such that the price reporting can take place across the United States.
With basket components and specific sample items set, the BLS uses U.S. Census data to determine urban areas, then statisticians assign certain items to be priced at specific retail outlets based on samples from the spending habit surveys. The weights are allowed to vary by region based on consumer survey preferences and are a combination of “geographic areas, retail establishments, commodities and services.”
An Alternative
Personal Consumption Expenditures (PCE) is the Federal Reserve Board’s preferred method for tabulating inflation. The figure is calculated by the Bureau of Economic Analysis (BEA). In addition to tracking purchases of new goods and services, PCE includes purchases from the government and for employer-paid items such as health care, life insurance and pension plans. PCE sometimes uses derived values to mitigate noise arising from the way something is carried out, such as rented housing vs. owned or cash payments vs. in-kind transactions.
Three broad categories make up PCE: durable goods (average useful life greater than 3 years), non-durable goods (average useful life less than 3 years) and services (products that cannot be stored or inventoried such as medical care). Periodic estimate data are adjusted for coverage and timing, and are sourced from the Census Bureau, BEA, BLS, Treasury Department and Agriculture Department. To estimate quantities of items purchased, the BEA uses deflation (the statistical technique of taking the current-dollar value of a given component and dividing it by an appropriate price index), quantity extrapolation or direct valuation methods.
Special estimates are a unique feature of PCE and are required to accurately estimate inflation components that are difficult to measure. Key components receiving special attention include purchases of new vehicles (unit sales estimates are provided by R.L. Polk & Co or Wards Intelligence and expenditures are provided by J.D. Power & Associates), gasoline (quantity of fuel purchased for personal use multiplied by the average retail price per gallon for several fuel types), and rental of tenant- and owner-occupied housing (rent paid data is sourced from the American Community Survey and estimates of rent are derived using a rental equivalence approach).
Inflation Comes in Several Flavors
In addition to a vast quantity of in-the-weeds tables accompanying inflation press releases each month, CPI-U and PCE come in two flavors. The first is core, which strips out more volatile food and energy factors from the measurement. Core inflation tends to be more stable, but we think it doesn’t always reflect the true impact of price level changes being felt by consumers. The second measure, headline, includes everything in the core inflation figure plus food and energy price changes.
In Figure 1, we chart the two versions of PCE and CPI over the past 30 years. Headline CPI-U averaged 2.42%, while the core figure’s average was 0.13% lower. On the PCE side, the headline figure averaged 1.98%, while the core’s average was 0.08% lower. The darker lines are headline numbers, which in most circumstances are highly correlated with each other. Core inflation, plotted in lighter colors has also exhibited roughly half the volatility (standard deviation) of headline inflation over the past three decades.
Disaggregated
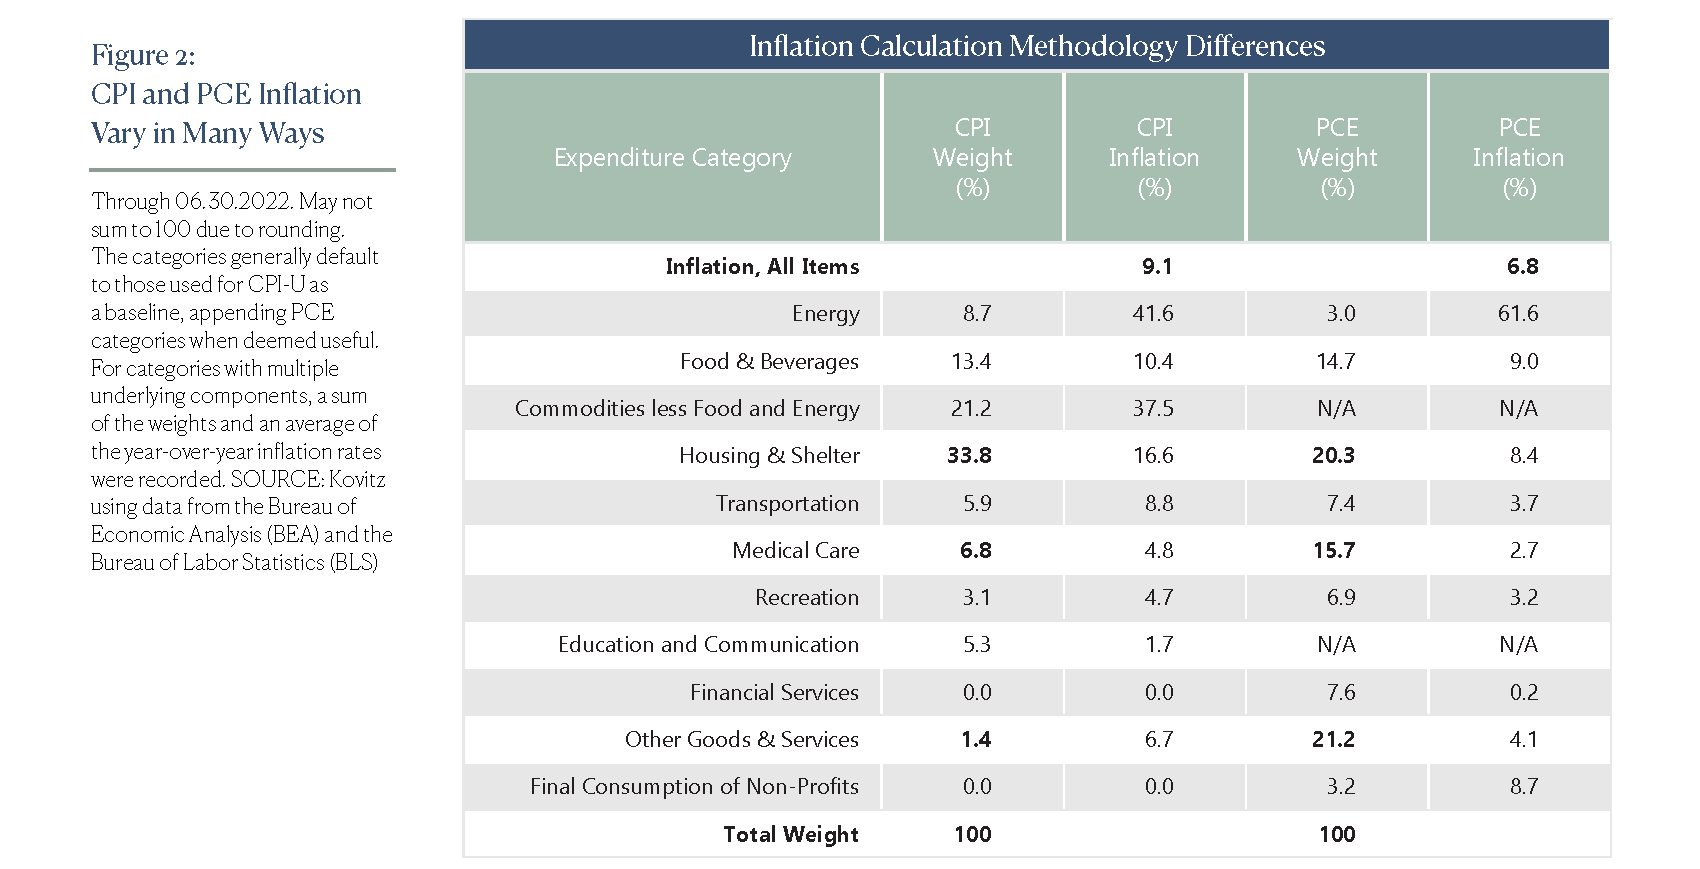
We disaggregate June’s inflation reports in Figure 2 by major category (July’s PCE was not yet available as we went to press). The first and third columns are the estimated weights in the inflation index, while the second and fourth columns are year-over-year change in price. Even though we think it takes little away from the overall message, we note CPI and PCE use different categories, resulting in a fair amount of leeway required on our part to bring the table together.
The calculation of each inflation component basket differs between CPI and PCE, but we think the more consequential difference relates to the weights. CPI-U calculates the impact of inflation using a heavy weight in Housing & Shelter, as well as Energy, while PCE is lighter in those two categories and heavier in Medical Care, Financial Services and Recreation.
Does Inflation Impact Me?
Whether presented as CPI-U, PCE or any derivative thereof, we think broad inflation measures may not reflect one’s personal experience. We think it’s fairly straightforward to calculate price changes in airline tickets, energy costs and food. However, infrequent transactions for major purchases like housing or auto sales means that the category’s inflation figure can be a bit dodgy, and it can also have zero impact (or a major impact).
A household that purchased a new car in Q2-2022 and bought a new house is likely to feel massive year-over-year cost increases, while a household that skipped those transactions and has a fixed-rate mortgage should feel little inflationary pressure. Individual considerations vary widely and are not strictly related to large purchases.
The rising popularity of working from home could potentially lower the inflation bite for those afforded a flexible work setup. The decline in fuel usage for that cohort could potentially be offset by others’ desire to get back on the road after being cooped up during the pandemic, thereby raising the inflation bite for those putting more miles on their vehicles. We understand individual circumstances vary widely and think nationwide inflation reports (whether 9.1% for June CPI-U inflation or 6.8% for June PCE inflation) can be useful for broad policy decisions, but do poorly to help individuals understand changes to their monthly expenditures.
Input Prices
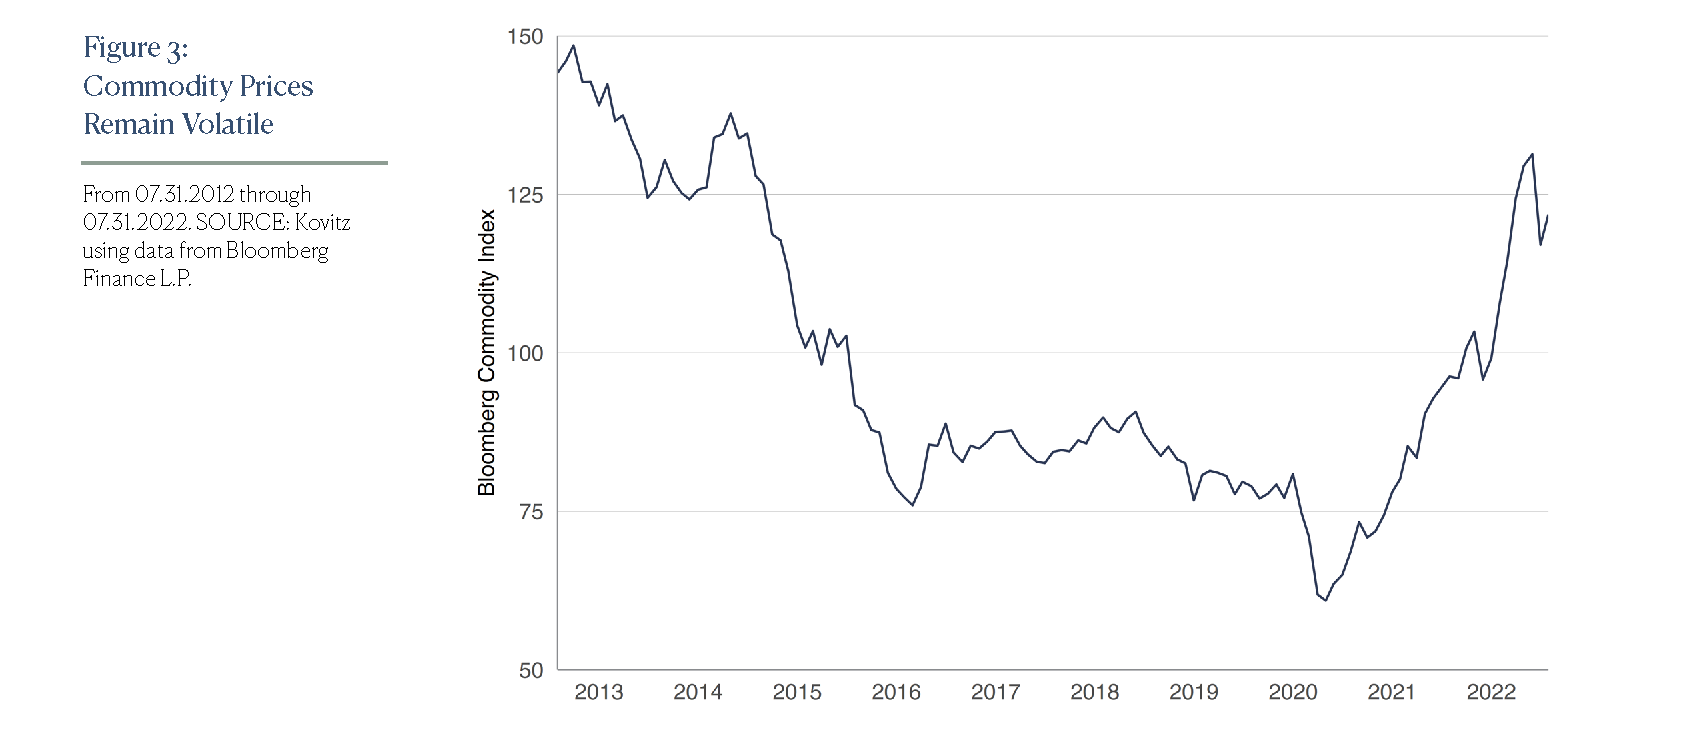
While it hasn’t returned all the way to earth, the Bloomberg Commodities (BCOM) index, shown in Figure 3, has pulled back recently. The broadly diversified index includes a 40% weight in Energy (including 20% oil, 15% natural gas and 5% fuel), 29% in Metals (13% gold, 4% copper), 21% in Grains (11% soybeans and 5% corn), 5% in Soft Commodities (2% sugar and 2% coffee) and 5% in Livestock (3% cattle, 2% hogs). No doubt, June and July were volatile months for commodities.
Natural gas futures averaged $7.62 per 10,000 MMBtu during June but traded for $8.23 at the end of July. West Texas intermediate crude averaged $114.35 per barrel and was $99 at the end of July. Soybeans and corn averaged $1690 and $758 per 5,000 bushels in June and ended last month at $1637 and $616, respectively.
We think it’s important to note that many commodities in the BCOM index don’t show up directly in inflation reports, but underlying commodity prices have a significant impact in the manufacturing sector where closely watched economic barometers are published by the Institute for Supply Management (ISM).
Up Sharply, Then Down
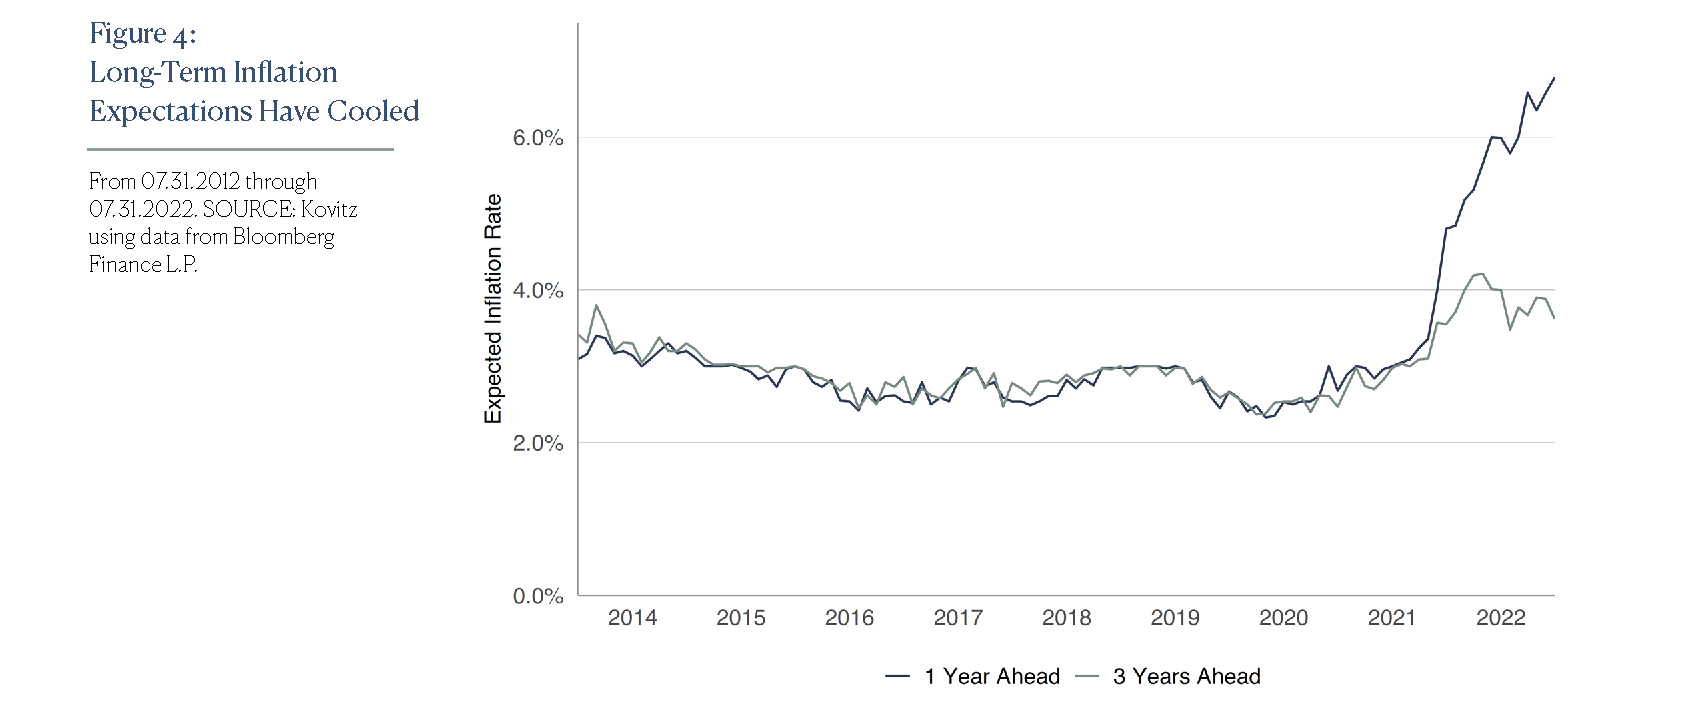
It’s not wrong to be concerned about inflation. On June 15, Fed Chair Jerome Powell fielded a question on its persistence, “I think if you look across that broad range of data, what you see is that expectations are still in the place, very much in the place, where short-term inflation is going to be high but comes down sharply over the next couple of years…We’re absolutely determined to keep [inflation expectations] anchored at 2 percent.” Consistent with Mr. Powell’s comments, Figure 4 shows a wide gap between near-term inflation expectations (navy line) and longer-term expectations (green line).
It’s impossible to accurately predict the direction of inflation, especially considering that components of the measurements frequently head in opposite directions. We continue to like our broadly diversified portfolios of value-oriented stocks, which have historically been a good inflation hedge and we think long-term inflation expectations are still relatively well-anchored to the lower end with Fed comments and actions aligned to reduce inflation. Fortunately, markets seem to believe the Fed is serious about not letting high CPI or PCE persist for too long.
What about stocks?
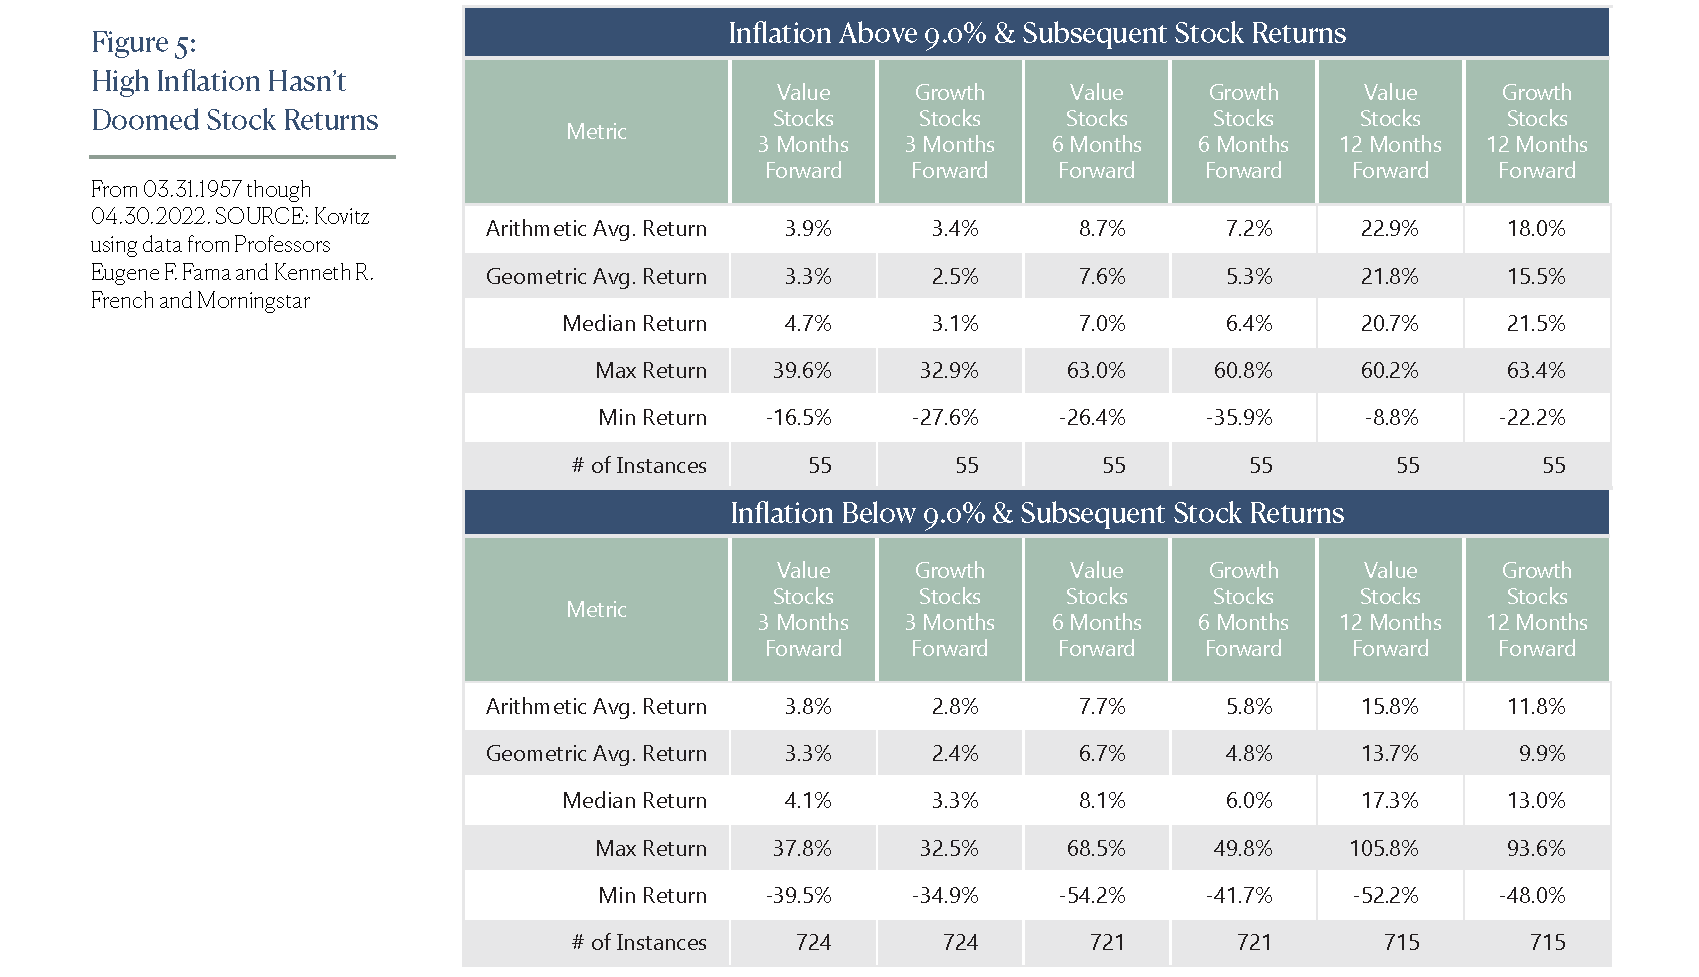
“Fear cannot be banished, but it can be calm and without panic; it can be mitigated by reason and evaluation.” This favored Vannevar Bush quote seems especially apt these days, with the media fixated on and pundits fretting about weak economic numbers, signs of recession and sky-high inflation readings. We respect these can be serious headwinds for corporate profits, but running the historical return numbers for inflation and subsequent returns (Figure 5) shows little reason for folks to be selling stocks today. In fact, there seems to be support for adding to equity exposure, particularly for those in the fundamental Value camp.
Speaking of fundamental value, the S&P 500 Pure Value Index (SPXPV) is defined by S&P Dow Jones Indices as a style-concentrated index designed to track the performance of stocks that exhibit the strongest value characteristics by using a style-attractiveness-weighting scheme. Not surprisingly, given what has transpired during previous bouts of high inflation, the SPXPV has been the best performing equity index in 2022, with its total return as of this writing exceeding that of the market benchmark S&P 500 by more than 10 full percentage points, or more than 1000 basis points.
Ten Stock Picks for an Inflationary Environment
For those interested in stocks with the strongest value characteristics, we have more than a few recommendations in The Prudent Speculator that reside in the S&P 500 Pure Value index. Ten of these names include:
- Communication Services stocks like advertising concern Omnicom Group (OMC) and telecom titan Verizon Communications (VZ)
- Consumer Staples stocks like agricultural giant Archer-Daniels-Midland (ADM) and protein producer Tyson Foods (TSN)
- Financial stocks like regional bank Citizens Financial Group (CFG) and insurer Prudential Financial (PRU)
- Health Care stocks like drug distributor Cardinal Health (CAH) and integrated pharmacy concern CVS Health (CVS)
- High-Yielding stocks like energy behemoth Exxon Mobil (XOM) and Arizona utility Pinnacle West Capital (PNW)
Learn More:
We frequently publish investment-oriented content on our Blog and reach thousands of subscribers through our weekly Market Commentary and monthly Newsletter. Please click here for subscription information.
For more details about our wealth management and asset management services, kindly fill out this Contact Us form and we’ll reach out to you shortly.