
The Dow Jones Industrial Average briefly crossed the 40,000 level on May 16, a record level for the benchmark index. Within minutes of hitting the milestone, financial news outlets were pumping out articles with reasons to be jubilant (rather than fearful) about stock investing. Investors might be accused of having short memories, but we wonder what to make of the sudden about face. Barron’s ran an article just six days earlier with the headline “Dow 40,000 Is So Close, You Can Feel It. Here’s Why You Should Fear It.” and a CFRA Research strategist explained to Forbes Advisor that “investors should brace themselves for potential profit taking.”
RECORDS ARE SET OFTEN
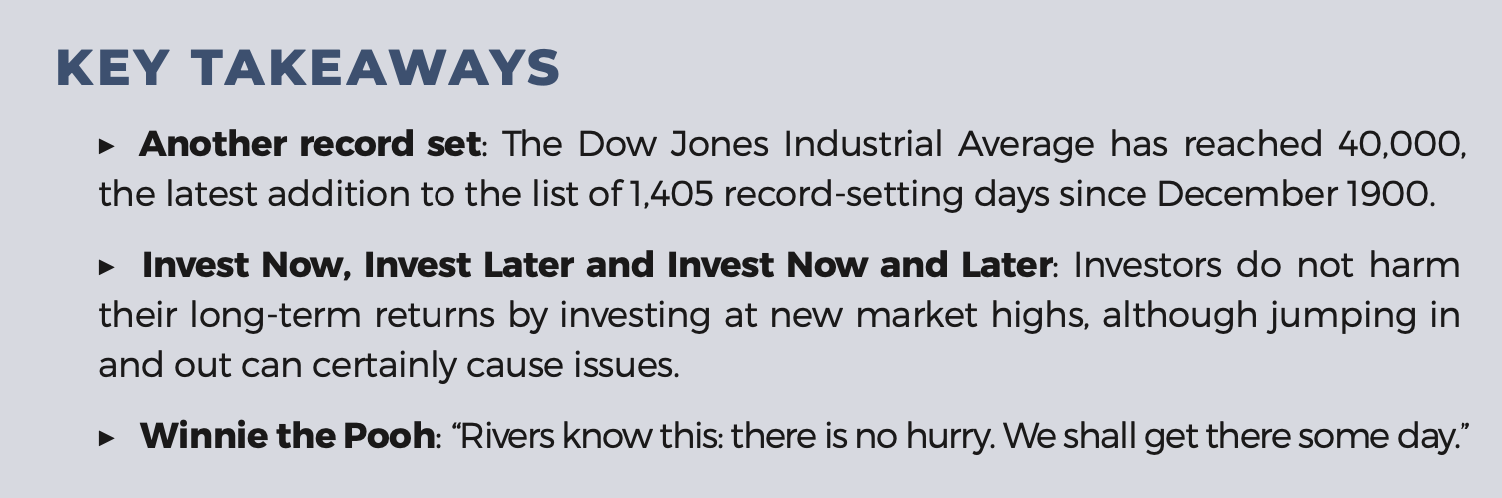
Crossing the 40,000 mark was new, but not novel. Over the last 122 years, the Dow Jones Industrial Average has notched an all-time high every decade except one (the 1940’s). Remarkably, 227 peaks have already been set this decade, trailing the 258-peak record set in the 1960’s, plus there are five and a half years left to add to the tally. As Figure 1 shows, bailing on stocks simply because “the market is at a high” is an unwise choice for portfolios that seek long-term appreciation, not to mention there are dings from tax and trading consequences that come with short-term churn.
Invest now. Invest later. Invest now and Later.
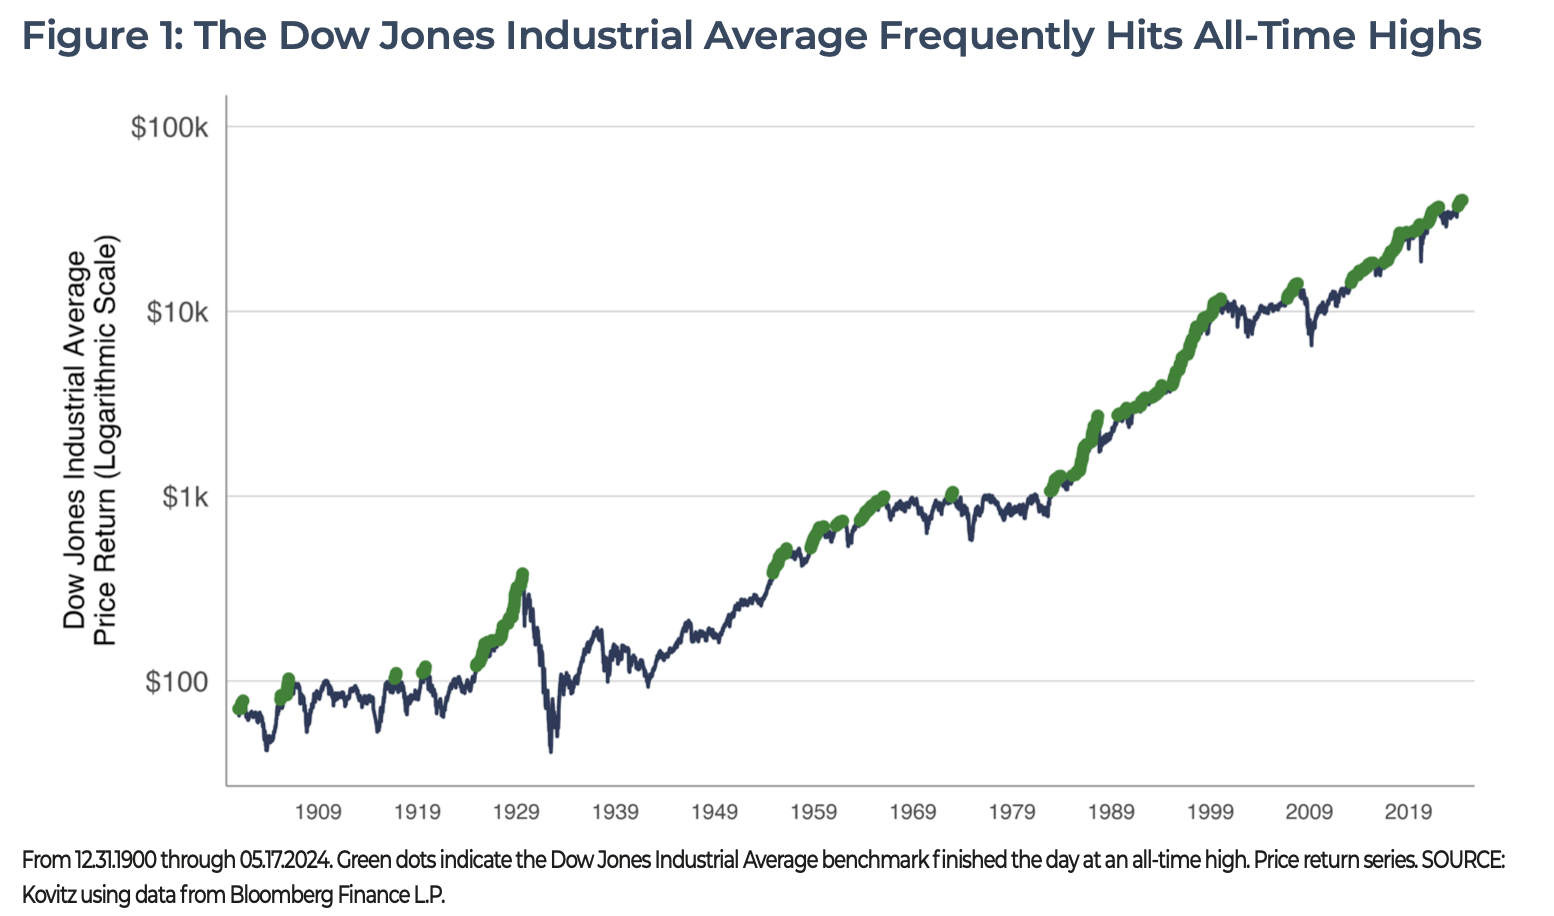
We’ll even go a step further and argue that it’s a great time to buy stocks at record highs. It’s also a great time to buy stocks when they’re not at a high. In Figure 2, we crunch subsequent return figures for the Dow Jones Industrial Average and find that timing stock purchases based on a particular index level does little to impair returns. The Dow hit a peak on 1,405 trading days since 1900, which is about one peak every 21 trading days (although we note that peaks tend to be clumped together).
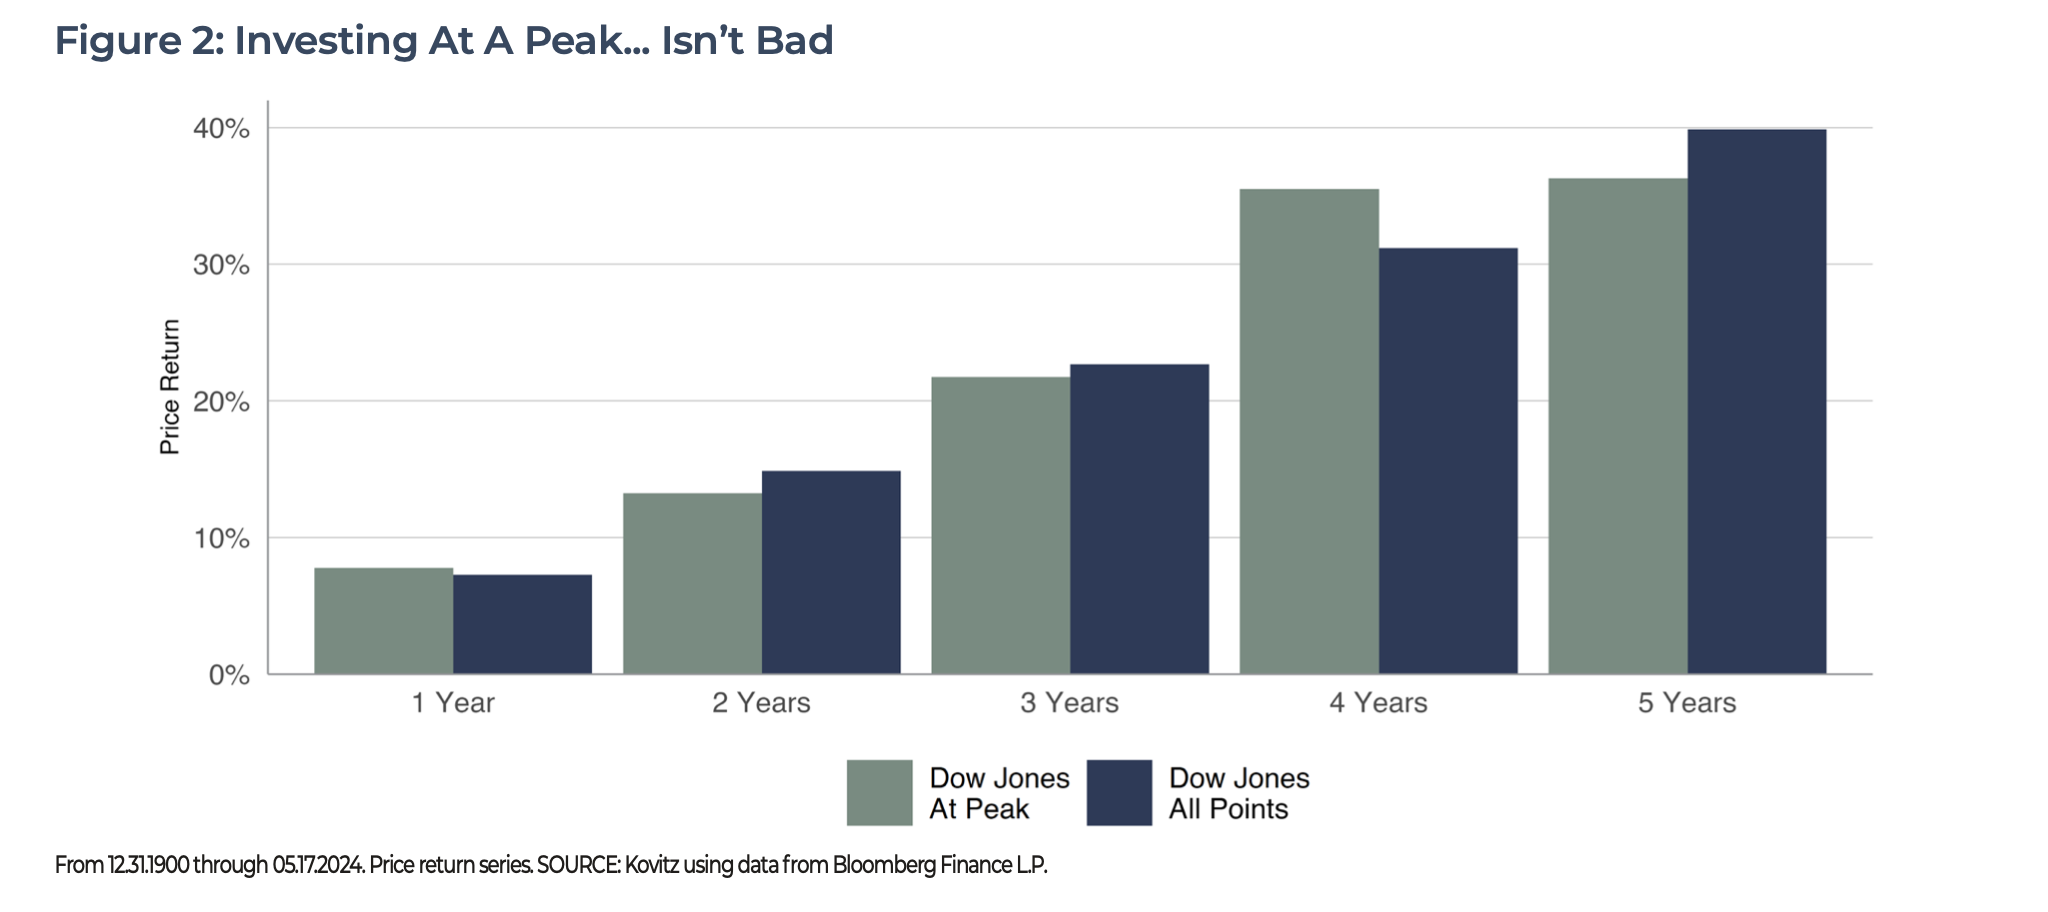
To demonstrate that we weren’t mining data for a specific outcome, we reran the Figure 2 analysis with S&P 500 index data and offer the results in Figure 3. The outcome is generally similar, though the shorter time horizon (97 years versus 122 years) and whacking of the early 20th century does result in slightly higher average returns. Additionally, the S&P 500 is more diversified (but still not as diversified as we’d like for a broad-market benchmark) and neither the S&P 500, nor the Dow Jones returns for Figures 1 through 3 include dividends, which add something like 2% to 3% to an investor’s annual return.
STRIKING IT RICH AND GETTING RICHER
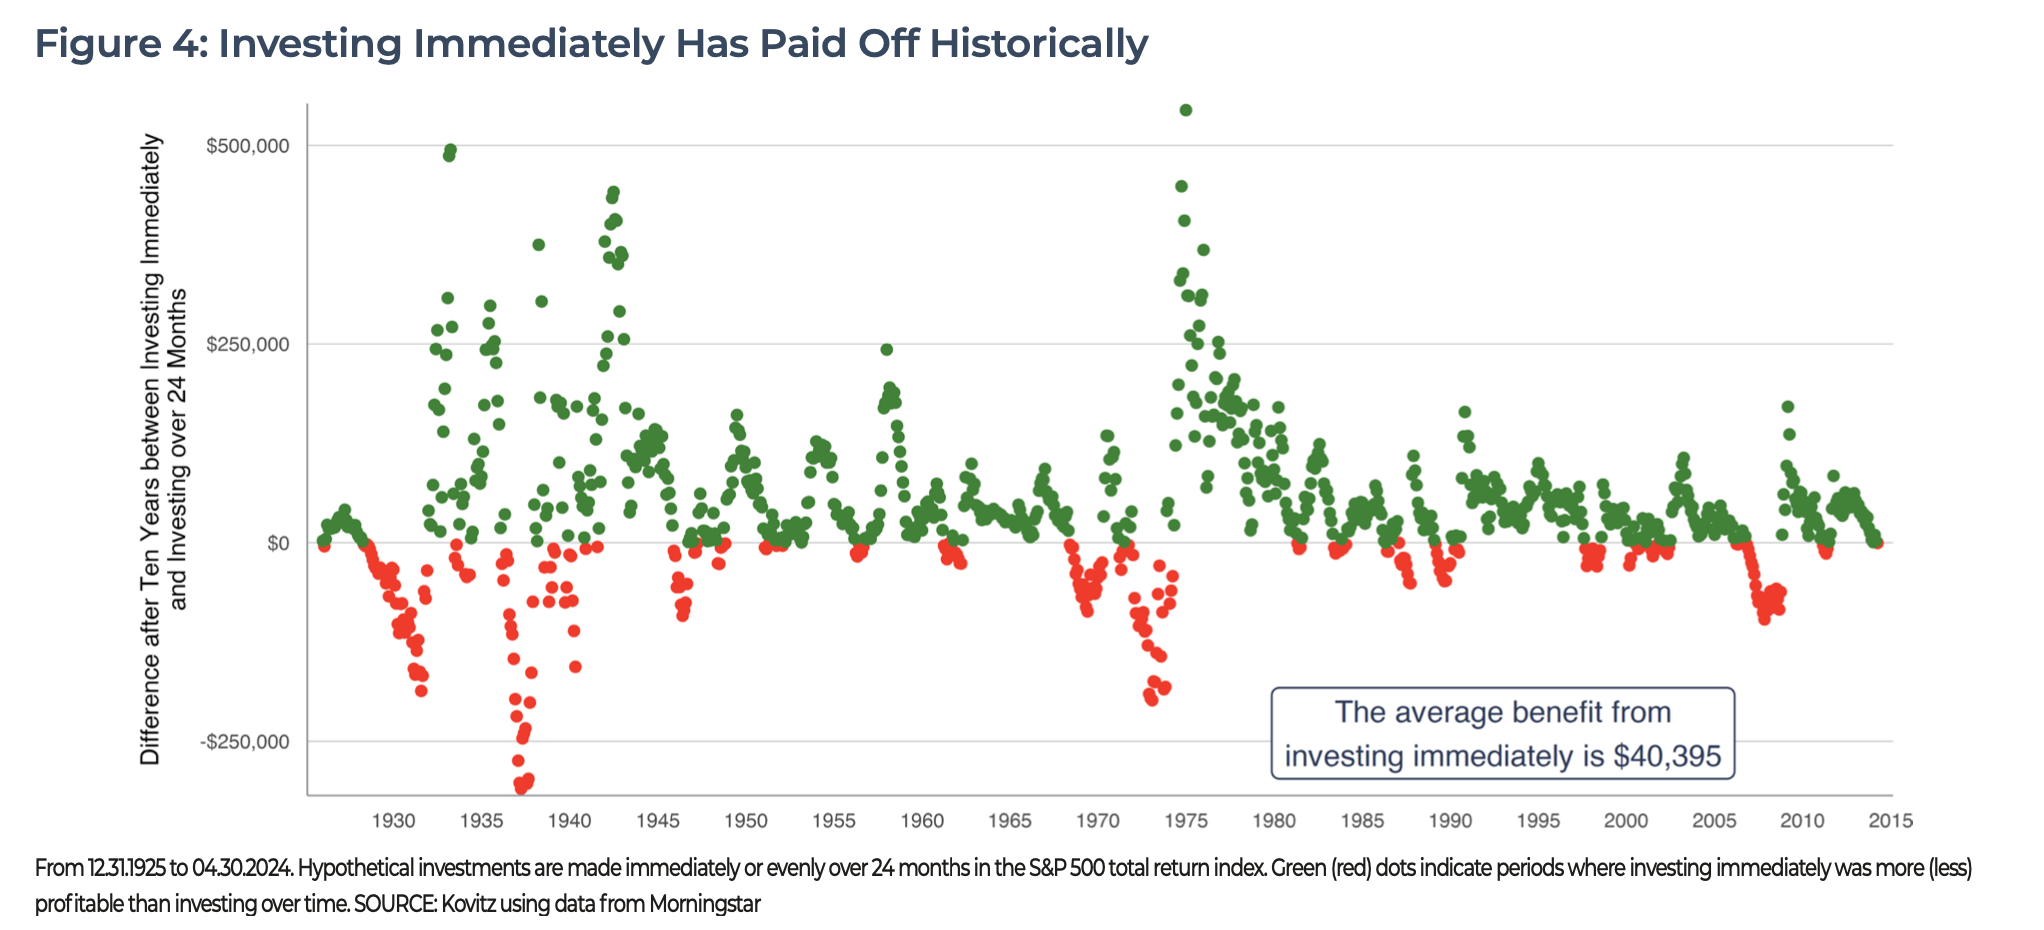
We have previously discussed dollar cost averaging, saving for the future and withdrawal rates, but it’s been a long time since we have discussed financial windfalls. Whether a result of winning the lottery or the untimely demise of a wealthy uncle, the surprise invariably causes one to wonder what to do with their newfound fortune. Of course, we suggest invest! The next question is whether it’s worthwhile to put all of the money to work right away or invest it over time.
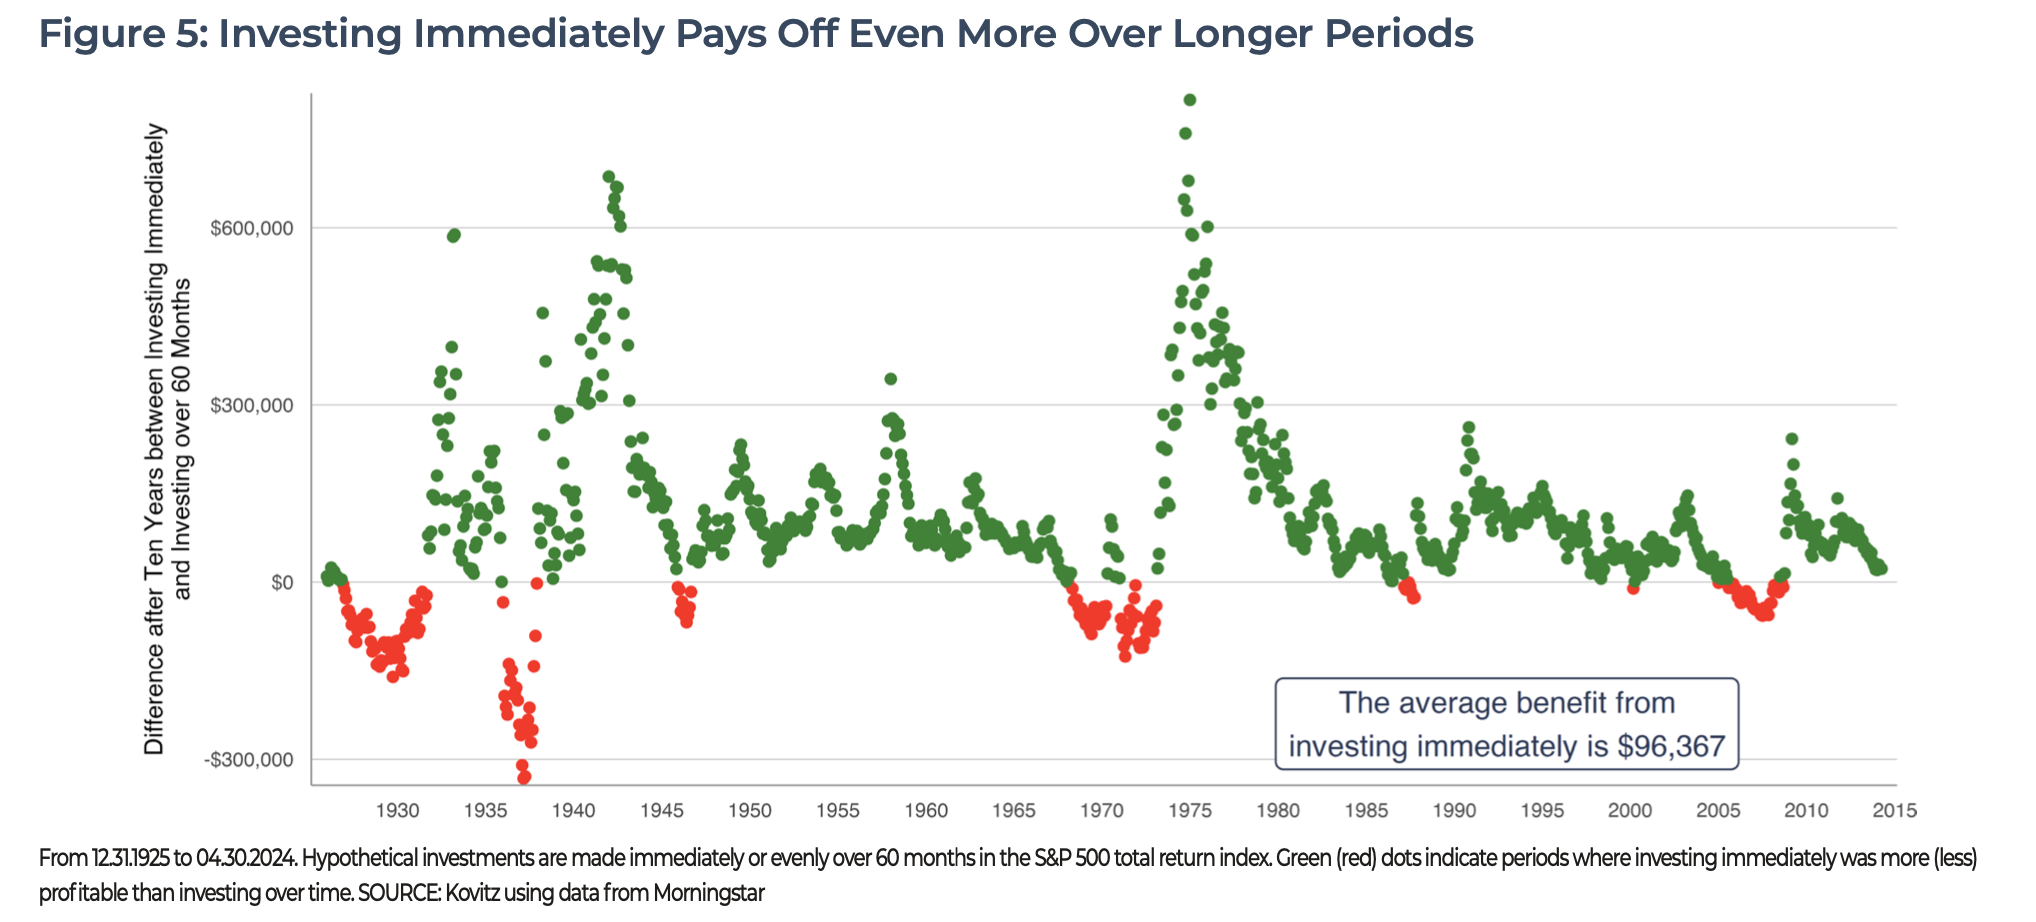
We ‘gave’ our hypothetical investor $100,000 and a choice: invest the full amount immediately or invest in equal portions over two years ($4,166 per month). The funds were invested for a total of ten years from the date of the windfall and the ending value difference between the two choices is plotted in Figure 4. Approximately 75% of the time, the immediately invested portfolio outperformed the legged-in portfolio. The average advantage earned by investing the full sum immediately was $40,395. To make sure we weren’t getting lucky with the two-year investment period, we shortened the window to invest the cash to 12 months, which yielded an average return gap of $18,450. The five-year window widened to a $96,367 difference.
MILESTONE INVESTING
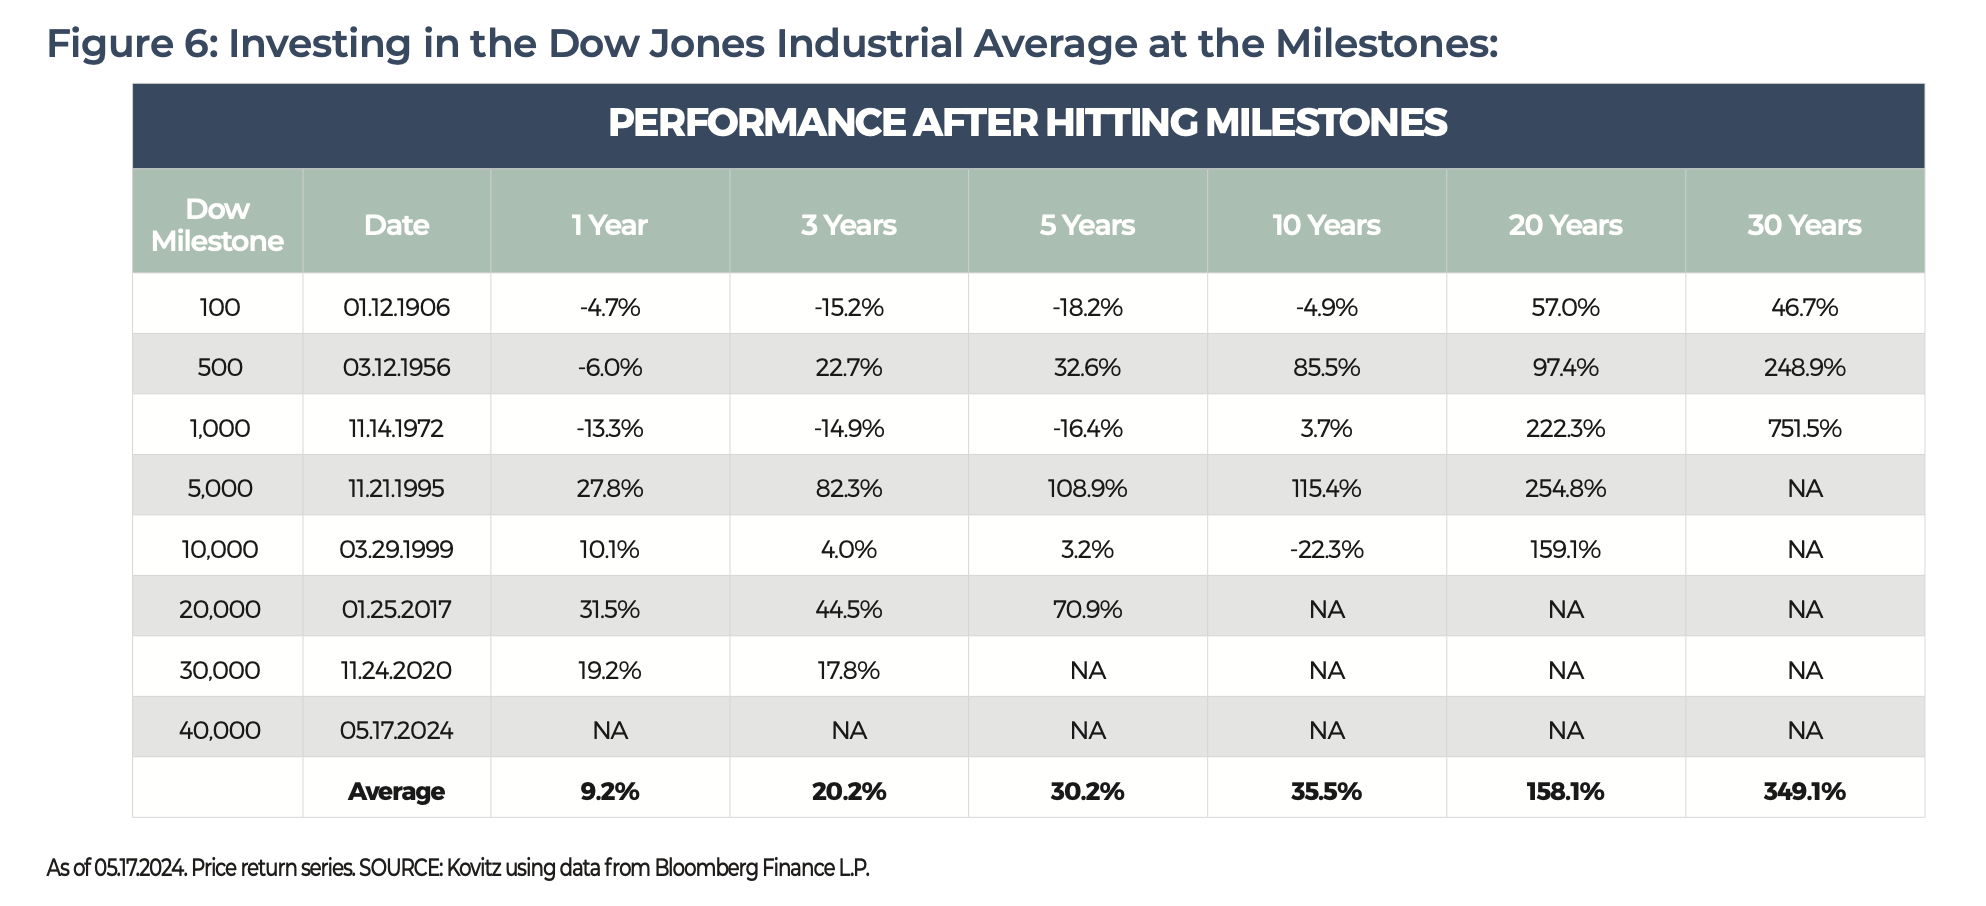
In Figure 6, we calculated subsequent returns for the Dow Jones Industrial Average based on investments made when the index hit certain milestones. The Dow took 50 years to grow from 100 to 500, while the jump from 500 to 5,000 took 39 years. Of course, it’s impossible to know how long it will take to hit the 50,000 mark, but we are just 29 years down the road from the 5,000 point level and the long-term average price return of 5.9% (since 1927, excluding dividends) puts the benchmark index on pace to hit 50,000 less than 5 years from now. The Dow’s returns after hitting major milestones are generally sizable, especially those over 20 and 30 years, meaning that staying on the sidelines simply because some index is at a record is not a money-making strategy, at least if market history is any indication.
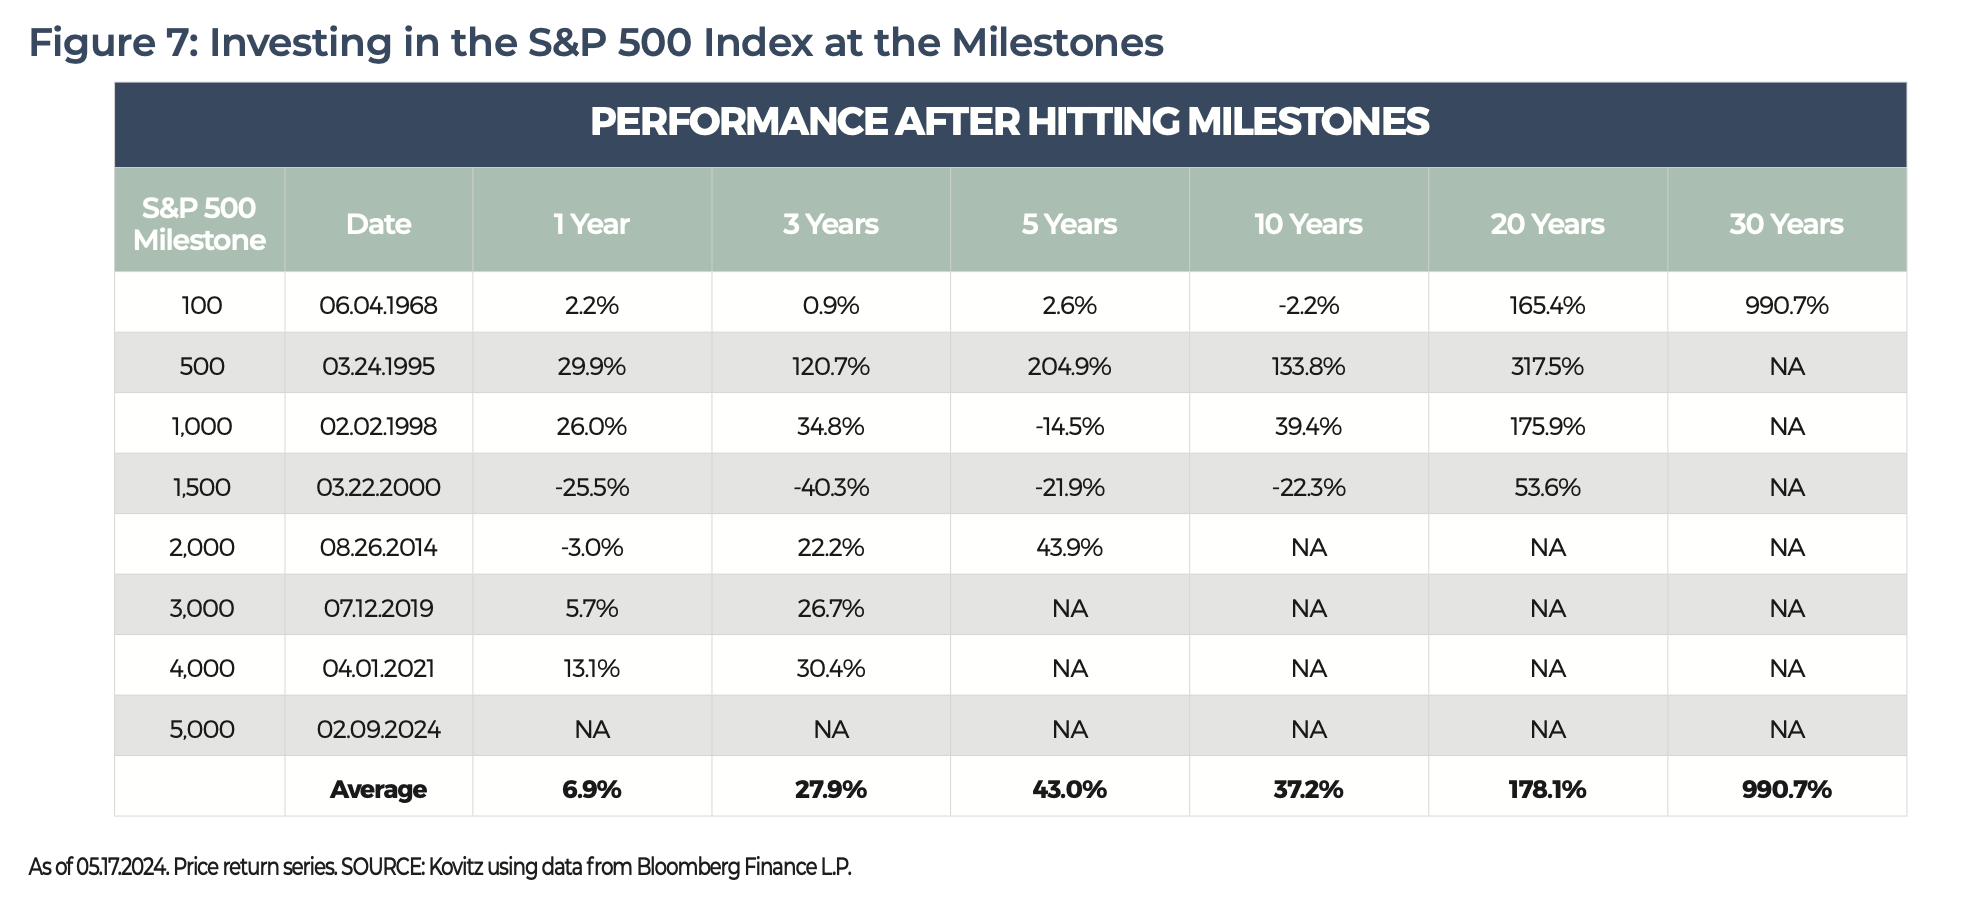
We perform the same number-crunching in Figure 7 but use the large-cap S&P 500 index instead. The story is broadly similar, though it is a bit easier to see the impact of the Tech Bubble bursting in 2000 and the COVID-19 pandemic. Still, the negative impact from those events did little to derail long-term investor returns.
INVESTING BY DECADE
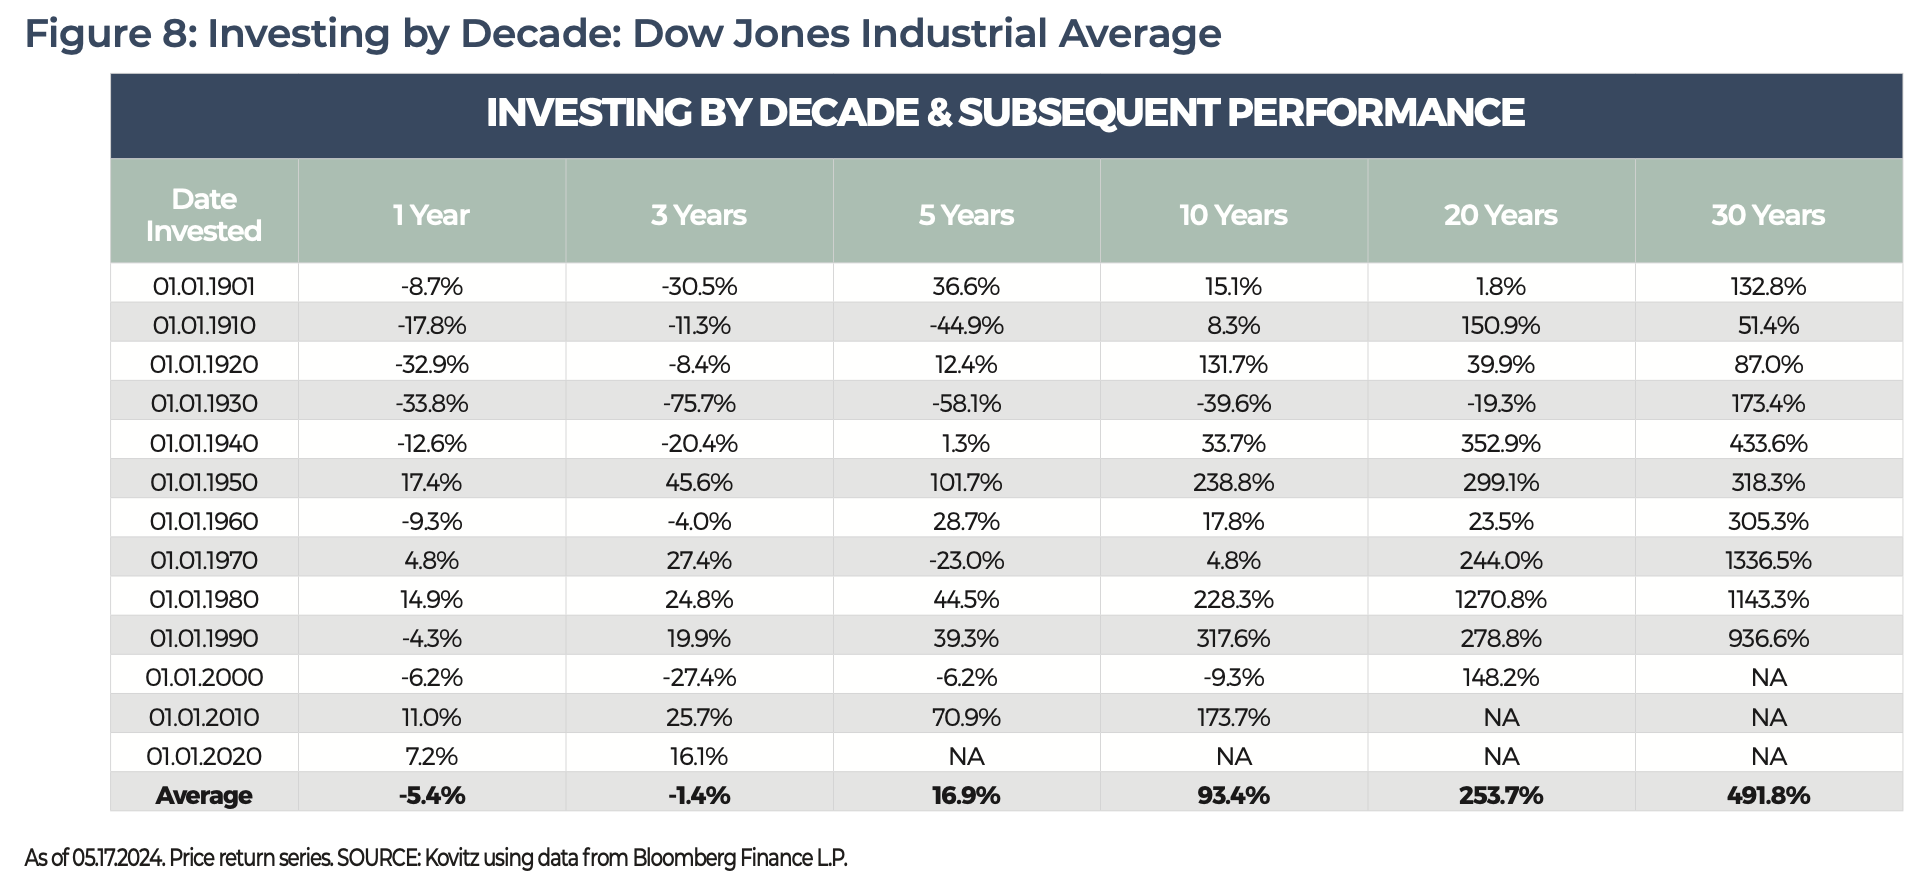
Perhaps investors who are concerned about investing at various market peaks prefer to invest in one lump sum every ten years, staying on the sidelines until New Year’s Day of the new decade. At face value, the strategy seems to work, as Figure 8 shows for the Dow Jones Industrial Average. The index’s returns are hit-or-miss in the near team (7 of 13 one-year returns are negative and have an average decline of 5.4%), but there a sizable ramp in the success ratio as the time window expands. The average return at the end of each decade is a handsome 93.4% and subsequent 20-year returns average a whopping 264.2%. Perhaps we should update the market adage Sell in May and Go Away! to Buy Stocks Every Decade and Let Them Run!
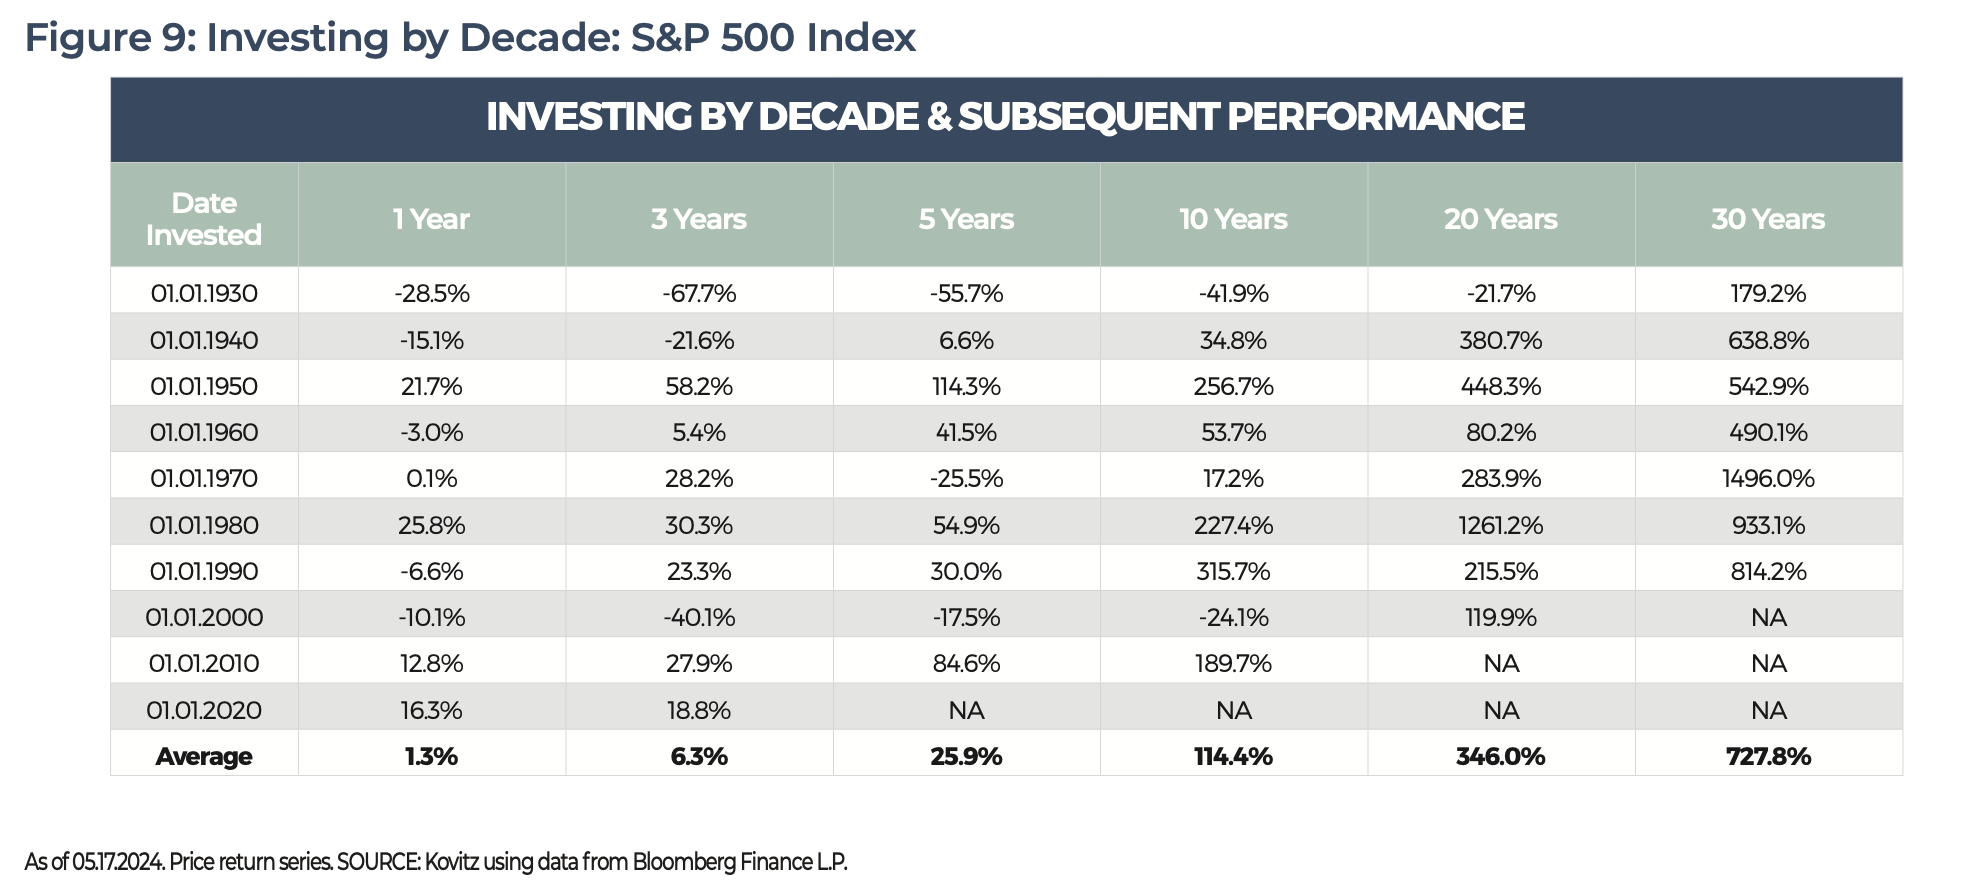
The S&P 500 index doesn’t do much better in the short run, with 5 of 10 one-year returns in negative territory, although the average return is just barely positive, which we consider a modest victory. Ten years out, the index’s average price return is even better, coming in at 114.4%. S&P 500 investors will be even happier with their returns 20 years out given the average return is massive 346%.
A BEAR MARKET WILL EVENTUALLY ARRIVE
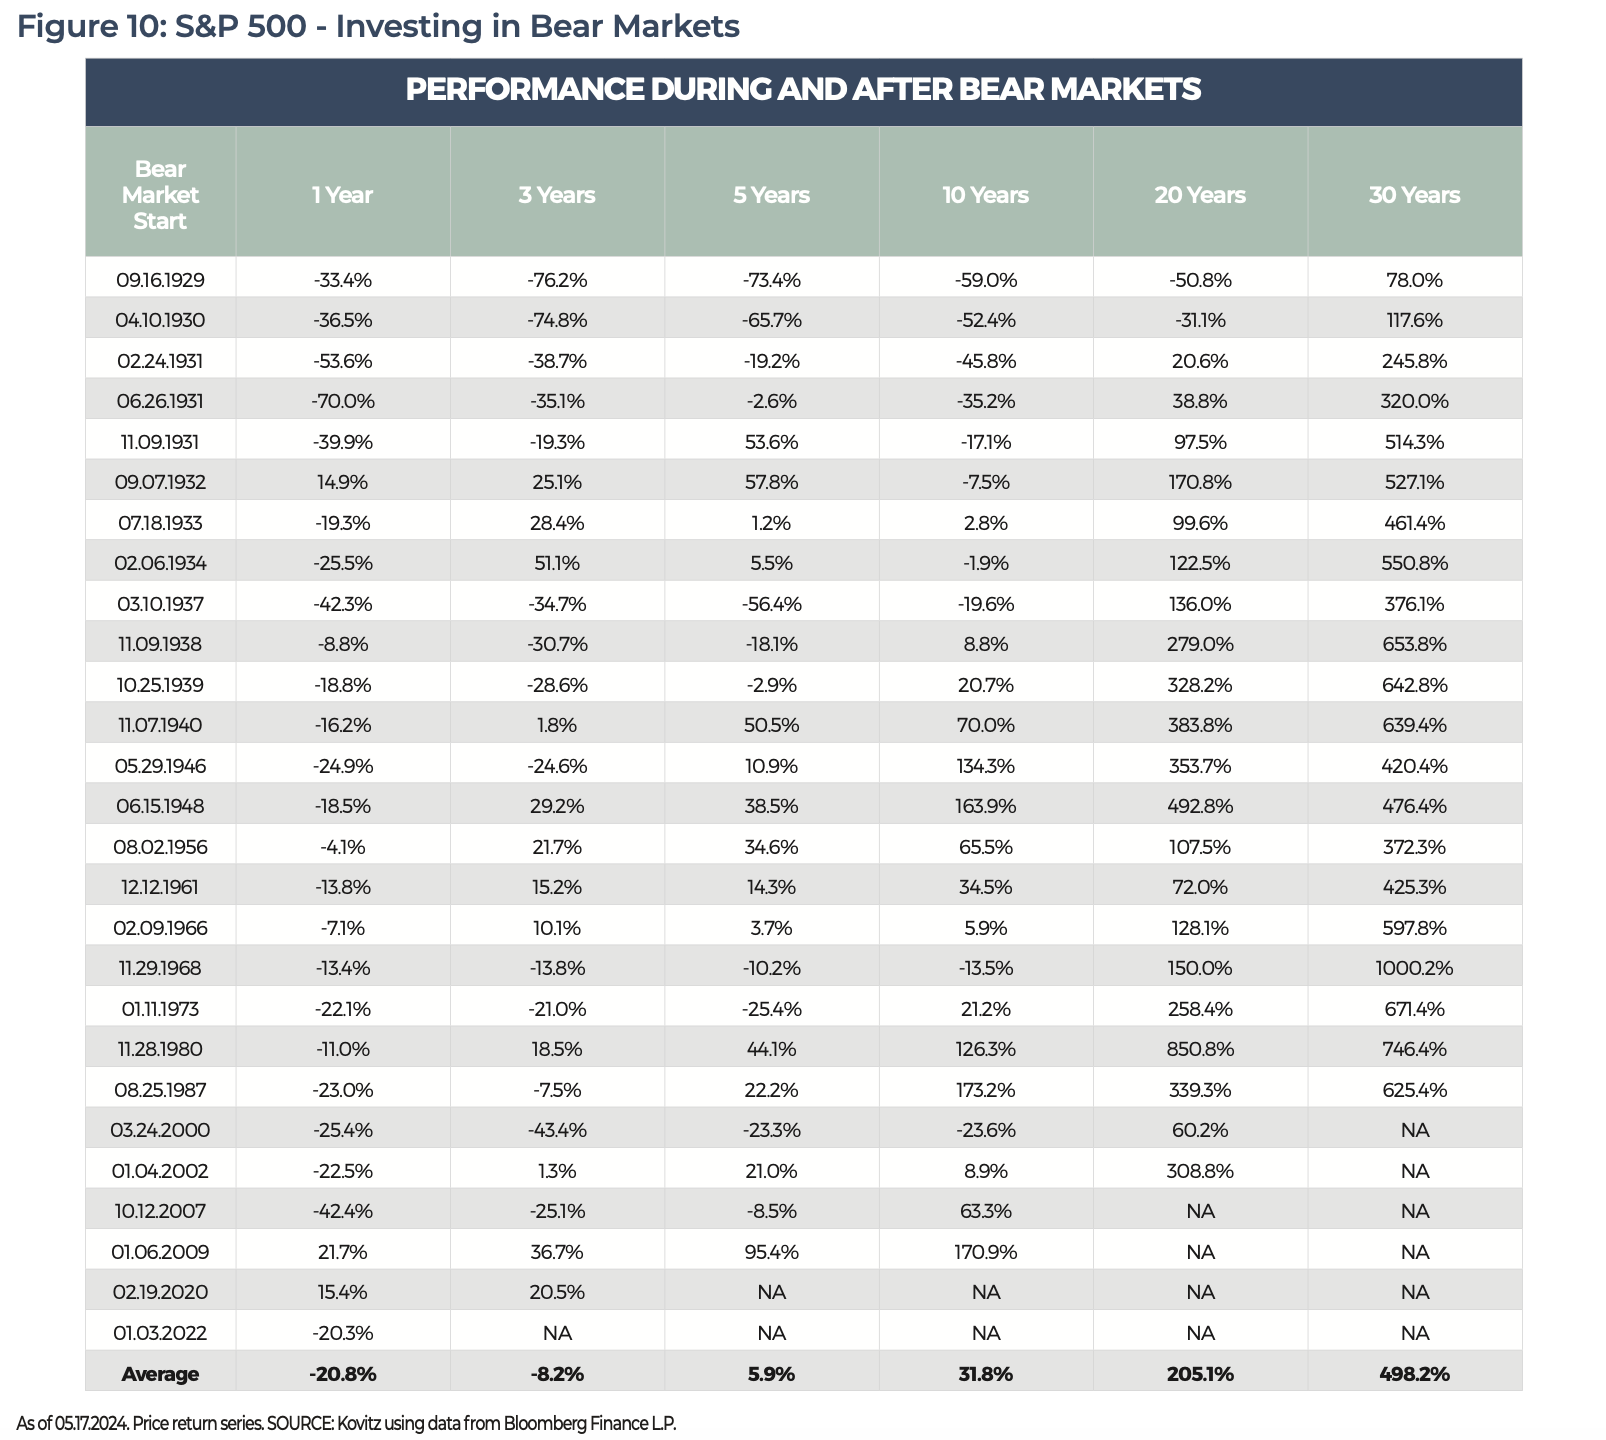
The path to stock market gains is not all unicorns and rainbows. History shows that sooner or later, a market retreat will arrive. The timing is always uncertain and so is the depth. We calculated subsequent returns using “Bear Markets” for the S&P 500 index beginning in 1929 in Figure 10. A “Bear Market” is considered a drop of 20% without an ensuing gain of the same amount. For this illustration, investments are made at the prior peak, which is effectively the day stocks hit a high and started their plunge. One-year returns are dreadful, averaging -20.8%, but fortunes turn by year five, with twenty- and thirty-year returns leaving one to wonder what all the fuss was about (with the benefit of hindsight, of course).
To benefit from the maximum return history, we leave out the impact of dividends from Figures 6 through 10. Indeed, the contribution is material and should be considered when one thinks about their forward-looking returns. Since December 1900, the Dow’s annualized total return (including dividends) is 7.0%, compared to a price return of 5.3%. The S&P 500 has gained an annualized 9.7% on a total return basis since December 1927 and 6.1% on a price return basis.
THE DOW’S PATH TO ONE MILLION
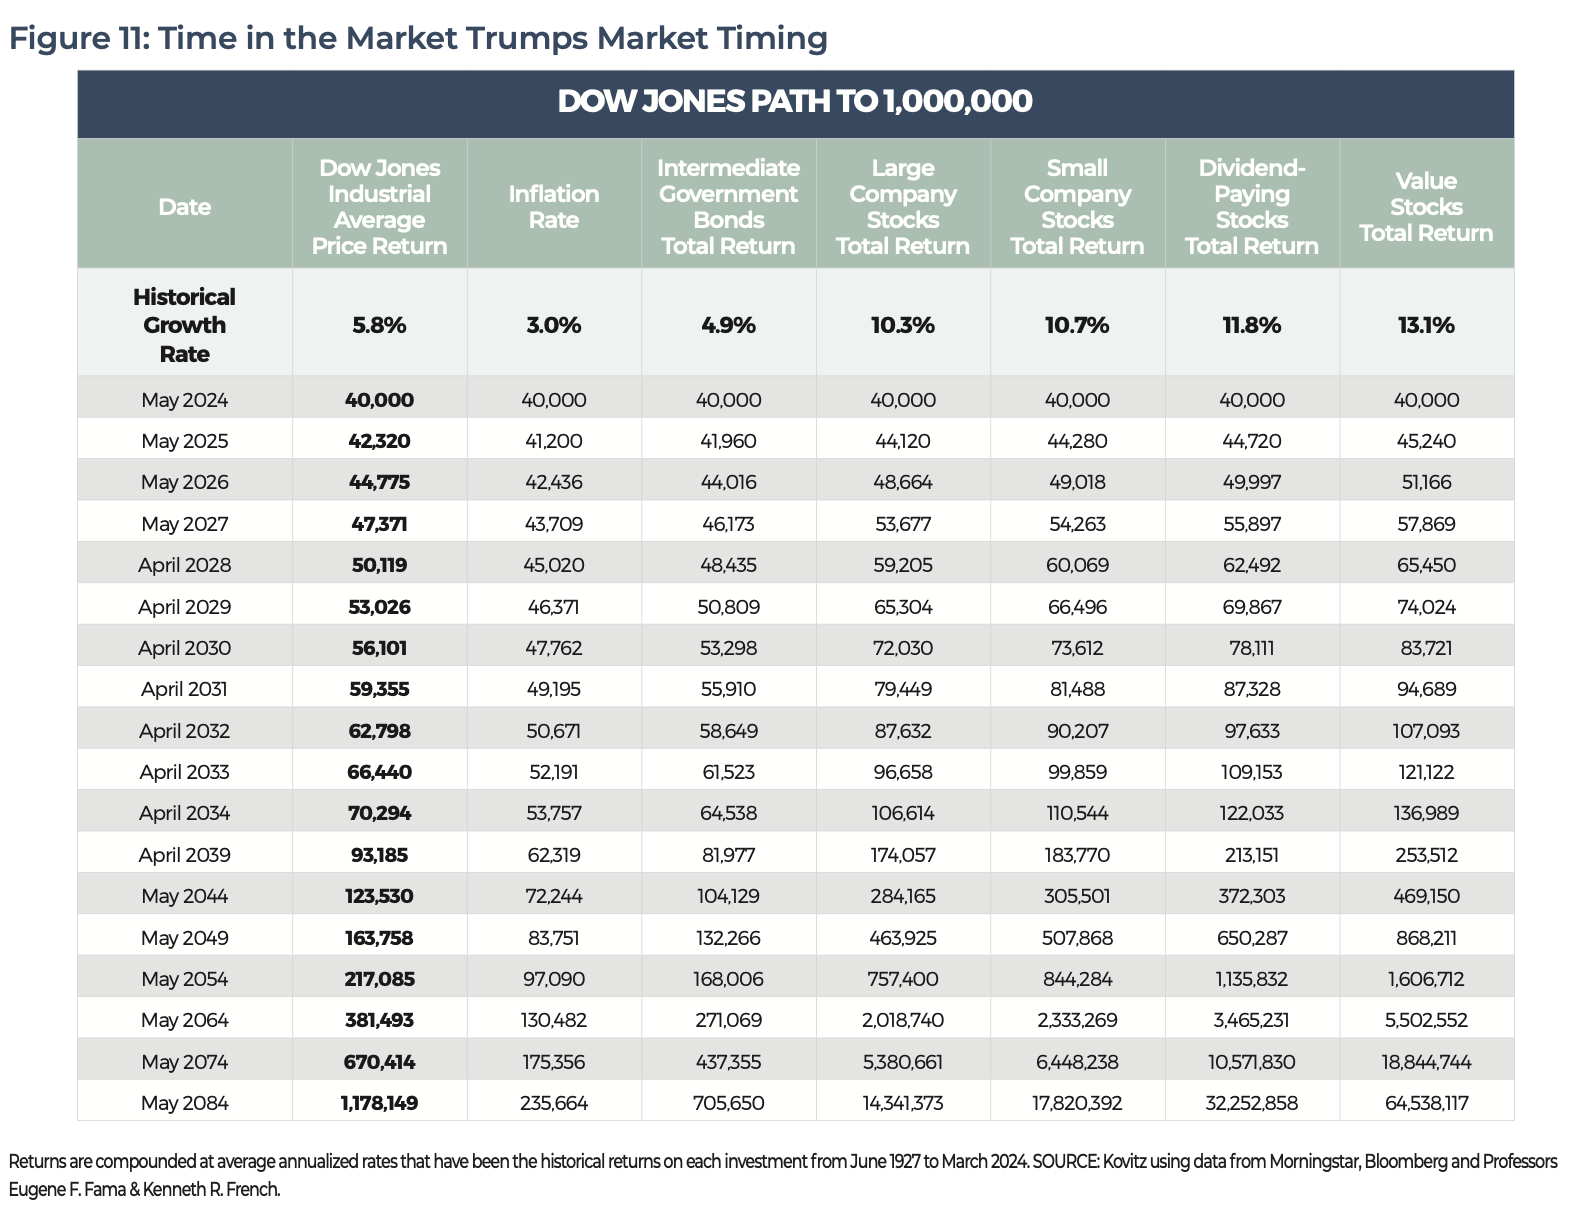
Our Bear Market tangent out of the way, we turn back to the Dow Jones Industrial Average. While talk of index milestones like Dow 40,000 or S&P 5,000 focus on prices and ignore total return, which includes dividends and the impact of their reinvestment, Dow One Million is not as far-fetched as it might initially sound. After all, if we simply compound the annualized 5.8% price appreciation rate that has taken the benchmark from 166.23 on June 30, 1927, to today’s level near 40,000, the seven-digit figure would arrive in 2084, with Dow 100,000 coming in the early 2040’s. Certainly, past performance is no guarantee of future returns , but a case could be made that since price appreciation today accounts for a greater percentage of total return and dividend income a lower percentage than in the past, those Dow targets could arrive even sooner.
Further illustrating the Miracle of Compounding, we show in the table below what a 40,000 starting value would grow to over time based on various return rates that have been the long-term averages for stocks, bonds and inflation. True, we are mixing apples (price return of the Dow Jones benchmark) with oranges (total return of the other columns), but one does not need to endeavor to get rich quick when even relatively modest return rates allow substantial wealth to accrue in the fullness of time. Of course, the historical figures show that Dividend Paying and Value stocks are the best place to be for those with a long-term time horizon.
Admittedly, the table below is simplistic as returns are never consistent, but the earlier one begins to invest, the longer the calendar can work its magic. Indeed, there are always reasons to not buy stocks, but we believe long-term-oriented investors would be better off avoiding major market-timing activity.
THERE’S NO BETTER TIME THAN THE PRESENT
There is usually something about which to worry. Often, we hear and read pundits openly fretting that the market has risen too high or that it’s nearing a precipice. In any case, the feeling that you must take action in that moment or risk missing the boat can be overwhelming, while the alternative solution is to tune in (or pickup the paper) tomorrow for more updates about the market’s latest frenetic gyrations. Yes, there is value in knowing about the goings-on of the investment world (we even write a whole newsletter dedicated to the cause), but we always caution that investors must avoid derailing their personal financial goals with a collision between near-term activity and long-term portfolio alignment.
More than one hundred years of market data and decades of collective experience within our team suggest there aren’t paths to certain riches. Still, we do know that the stock markets have risen over the past century, and longer time horizons have experienced higher probabilities of success. For example, Value stocks, like those in which we seek to invest, have gained in 96.7% of ten-year periods since 1927, and that success rate grows to a perfect 100% over 15- and 20-year periods. Sure, the past is not prologue, but we like those odds a lot.
In absence of a market crystal ball to aid in the prediction of the future, we would argue that a few things can strongly tip the scales of investment success in your favor, including patience, a long time horizon, a broad set of opportunities and personalized financial planning. We endeavor to help you keep more of your money in your pocket (where it belongs) and keep it growing for the future.
“Rivers know this: there is no hurry. We shall get there some day.” — Winnie the Pooh.
Kovitz Investment Group Partners, LLC (“Kovitz”) is an investment adviser registered with the Securities and Exchange Commission. This report should only be considered as a tool in any investment decision and should not be used by itself to make investment decisions. Opinions expressed are only our current opinions or our opinions on the posting date. Any graphs, data, or information in this publication are considered reliably sourced, but no representation is made that it is accurate or complete and should not be relied upon as such. This information is subject to change without notice at any time, based on market and other conditions. Past performance is not indicative of future results, which may vary.