
Every month, The Prudent Speculator produces a newsletter that includes a market summary, helpful charts and graphs, recent equity market news, economic outlook and specific stock investment strategies focused on value stock investing. This month, our Graphic Detail looks at Seasonality, offering factual evidence that one should not Sell in May and Go Away, while we also examine index composition. Note that the entire list is available to our community of loyal subscribers only.

Editor’s Note: Sell in May and Go Away
Citigroup warned the recent rebound in stocks is fragile as it was driven by investors taking profits on short bets rather than bullish flows. But momentum traders will buy equities over the next week regardless of market direction, Goldman’s trading desk said. — Bloomberg, 04.29.24
At least there was consensus on what stocks were supposed to do in the latest week! We can cut Wall Street firms some slack as nobody can predict the future with any consistency. Indeed, the only problem with market timing has always been getting the timing right.
After all, equities embarked on a stellar five-month advance at the end of October 2023, when the number of Bears topped the Bulls in the weekly American Association of Individual Investors (AAII) Sentiment Survey, only to endure a pullback in April after there were more than twice as many optimists as pessimists. Happily, given our contrarian bent, after (but not before) the April showers, the latest AAII Bull-Bear score is 38.5% to 32.5%, right in line with the historical norms.
Of course, even those who already have the big news of the day in hand have a tough time rationalizing the short-term actions of fickle market participants. For example, following the crucial decision on May 1 to leave the target for the Fed Funds rate unchanged at a range of 5.25% to 5.50% by the Federal Reserve, CNBC headlines screamed, “The major averages leapt sharply higher Wednesday afternoon after Federal Reserve Chair Jerome Powell said it is unlikely that the next policy rate move will be a hike,” but after the post-Fed rally fizzled, MarketWatch proclaimed, “Stocks end mixed after Powell dispels Fed rate hike despite persistent inflation.”
Given that many would argue that some of the cold water thrown on equity prices in April was due to fears that Jerome H. Powell & Co. would keep monetary policy restrictive in fighting inflation even if economic growth cooled in a period of stagflation, one might have thought traders would have taken comfort when the Fed Chair was quick to say, “I don’t really understand where that’s coming from. I don’t see the ‘stag-’ or the ‘-flation.’”
Further, Mr. Powell was upbeat in his comments: “Recent indicators suggest that economic activity has continued to expand at a solid pace. Although GDP growth moderated from 3.4% in the fourth quarter of last year to 1.6% in the first quarter, Private Domestic Final Purchases, which excludes inventory investment, government spending and net exports, and usually sends a clearer signal on underlying demand, was 3.1% in the first quarter, as strong as the second half of 2023. Consumer spending has been robust over the past several quarters, even as high interest rates have weighed on housing and equipment investment. Improving supply conditions have supported resilient demand and the strong performance of the U.S. economy over the past year.”
And he was sanguine on consumer prices: “Inflation has eased notably over the past year but remains above our longer-run goal of 2%. Total PCE prices rose 2.7% over the 12 months ending in March; excluding the volatile food and energy categories, core PCE prices rose 2.8%…Although some measures of short-term inflation expectations have increased in recent months, longer-term inflation expectations appear to remain well anchored.”
With a solid economy and a Fed still likely to cut interest rates this year, we believe the dividend yield of 2.6% and forward P/E ratio of 14 on TPS Portfolio are attractive, especially as we think the outlook for corporate profits is favorable. We note that 67.9% of Russell 3000 Value index members have beat Q1 EPS estimates so far, up from 61.0% for all of Q4. Yes, bouts of downside market volatility, troubling events on college campuses and rising geopolitical tensions are disconcerting, but equities over time have always managed to prove Warren Buffett right: “If a business does well, the stock will eventually follow.”
“You will be much more in control if you realize how much you are not in control.” — Benjamin Graham
Graphic Detail
Seasonality, Value Stocks vs. Growth Stocks and Dividend Payers
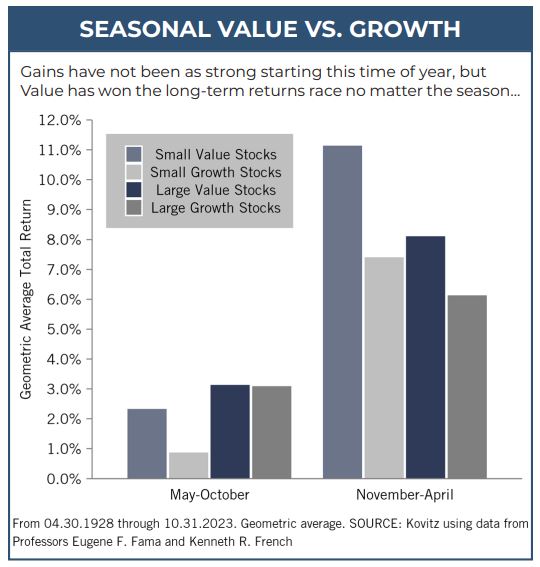
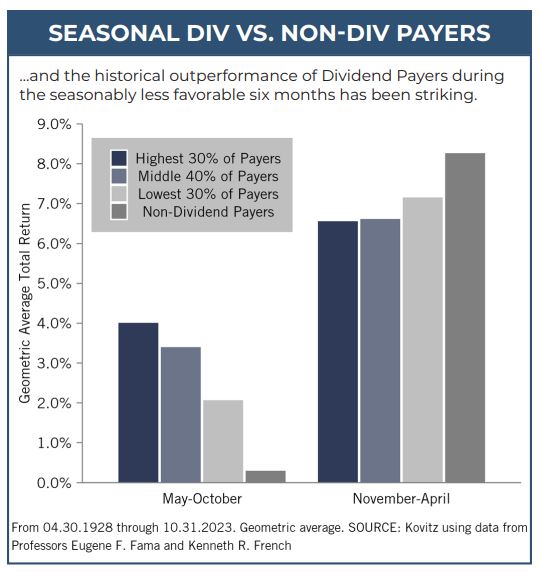
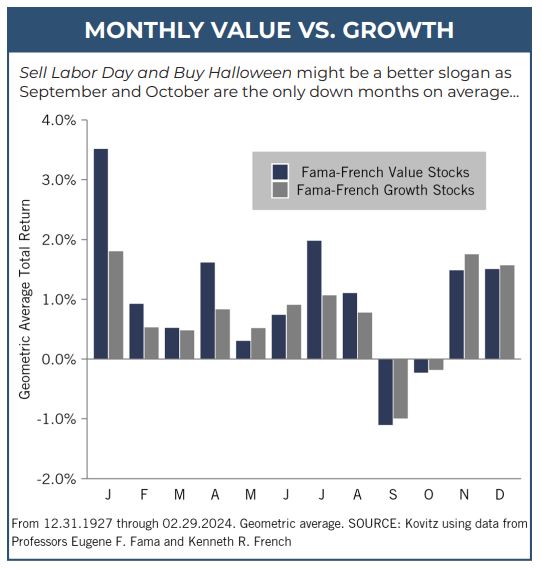
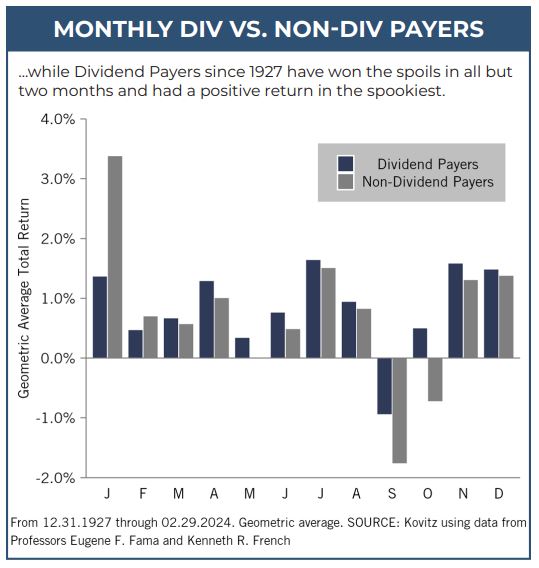
Stocks enjoyed stellar gains (average total return of 18.7% for Russell 3000 Index members) during the Nov. 2023 – Apr. 2024 seasonally favorable period, but a sharp decline in the latest month has many pundits warning folks that they should Sell in May and Go Away.
Of course, the historical data shows Dividend Payers and Value Stocks have enjoyed positive absolute and relative returns, on average, during the seasonally less favorable May-to-October periods, so we see no reason to make any changes to a long-term asset allocation.
Graphic Detail
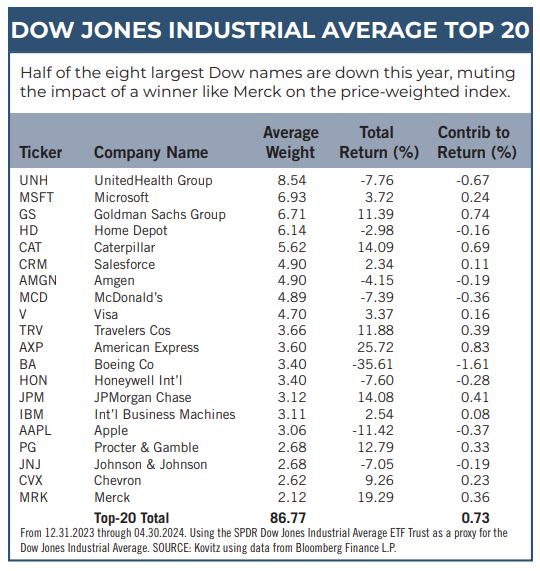
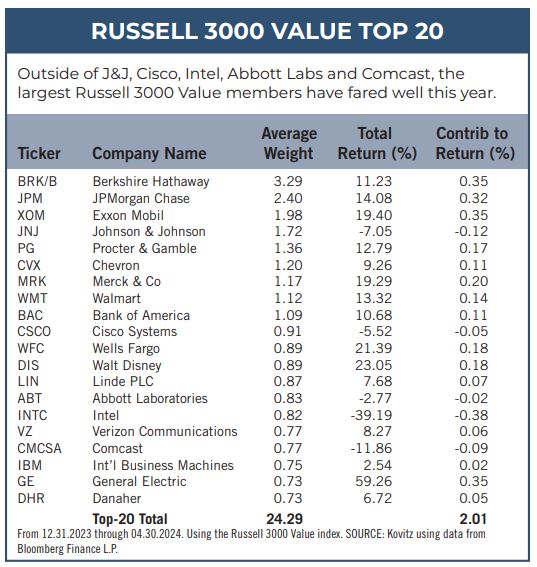
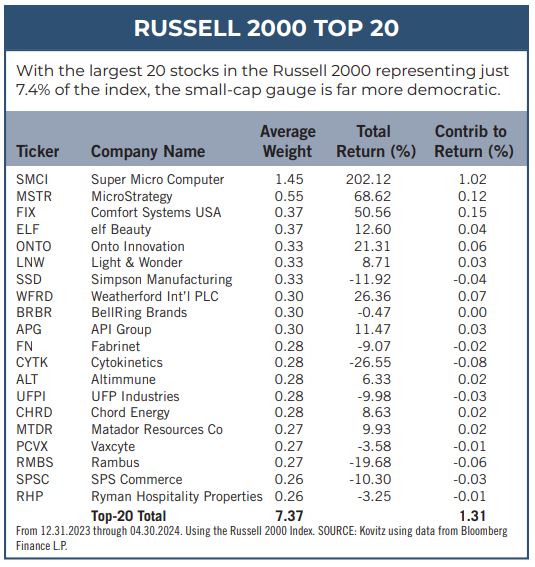
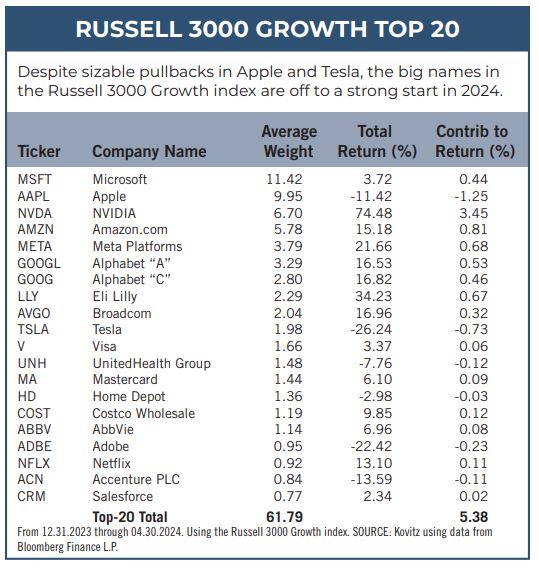
Market of Stocks – Index Composition
Equities performed well in 2023, even as the 13.8% return for the average stock in the broad-based Russell 3000 (R3K) lagged the hefty advance of the capitalization-weighted index. 2024 also has seen the proverbial soldiers trail the generals as the average R3K constituent lost 3.4% over the first four months of the year, versus a positive 5.2% return for the index. No doubt, many indexes are top-heavy as Apple, Microsoft, Nvidia and Amazon account for about the same weight in the R3K Growth index as do the top 37 in the R3K Value index.
Recommended Stock List
In this space, we list all of the stocks we own across our multi-cap-value managed account strategies and in our four newsletter portfolios. See the last page for pertinent information on our flagship TPS strategy, which has been in existence since the launch of The Prudent Speculator in March 1977.
Readers are likely aware that TPS has long been monitored by The Hulbert Financial Digest (“Hulbert”). As industry watchdog Mark Hulbert states, “Hulbert was founded in 1980 with the goal of tracking investment advisory newsletters. Ever since it has been the premiere source of objective and independent performance ratings for the industry.” For info on the newsletters tracked by Hulbert, visit: http://hulbertratings.com/since-inception/.
Keeping in mind that all stocks are rated as “Buys” until such time as we issue an official Sales Alert, we believe that all of the companies in the tables on these pages trade for significant discounts to our determination of long-term fair value and/or offer favorable risk/reward profiles. Note that, while we always seek substantial capital gains, we require lower appreciation potential for stocks that we deem to have more stable earnings streams, more diversified businesses and stronger balance sheets. The natural corollary is that riskier companies must offer far greater upside to warrant a recommendation. Further, as total return is how performance is ultimately judged, we explicitly factor dividend payments into our analytical work.
While we always like to state that we like all of our children equally, meaning that we would be fine in purchasing any of the 100+ stocks, we remind subscribers that we very much advocate broad portfolio diversification with TPS Portfolio holding more than eighty of these companies. Of course, we respect that some folks may prefer a more concentrated portfolio, however our minimum comfort level in terms of number of overall holdings in a broadly diversified portfolio is at least thirty!
TPS rankings and performance are derived from hypothetical transactions “entered” by Hulbert based on recommendations provided within TPS, and according to Hulbert’s own procedures, irrespective of specific prices shown within TPS, where applicable. Such performance does not reflect the actual experience of any TPS subscriber. Hulbert applies a hypothetical commission to all “transactions” based on an average rate that is charged by the largest discount brokers in the U.S., and which rate is solely determined by Hulbert. Hulbert’s performance calculations do not incorporate the effects of taxes, fees, or other expenses. TPS pays an annual fee to be monitored and ranked by Hulbert. With respect to “since inception” performance, Hulbert has compared TPS to 19 other newsletters across 62 strategies (as of the date of this publication). Past performance is not an indication of future results. For additional information about Hulbert’s methodology, visit: http://hulbertratings.com/methodology/.

Portfolio Builder
Each month in this column, we highlight 10 stocks with which readers might populate their portfolios: Bristol-Meyers Squibb (BMY), General Dynamics (GD) and Seagate Tech (STX)

Kovitz Investment Group Partners, LLC (“Kovitz”) is an investment adviser registered with the Securities and Exchange Commission. This report should only be considered as a tool in any investment decision and should not be used by itself to make investment decisions. Opinions expressed are only our current opinions or our opinions on the posting date. Any graphs, data, or information in this publication are considered reliably sourced, but no representation is made that it is accurate or complete and should not be relied upon as such. This information is subject to change without notice at any time, based on market and other conditions. Past performance is not indicative of future results, which may vary.