Elevated inflation and rising interest rates commanded most of investors’ attention over the past year, with proclamations from Jerome H. Powell and his colleagues at the Federal Reserve often the catalyst for volatile gyrations in asset prices. Those moves were generally in the negative direction over the first three quarters of the year, as the S&P 500 index entered into Bear Market territory in June before hitting its low for the year on October 12.
Though still negative, inexpensive equities held up much better than those with lofty valuations. The S&P 500 Value index suffered drop a of 16.6% while its Growth counterpart skidded 30.4% in the first three quarters, which is in keeping with the historical evidence for Value outperformance when inflation is high, when the Fed is tightening and when interest rates are moving up.
The lead earned by Value stocks continued to widen in the fourth quarter as the market rallied somewhat to close out the year. The 24% performance gap in 2022 between the S&P 500’s Value and Growth components ranked #2 in favor of Value since those indexes began in 1996.
Of course, we are thrilled to see Value stocks get some time in the sun after a long winter, even topping many fixed income categories. Stocks managed to climb the proverbial Wall of Worry in Q4, surmounting fears of sky-high inflation, weaker-than-expected economic data, the ongoing war in eastern Europe and elevated fuel prices, to name several concerns. Despite the tough year, we think Value stocks remain very attractive.
YOU ARE HERE: EQUITY STOCKS
It’s not often that stocks and bonds decline in tandem, and when they do, different reasons have tended to drive their respective losses. Inflationary worries troubled equity investors in 2022, as did concerns about rising rates (which can impact corporate debt, financials and capital expenditures), a war in eastern Europe and the potential for a recession. The -18% total return for the S&P in 2022 was on the low end of historical outcomes and the index struggled to rebound from the year’s lows.
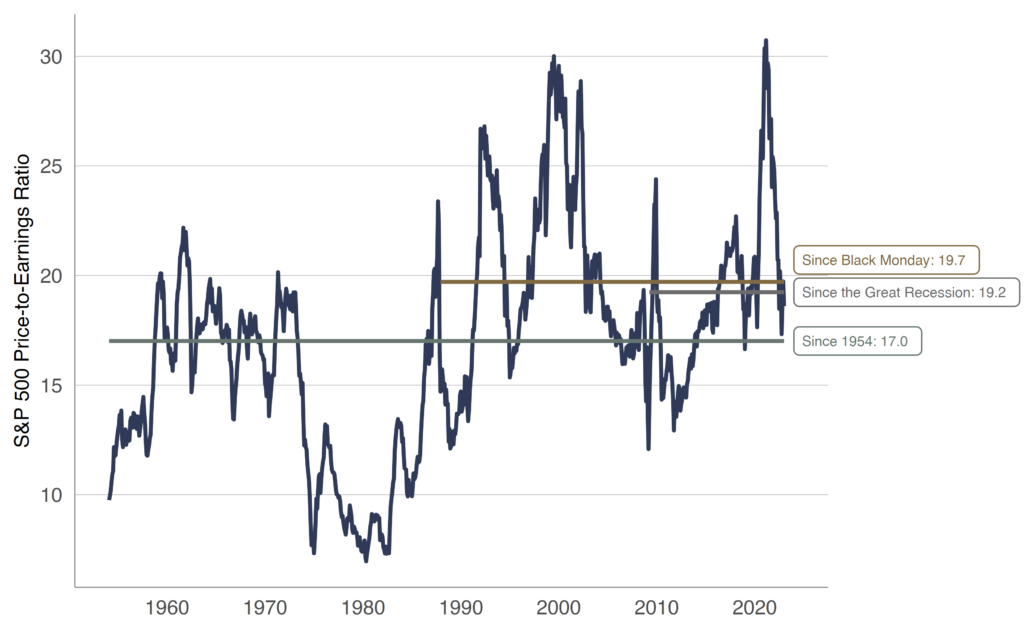
AGGREGATE VALUATIONS ARE VOLATILE
Since 1954, the long-term price-to-earnings ratio average for the S&P 500 has hovered around 17 times (green line), while the ratio’s recent averages have been quite a bit higher (Black Monday in 1987 in gold and the low point during Great Recession in grey). The swings in the series can be distilled into two factors: (1) the S&P 500’s price level (numerator), which is currently around 3800 and (2) the S&P 500’s trailing earnings per share (denominator).
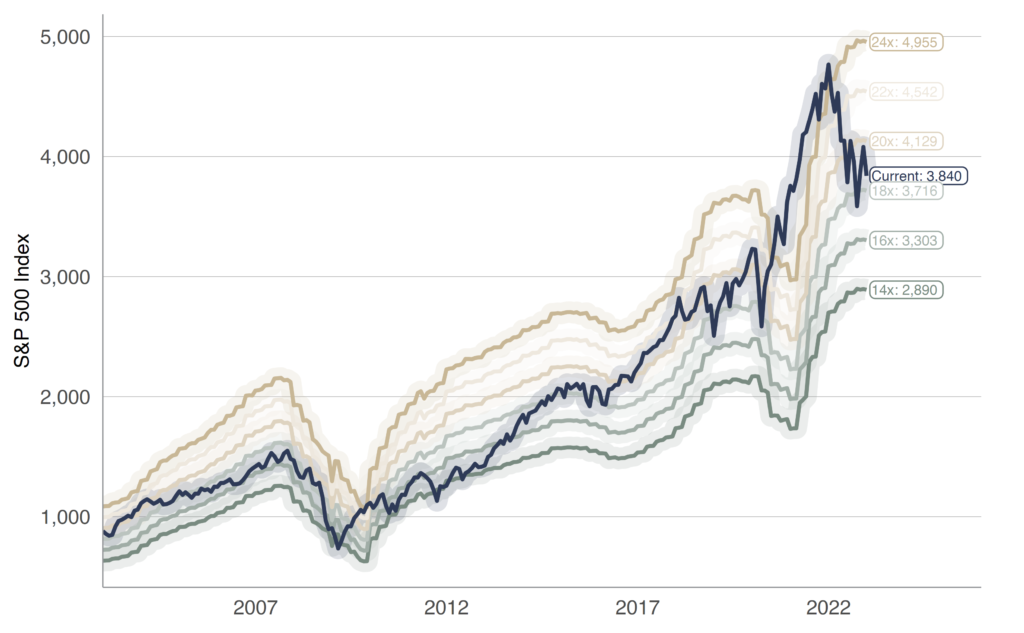
MULTIPLES CAN CHANGE
Investors love to see growth in earnings (or at least growth in earnings projections), even though it’s possible for the S&P 500 price to climb without actually experiencing underlying earnings growth. Below, we chart the current S&P 500 P/E multiple (in navy), with earning multiples between 14 times and 24 times in the background. As Figures 18 and 19 show, the multiple is far from stable over time, and the current P/E ratio of 19 times is near the middle of the road historically.
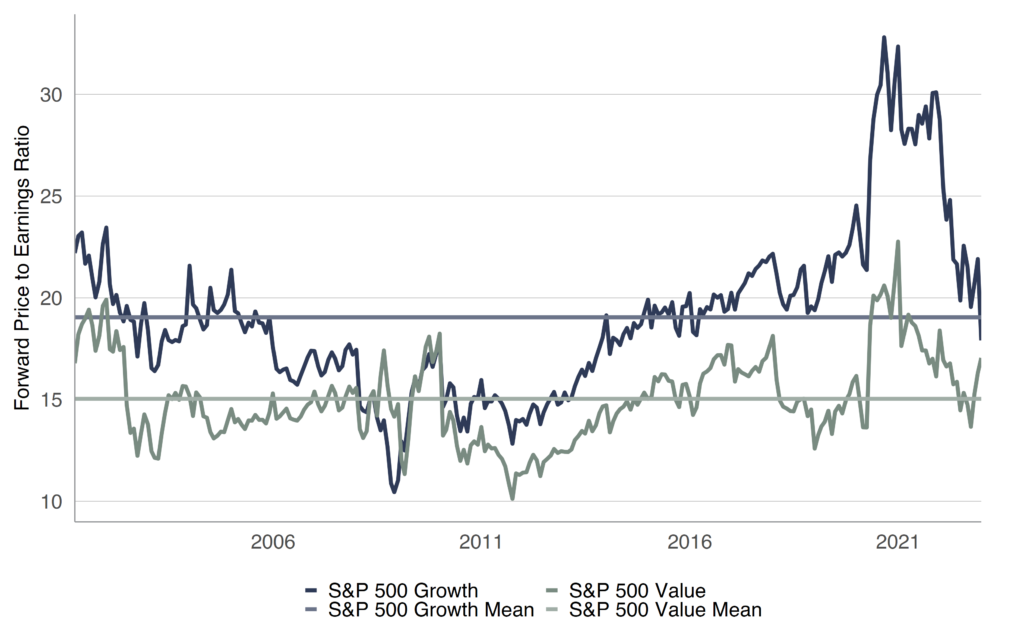
VALUE STOCKS REMAIN ATTRACTIVE
One of the most common valuation metrics, the P/E ratio, measures the price an investor pays for a unit of earnings. Lately, Value stocks (those with lower P/E ratios) have seen their ratios rise above longer-term averages. The huge price whack for Growth stocks contributed to its multiple contraction, as did cuts to rosy earnings estimates. We think a near-term earnings contraction may elevate the attractiveness of Value stocks given their lower relative earnings multiples.
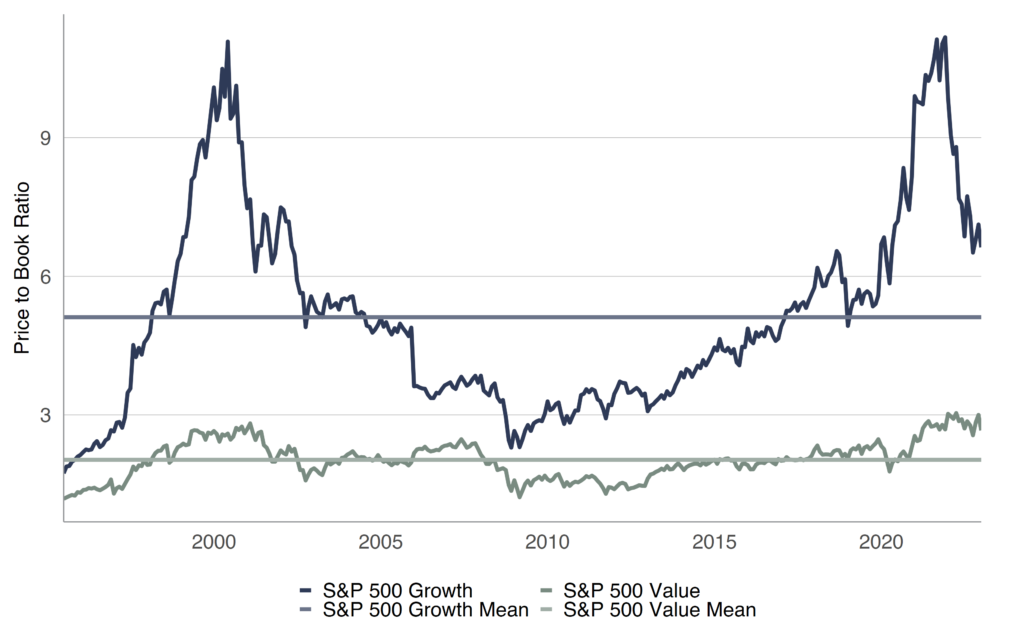
P/E ISN’T THE ONLY MEASURE
Another measure frequently used in an academic classification of Value and Growth stocks is the Price-to-Book (P/B) ratio. It measures the difference between a company’s market value (i.e. market capitalization) and book value (assets less liabilities). As measured by the P/B ratio, the valuation gap hasn’t retreated as much as the faster-moving P/E ratio has, but it still narrowed considerably in 2022.
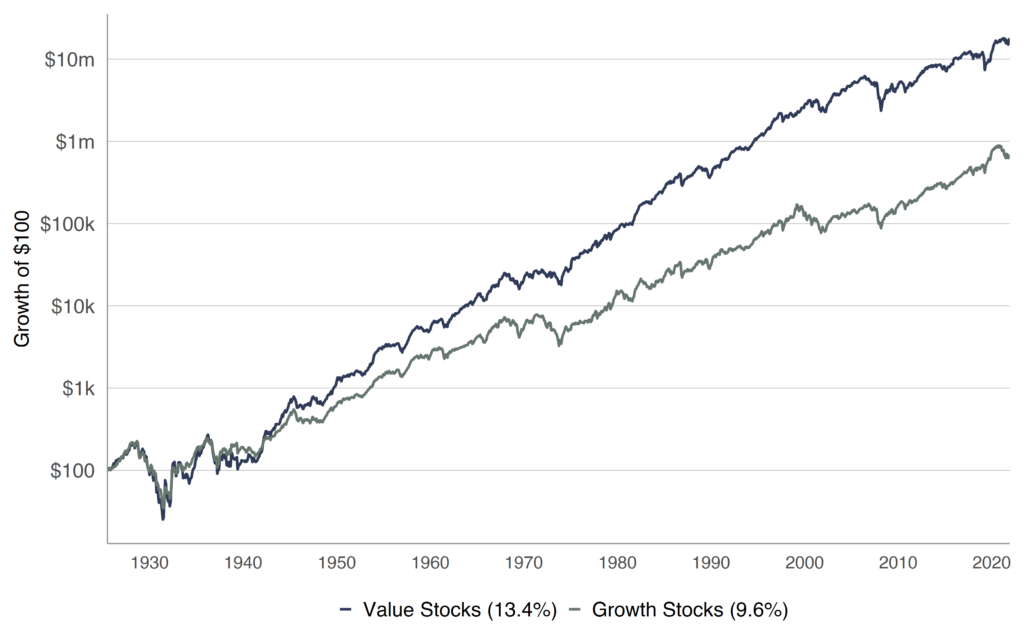
FISHING IN THE VALUE POND
We continue to find value in all market-cap strata, but stocks with reasonable price metrics and generous dividend yields were left behind as Growth stocks soared over most of the past decade. We believe that’s an anomaly. Historically, terrific returns in Value stocks (in Figure 22) have rewarded investors willing to keep the faith over the long term. In the new year and beyond, we will continue our long-held tradition of orienting our broadly diversified portfolios in the Value direction.
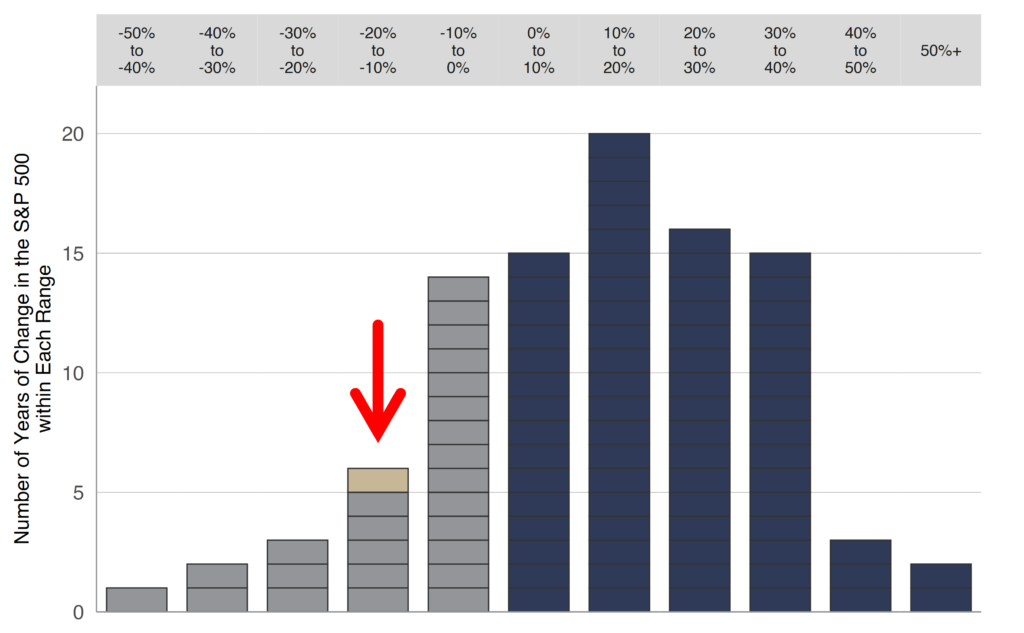
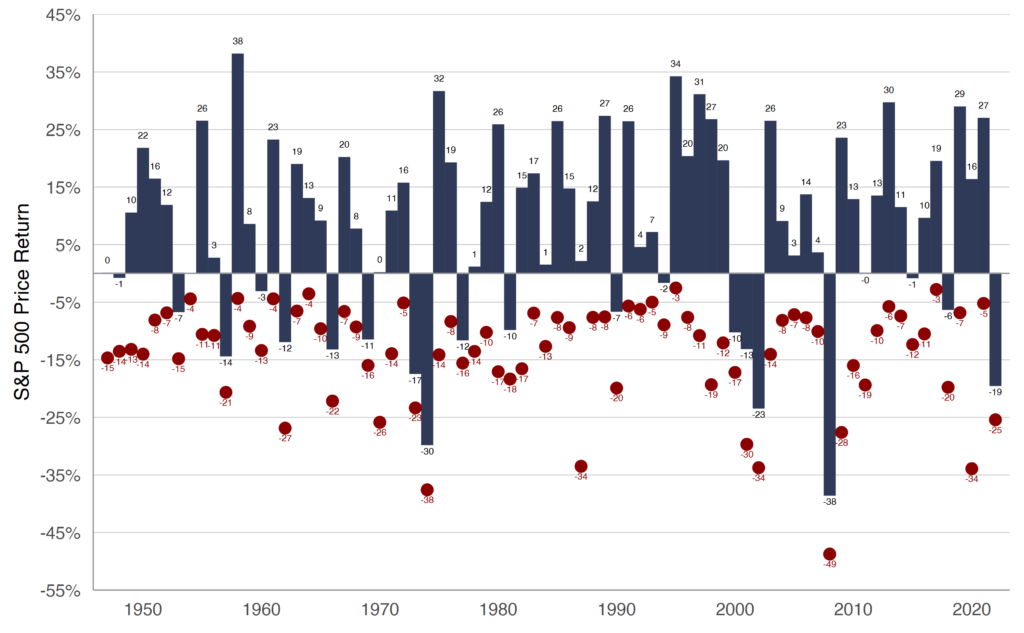
INTRA-YEAR DOWNTURNS
Even with a healthy mean annual return of 8.8% since 1946, the S&P 500 index certainly has been volatile on trading days in between January 1 and December 31. Figure 23 shows the index experienced an average 14% drop from a year’s respective peak, even though the full-year returns were most often in positive territory. Yes, the 6% rebound from the low in 2022 beats a poke in the eye with a sharp stick, but we would like to see the S&P’s return closer to historical averages in 2023!
EYES ON FUNDAMENTALS
Ralph Wanger, manager of the Acorn Fund from 1970 to 2003, wrote of the stock market, “There’s an excitable dog on a very long leash in New York City, darting randomly in every direction. The dog’s owner is walking from Columbus Circle, through Central Park, to the Metropolitan Museum. At any one moment, there is no predicting which way the pooch will lurch. But in the long run, you know he’s heading northeast at an average speed of three miles per hour. What is astonishing is that almost all of the dog watchers, big and small, seem to have their eye on the dog, and not the owner.”
Nearly a century of market data shows that stocks have behaved like Mr. Wanger’s excitable dog virtually every year, and a (relatively) newfound ability to check portfolio movements at all hours is a temptation likely to result in short-term trading in what should be long-term-oriented portfolios. It should come as no surprise, but we enjoyed little about a year like 2022 (from a stock investor standpoint), and we write frequently about the steadying effect of a longer-term focus to calm nerves, sometimes including our own. To that end, we’ve experienced three Bear Markets in the S&P 500 over the past six years, yet the annual returns (22%, -4%, 31%, 18%, 29% and -18%) largely show few battle scars and pencil out to a tidy 11.4% annualized total return.
THE ROAD AHEAD
We think the outlook for America and its investors remains bright, despite headlines that might cause one to wonder if things are falling apart. We do not fully understand the omnipresent negativity that seems to permeate the financial press these days. Yes, news is a business and fear sells, but the jobs picture remains robust, Q3 real (inflation-adjusted) U.S. GDP rose by 3.2% and the current estimate for domestic Q4 economic growth per the Atlanta Fed is 3.8%. The odds of recession in 2023 are high, but the big decline in stocks witnessed in 2022 may have discounted a lot of bad news already.
There’s no question our investment team has a deep affection for our Value-oriented, broadly diversified portfolios of stocks. Of course, we also understand stock-only portfolios aren’t an ideal fit for everyone. For this reason, we have consistently expanded wealth management services under our Kovitz parent brand to bring together a broad suite of investment opportunities and comprehensive financial planning capabilities, which are constructed around client-specific needs and goals. We also build customized financial plans and partner with our clients as a team, functioning as the “quarterback” between you and your existing attorneys, tax advisors and insurance agents. And, in cases where you aren’t currently engaged with these professionals, we have an expanding network to which we can connect you.
If you want to learn more about our experienced team of Wealth Advisors, please email Jason Clark (jclark@kovitz.com or 949.424.1013). We would be honored to earn the opportunity to help you achieve your long-term financial goals.