The Prudent Speculator Weekly Commentary is expertly curated every week as a valuable resource for stock market news, investing tips, business insights, and economic trends as it relates to value stock investing. In this week’s market commentary, we discuss inflation, interest rates, regional banks, a historical perspective on the debt ceiling and more economic news. We also include a short preview of our specific stock picks for the week; the entire list is available only to our community of loyal subscribers.
Executive Summary
Week in Review – May Downturn Continues
Debt Ceiling – Historical Perspective
Recession – Weaker Econ Data, but Q2 Growth Still the Current Atlanta Fed Projection and No Reason to Panic if a Contraction Eventually Occurs
Inflation – Lower CPI & PPI Tallies
Interest Rates – Still Low By Historical Standards
Regional Banks – Deposit Outflows at PacWest; but Inflows for Western Alliance; CMA Very Undervalued
Valuations – Liking the Metrics for our Portfolios
Market Timing – Only Problem is Getting the Timing Right
Stock News – Updates on eleven stocks across eight different sectors
Week in Review – May Downturn Continues
It remained a not-so-grand start to the seasonally less favorable (it is still positive, on average, for Value Stocks and Dividend Payers) May – October period,
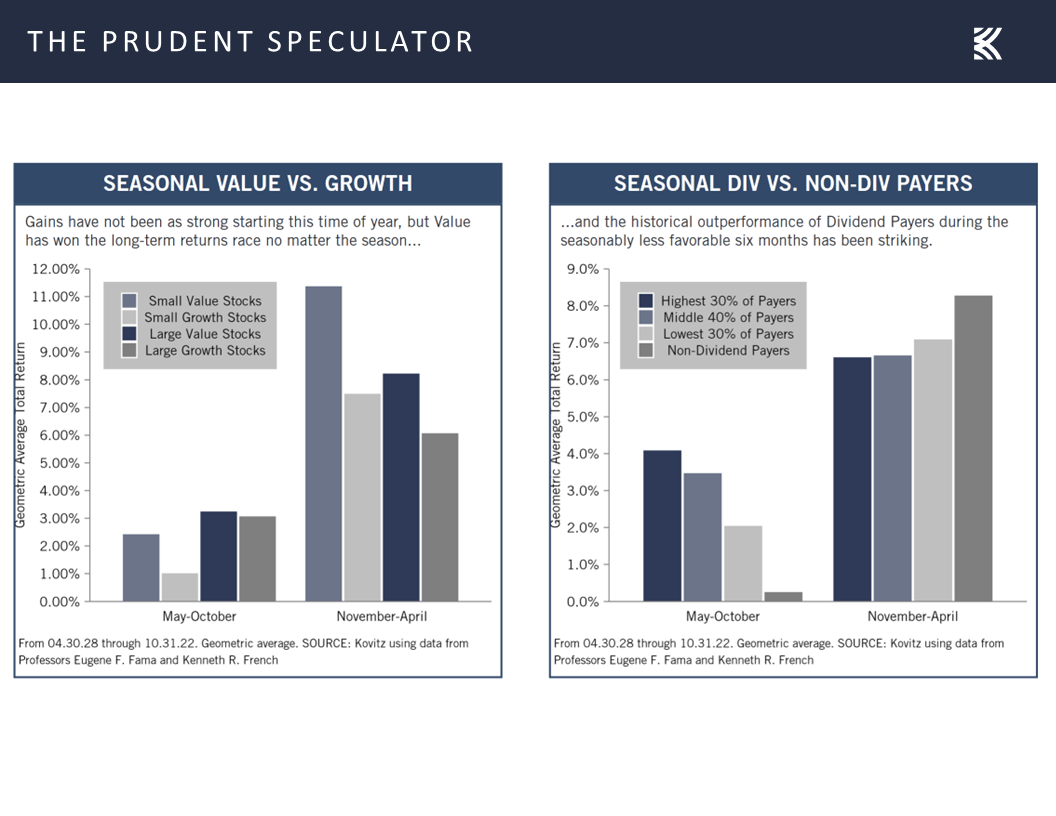
as the Russell 3000 Value index lost ground every day last week, following a miserable week prior in which the benchmark dropped four of the five trading days. The daily losses have been relatively modest, and we understand that volatility is a normal part of the investment process,
but we understand that there is plenty to worry about these days, including the drama in Washington over the debt ceiling.
Debt Ceiling – Historical Perspective
After all, U.S. Treasury Secretary Janet Yellen warned on Bloomberg Television on May 12, “If Congress fails to do that, it really impairs our credit rating. We have to default on some obligation, whether it’s Treasuries or payments to Social Security recipients. That’s something America hasn’t done since 1789. And we shouldn’t start now.”
As we said back in January, certainly, this sounds ominous, but this is not the first time we have had the debt ceiling hanging over our heads. In fact, as the Treasury’s website (https://home.treasury.gov/policy-issues/financial-markets-financial-institutions-and-fiscal-service/debt-limit) states, “Since 1960, Congress has acted 78 separate times to permanently raise, temporarily extend, or revise the definition of the debt limit – 49 times under Republican presidents and 29 times under Democratic presidents. Congressional leaders in both parties have recognized that this is necessary.”
No doubt, a U.S. default is not something we want to see, and it would undoubtedly lead to turmoil in the global financial markets, but here is what we wrote on the subject back in August 2011:
The debt drama in Washington is no doubt top of mind for almost every investor. Though there were initially hopes for some sort of a ‘Grand Plan’ to be struck that might see upwards of $4 trillion cut over 10 years from the country’s massive deficit, the warring parties are now trying to simply cobble something together to stave off a default prior to the somewhat arbitrary August 2nd deadline for raising the debt ceiling. As if this weren’t enough of a concern, the ratings agencies have suggested that the nation’s AAA credit rating may be downgraded even if some sort of a decent compromise is reached. Needless to say, few are happy with our supposed ‘leaders’, no matter which side of the aisle they may reside.
Not surprisingly, the political rancor has most folks on edge with reports surfacing that investors have been pulling cash from money market funds while the equity markets have been wobbling. Certainly, we do not want to make light of the debt issue, but we continue to think it highly unlikely that Uncle Sam will default on his obligations. Yes, there is a good chance that the U.S. credit rating will be downgraded, but we doubt that we will see a big change in the yields on Treasuries. The reason for this is that there is little place else for investors to go as those seeking the safety and yield of a supposedly risk-free (assuming the security is held to maturity) asset are unlikely to bail out of their Treasury investments.
Don’t believe me? Take a look at where things stand on the benchmark 10-Year U.S. Treasury as of July 29. Clearly, if investors thought that there was a risk of the government not making good on its interest and principal payments, yields would have spiked significantly higher, rather than touching their low for the year at 2.80%.
And, believe it or not, we’ve been down this road before. Consider the following commentary:
Republicans in Congress have vowed not to raise the debt ceiling until the President agrees to their plans to trim federal spending. The President has said he will not be blackmailed into agreeing to the GOP program.
The Treasury Secretary has said it is irresponsible for Republicans to hold the debt ceiling hostage in the budget debate because even the risk of a government default on its debt could cause turmoil in financial markets
“For all their loose talk,” Mr. Clinton said, “the Congressional leaders know that if they were to allow us to go into default, this would have a severe impact on our economy, on financial markets, and on the interest rates paid by government, business and homeowners.”
Hopefully, the quote from President Clinton gave away that the time period was November 1995 when the U.S. government had to put non-essential government workers on furlough and suspend non-essential services. While not quite the same situation we are facing today, the debt ceiling was the big sticking point back then and Washington was actually able to reopen for business five days after the initial ‘non-essential’ measures were taken. Of course, a deal still could not be reached and the government actually shut down completely four weeks later in an event that lasted from December 16, 1995 to January 6, 1996. Treasuries performed very well (yields actually moved lower!) during that turbulent time.
But stocks must have taken it on the chin, right? Well, there were definitely some rocky periods, but equities moved nicely higher with the large-cap S&P 500 advancing more than 15% from August 1995 through February 1996!
At the end of the day, we do expect some sort of deal on the debt ceiling to be reached, but we concede that there likely will be plenty of drama between now and then, while we remember that there have been 37 corrections of 10% or greater for the S&P 500 since we started publishing The Prudent Speculator in March 1977.
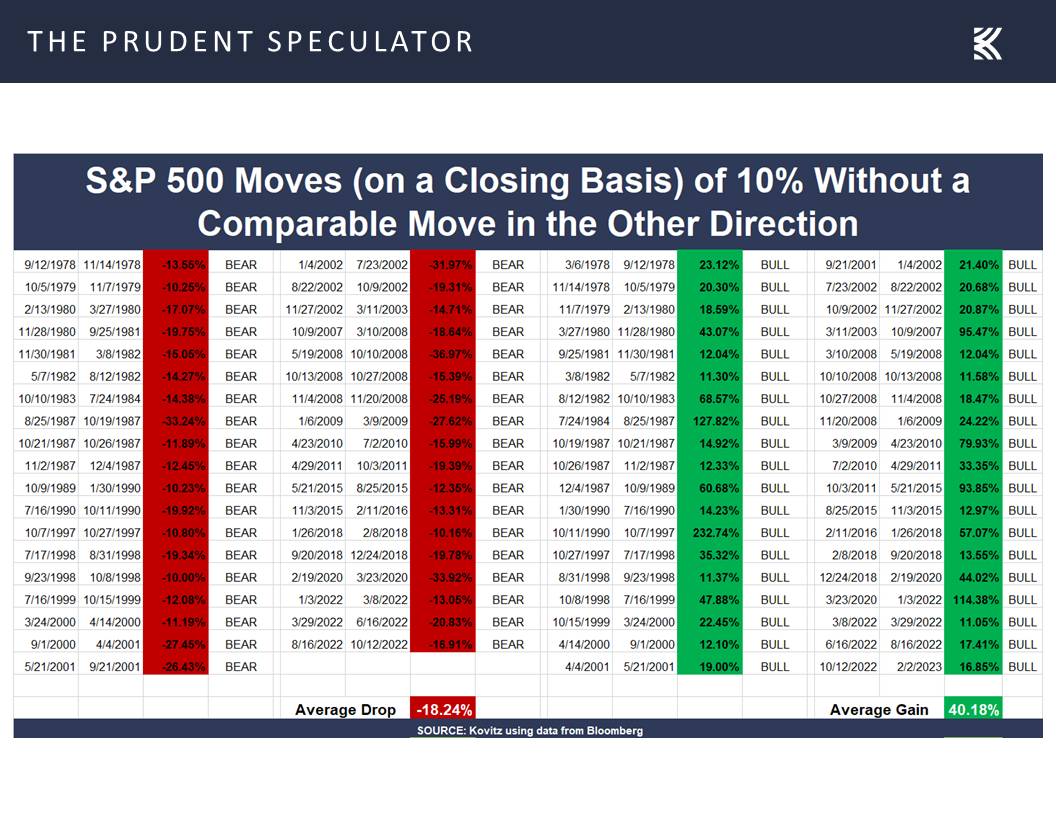
Happily, there have been 38 rallies of more than 10% in that index over the past 46 years, with the average gain in the times in the green dwarfing the average loss in the periods in the red. And, shifting back to Value stocks, we should point out that the Russell 3000 Value index (data for which begins in 1995) has had a 200% total return, or 9.77% per annum, since the July 2011 debt-ceiling scare, and an 851% total return, or 8.55% per annum, since the one in 1995.
Recession – Weaker Econ Data, but Q2 Growth Still the Current Atlanta Fed Projection and No Reason to Panic if a Contraction Eventually Occurs
We certainly do not mean to downplay the concerns of investors, as fears of recession, elevated inflation, higher interest rates and the banking turmoil are additional bogeymen now spooking folks. Looking at the latest developments on each of those fronts, we note that the odds of an economic contraction have remained at 65% for a while now,
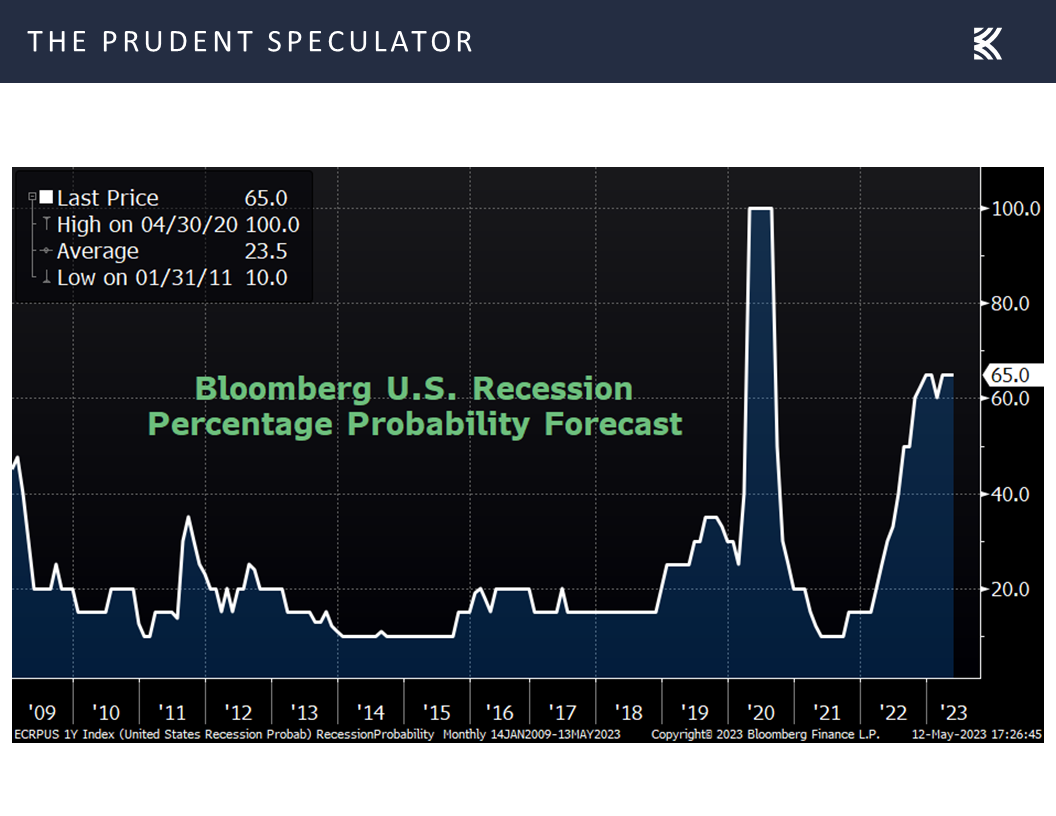
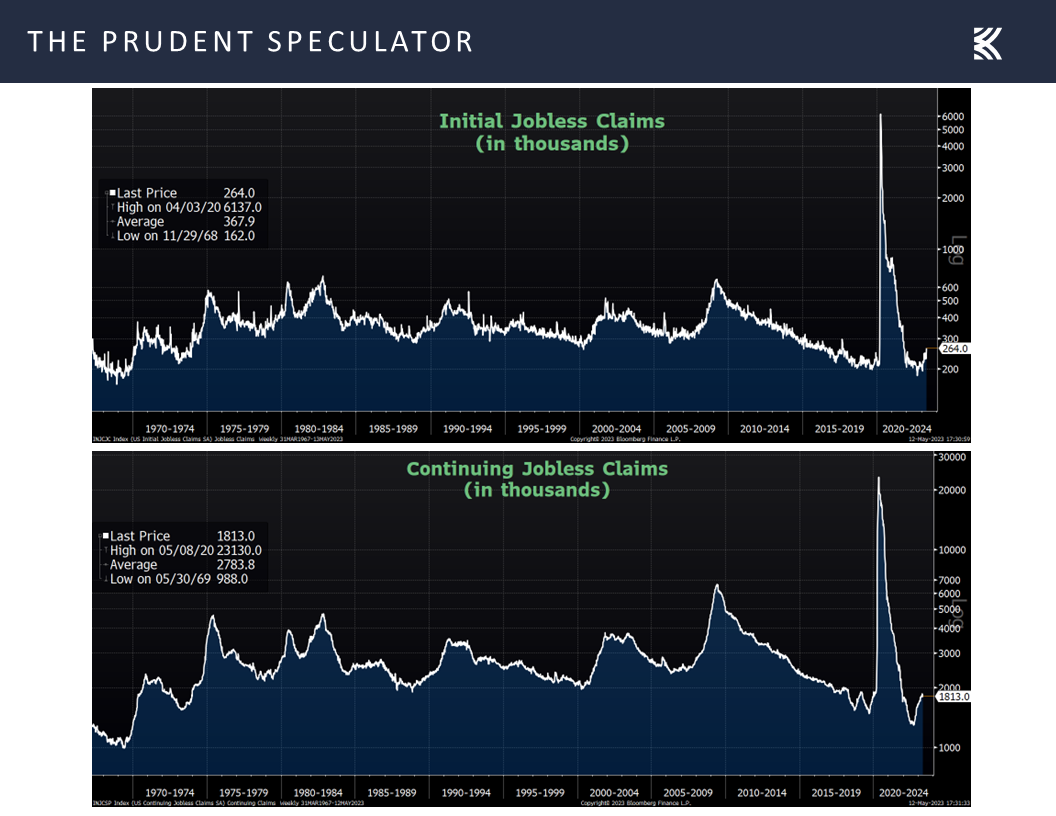
though the exceedingly robust labor situation has shown a few cracks with the number of first-time filings for unemployment benefits rising in the latest week to a greater-than-expected 264,000, even as this tally is well below the historical average.
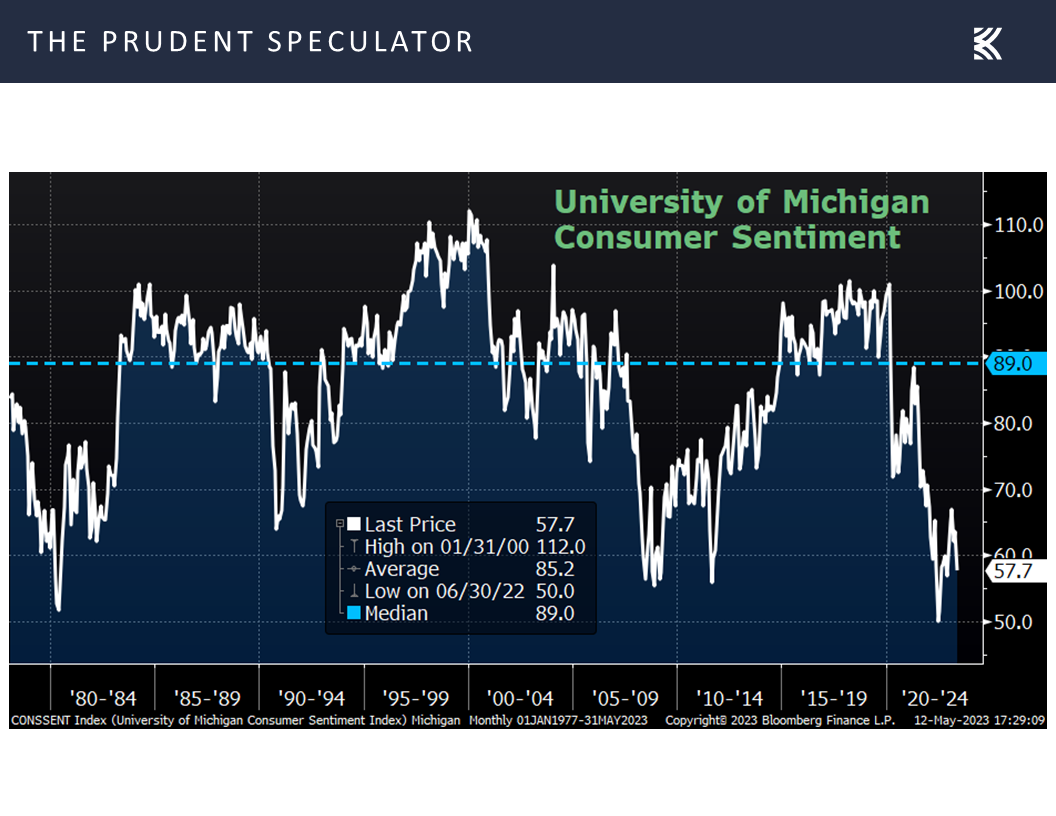
We also had the first read for May on the health of the consumer with the University of Michigan’s sentiment gauge dropping to 57.7, one of the weakest tallies on record,
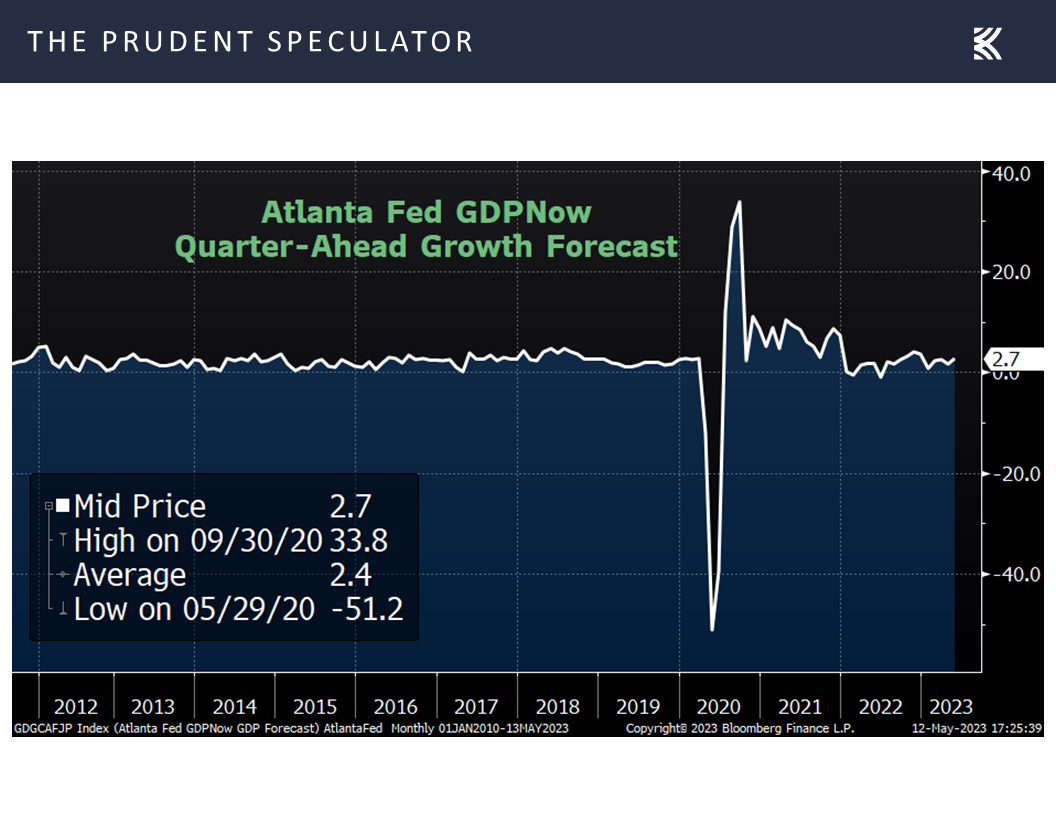
yet the latest estimate from the Atlanta Fed for Q2 real GDP growth (yes, growth!) stood at a healthy 2.7%,
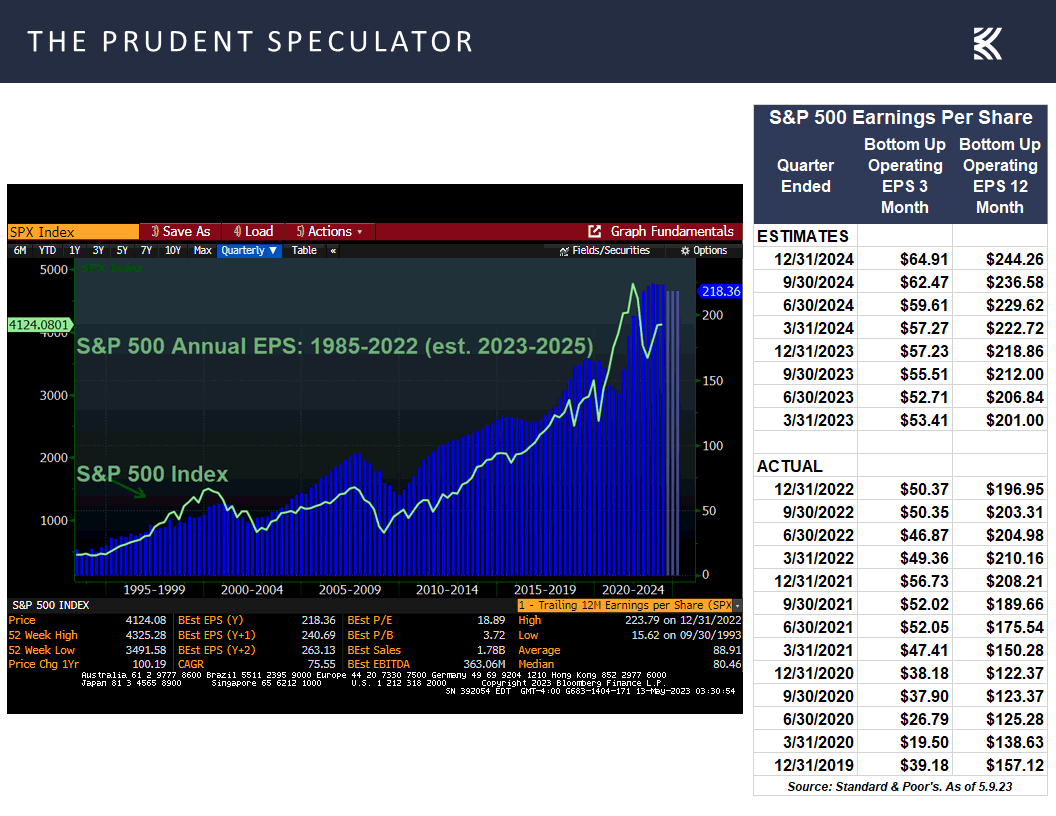
which is part of the reason that the outlook for corporate profits for the S&P 500 from Standard & Poor’s itself remains very good. Indeed, bottom-up operating EPS is projected to grow from $196.95 in 2022 to $218.86 in 2023 and $244.26 in 2024. For its part, Bloomberg has comparable estimates for 2023 and 2024.
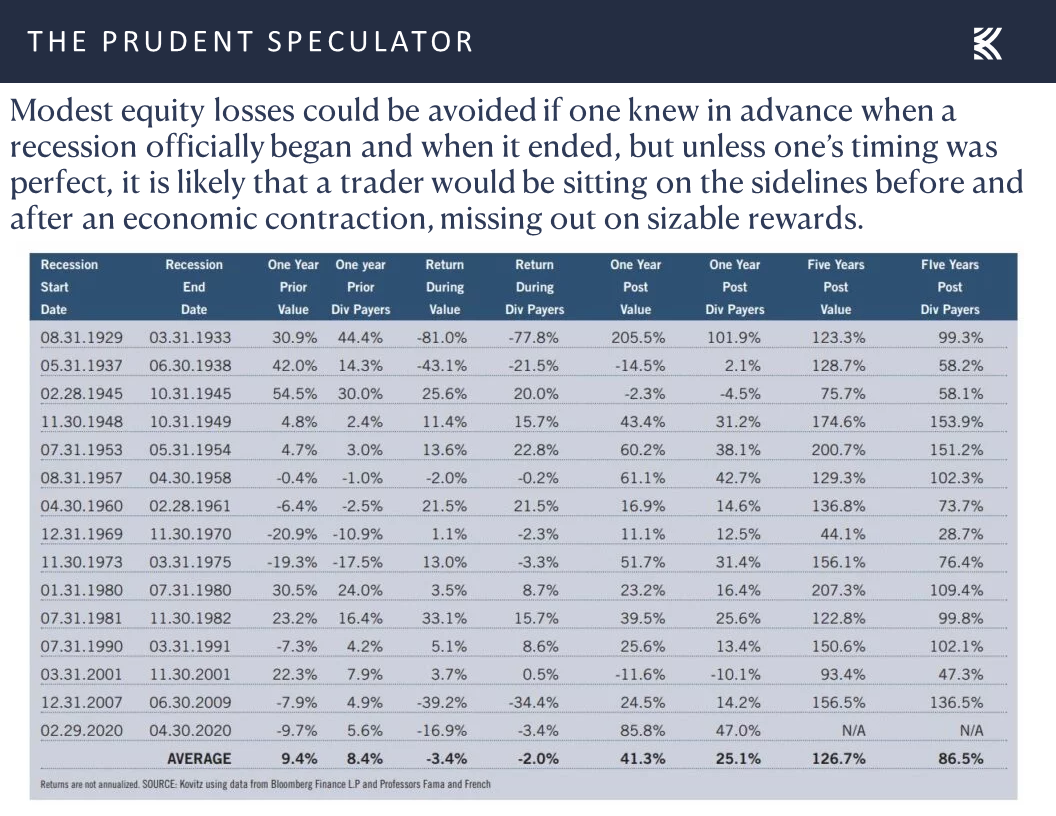
To be sure, a recession later this year remains the consensus view of economists, but we do not think such an event, if the start and end could somehow be determined in advance, is cause for long-term-oriented investors to alter their exposure to equities. After all, the average returns for Value Stocks and Dividend Payers have been favorable pre-recession and spectacular post-recession, with only modest losses, on average, during the recession.
Inflation – Lower CPI & PPI Tallies
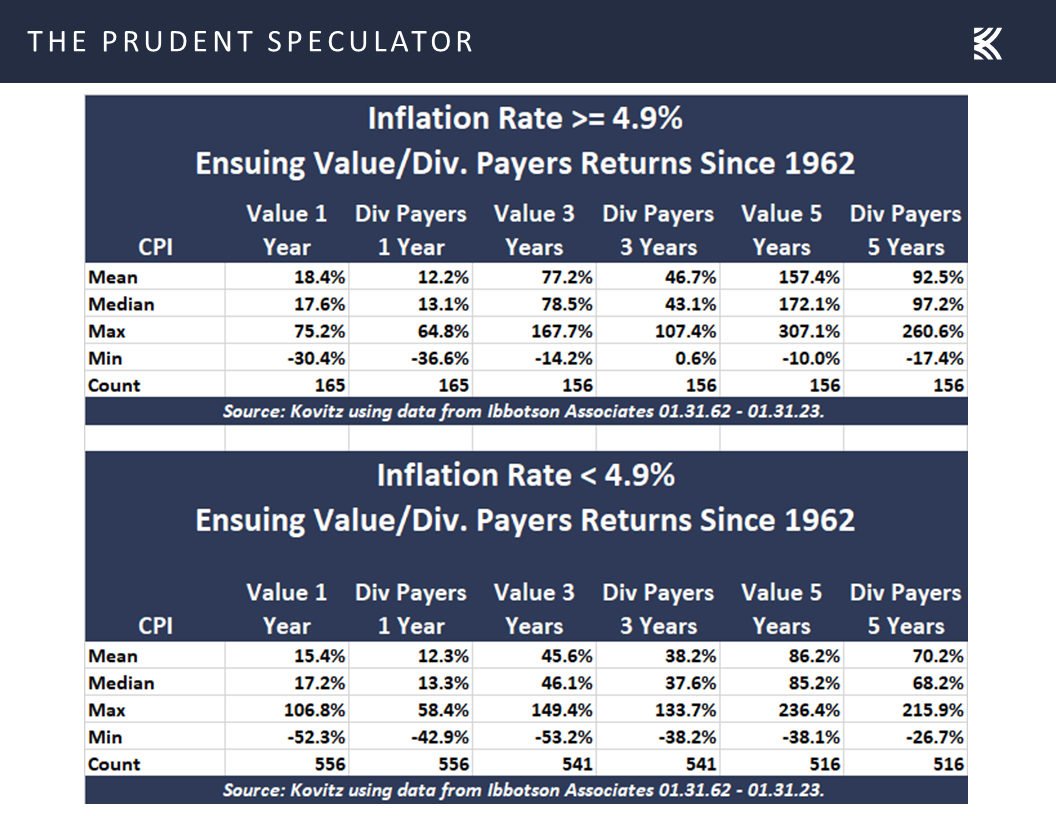
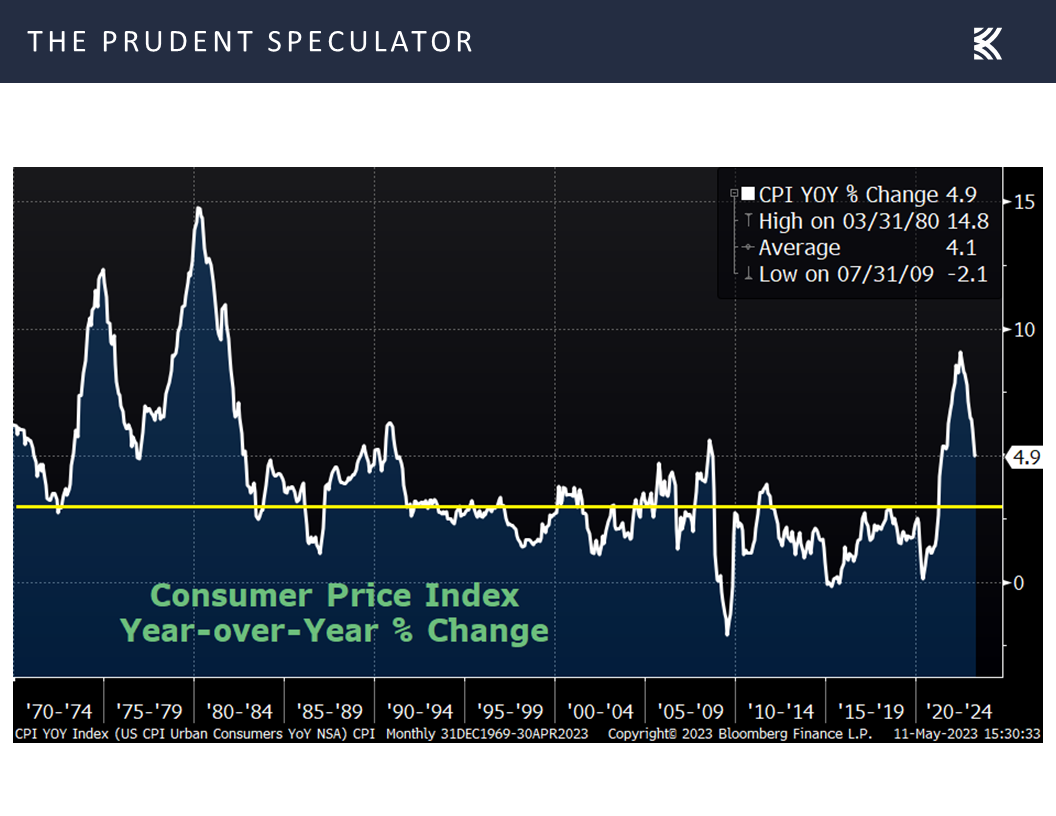
Looking at inflation, the Consumer Price Index (CPI) for April was released last week, and the barometer saw a further decline to 4.9%, down from 5.0% in March.
Of course, despite what the financial press might suggest, elevated inflation historically has not been a headwind for one-, three- and five-year average returns for Value Stocks and Dividend Payers. In fact, it has actually been a tailwind, on average!
Still, we understand that the so-called core CPI (excludes volatile food and energy) residing last month at a 5.5% year-over-year advance did little to alleviate consternation for inflation watchers, but the Producer Price Index (PPI) came in at 2.3%, the lowest year-over-year increase since January 2021.
Interest Rates – Still Low By Historical Standards
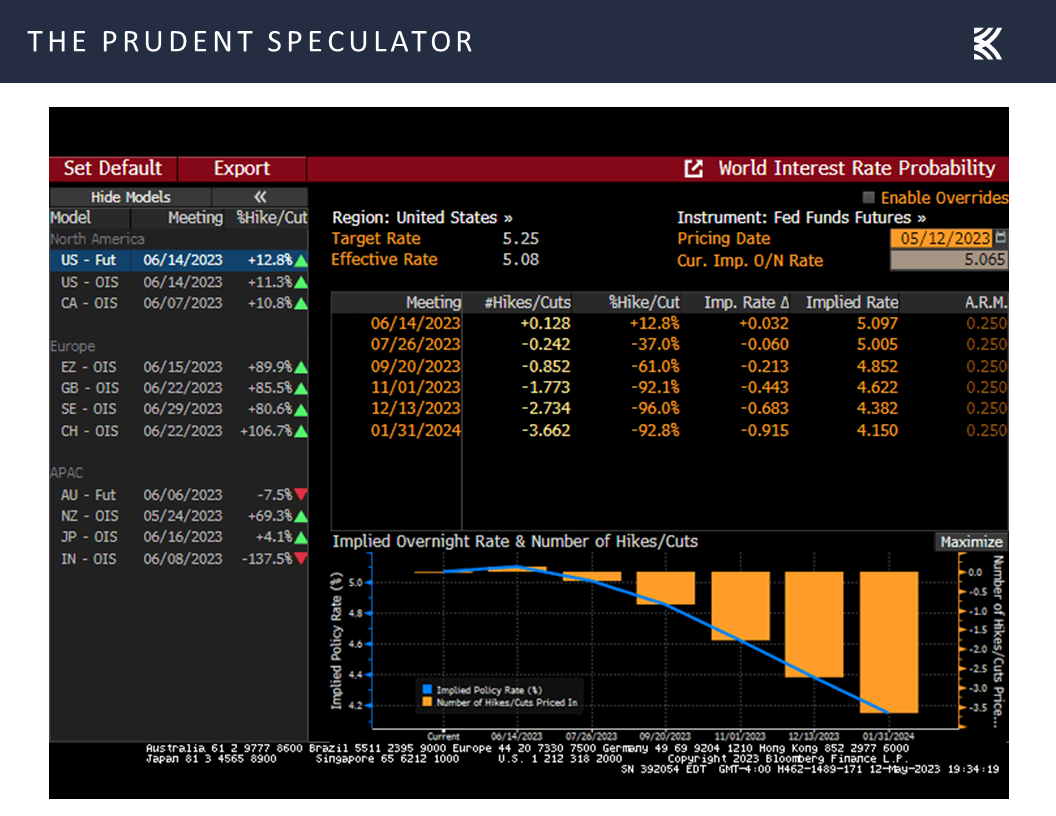
When all was said and done for the week, the market prognosis for movements in the Federal Funds rate over the balance of the year held steady. The futures market was predicting that there will be a rate cut at the July get-together of Jerome H. Powell & Co., with the year-end Fed Funds rate target dropping to 4.38%, down from the current 5.25%.
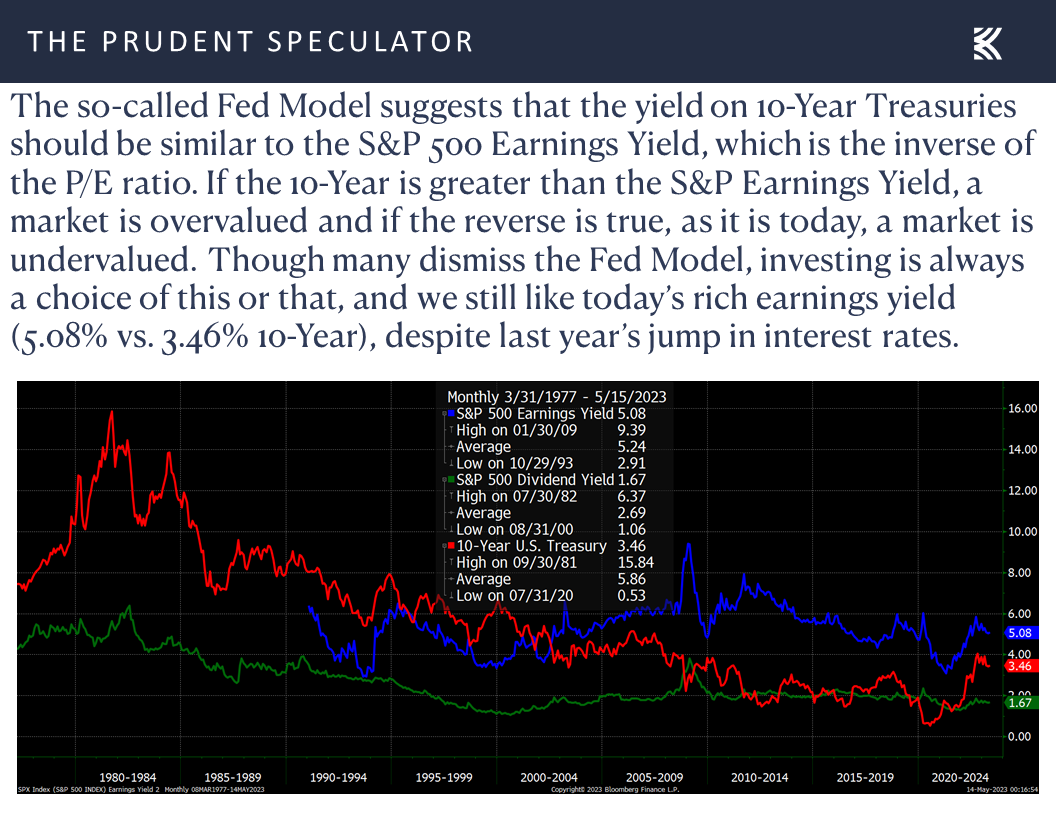
Meanwhile, the yield on the 10-Year U.S. Treasury ticked up a tad to 3.46%, but that interest rate benchmark remains well below the 5.85% average since The Prudent Speculator was launched more than 46 years ago,
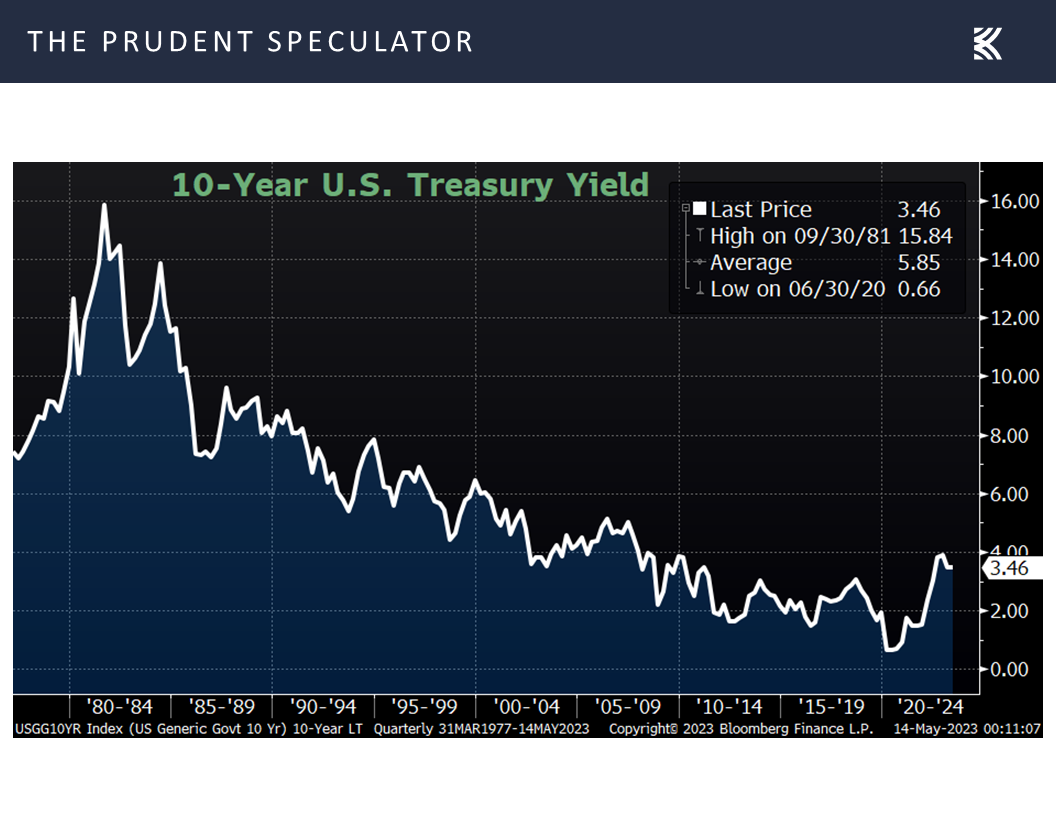
which we continue to believe supports the argument that equities are still attractively priced on a relative basis.
Regional Banks – Deposit Outflows at PacWest; but Inflows for Western Alliance; CMA Very Undervalued
Finally, we concede that news on the regional banking front was problematic, at least as far as PacWest Bancorp goes, though the same could not be said for the other West Coast bank, Western Alliance, that we discussed in our May 4 Special Report, available here.
Unfortunately, PacWest disclosed that it lost more than 9% of its deposits the week ended May 5, with the majority of the outflow the last two days of that week, following a misleading story from Bloomberg that implied the company was looking to sell itself. PacWest did also choose to slash its quarterly dividend to $0.01 per share on May 5, down from the prior rate of $0.25, but the stock closed higher on May 8, before plunging anew following the deposit news on May 11.
On the other hand, Western Alliance issued another in its series of deposit updates, stating that the Phoenix-based bank had total deposits of roughly $49.4 billion as of May 9, up $1.8 billion from $47.6 billion as of March 31 and higher than $600 million from $48.8 billion as of May 2. Western added that it had total insured deposits of 79% of total deposits as of May 9, compared to 68% as of March 31.
Alas, PacWest’s news garnered far more airplay than Western’s, and provided more ammunition for those seeking to profit from and potentially create the demise of regional banks. JPMorgan Chase (JPM – $134.10) CEO Jamie Dimon stated on Thursday, “The SEC has the enforcement capability to look at what people are doing by name in options, derivatives, short sales. If someone’s doing anything wrong, people are in collusion, or people going short and then making a tweet about a bank, they should go after them and vigorously and they should be punished to the full extent the law allows it.”
Obviously, the continued plunge in regional bank stocks has done our portfolios no favors, but the weight of the evidence continues to suggest that there is no systemic run on the banks, while we note the following tweet on May 12 from one of my favorite journalists, Michael Brush.
I’ve examined insider activity every day for > 20 years. I don’t think I’ve ever seen a sector signal as strong as the one in banking right now. There is broad buying across the group, and a lot of depth in terms of purchase size. Gee I wonder who is right here.
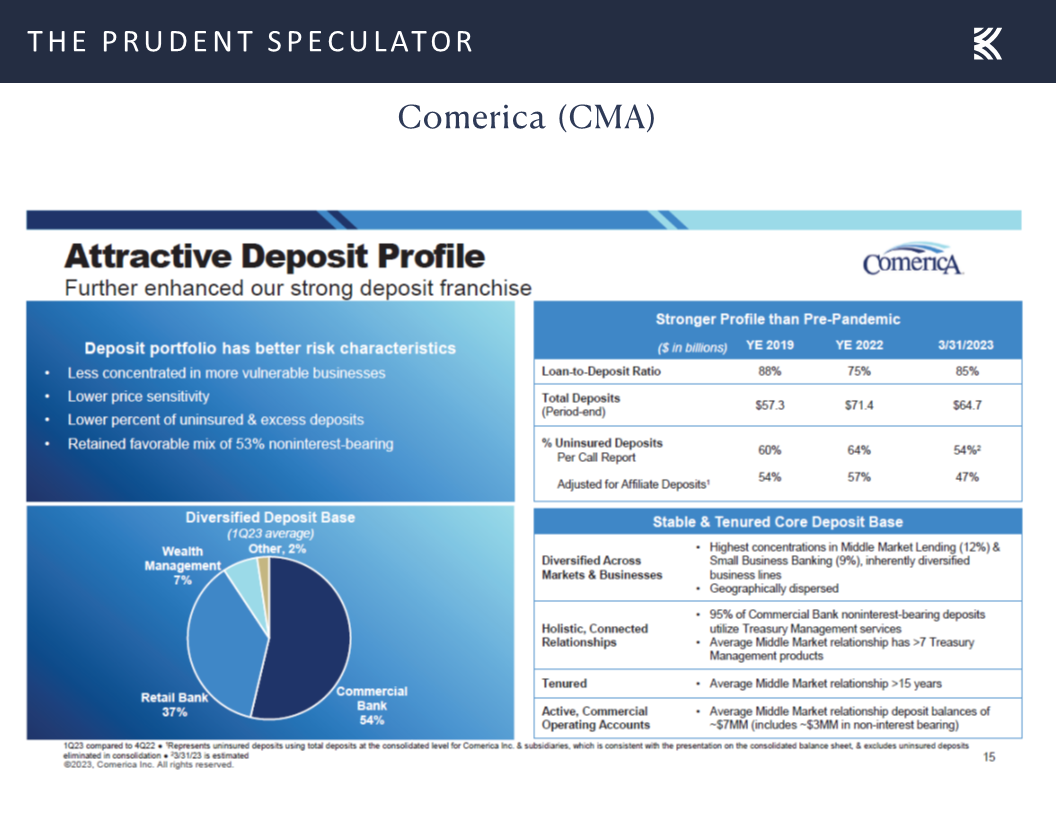
Sadly, for those who own, and happily, for those considering a new purchase, shares of Comerica (CMA – $31.97) have shed another quarter of their value since the Dallas-based regional bank reported Q1 financial results at the end of April. With offices in California, we understand some might be skeptical of Comerica, especially given that the bank is financed by a significant portion of non-interest-bearing deposits.
Comerica CEO Curt Farmer said at the end of Q1, “We successfully protected our core customer relationships as deposit pressure was largely localized to select portfolios. I feel our strong deposit franchise is now more attractive as we retained our favorable noninterest-bearing orientation diversified across multiple businesses and geographies while improving risk characteristics, thereby creating an even more consistent funding profile. In fact, relative to pre-pandemic, we have a higher level of deposits, a better loan to deposit ratio and a lower percentage of uninsured deposits. Our business model was tested, and we emerged in a better position for long-term success.”
The bank has been quiet regarding its latest deposit flows, but a presentation released at the top of May stated that 95% of Commercial Bank noninterest-bearing deposits utilize Treasury Management services. We think little details like these point to the differentiation and value Comerica offers relative to some of its peers via its advisor style relationships with small and mid-size commercial customers.
We continue to stand by our remarks from April 28 that whether due to a high exposure to variable-rate loans or its large percentage of uninsured deposits, we have long viewed Comerica as a stock with above-average risk and reward. We also note that Comerica has classified all its investment securities as available-for-sale, meaning that marks to market for to its securities portfolio are more transparent relative to some peers that have classified a portion as held-to-maturity.
Even as our exposure to the stock is now modest, we continue to believe CMA has the capital and experience to navigate the near-term regional-bank uncertainty and investors will be well rewarded in the fullness of time. Analysts still think the company can earn more than $8.00 per share this year, with the consensus estimate for 2024 standing at $7.78. The dividend was hiked at the end of February and the yield is now 8.9%, with the latest $0.71 per share quarterly payout declared on April 25. We realize that conditions can change quickly, but our Target Price for CMA is presently $76.
Valuations – Liking the Metrics for our Portfolios
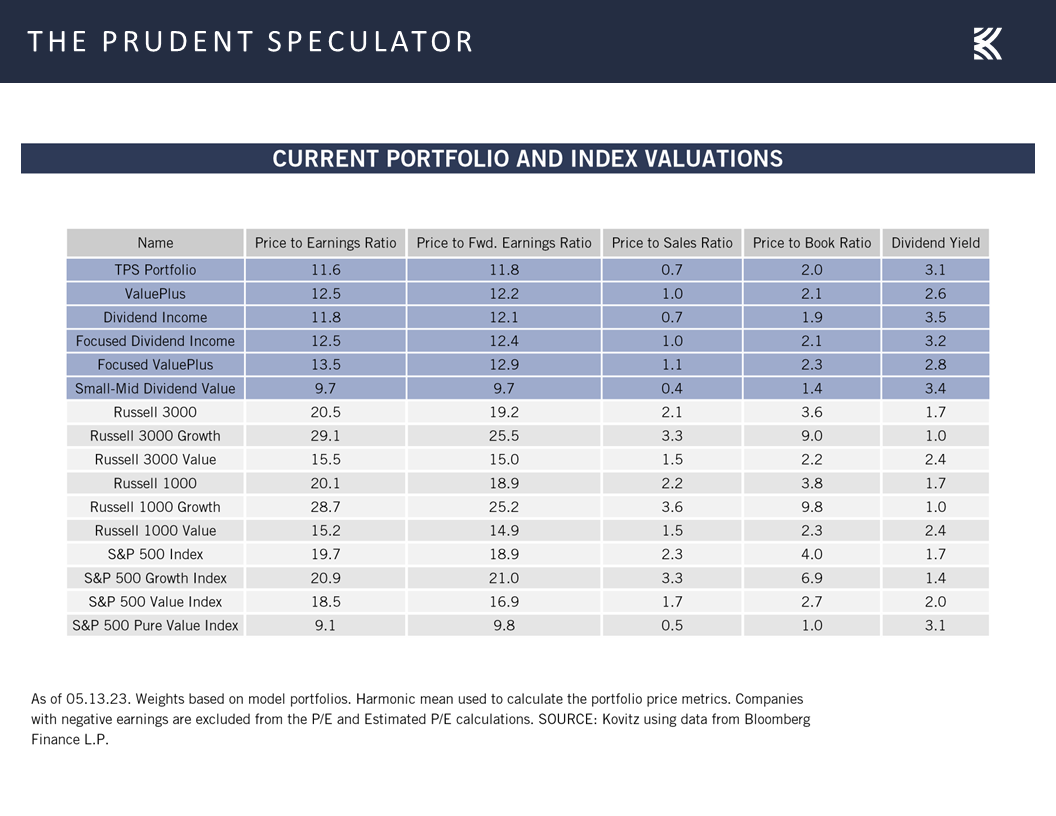
Certainly, we are braced for additional downside volatility for the equity markets, but we remain very comfortable with the reasonable valuations and generation dividend yields for our broadly diversified portfolios of what we believe to be undervalued stocks.
Market Timing – Only Problem is Getting the Timing Right
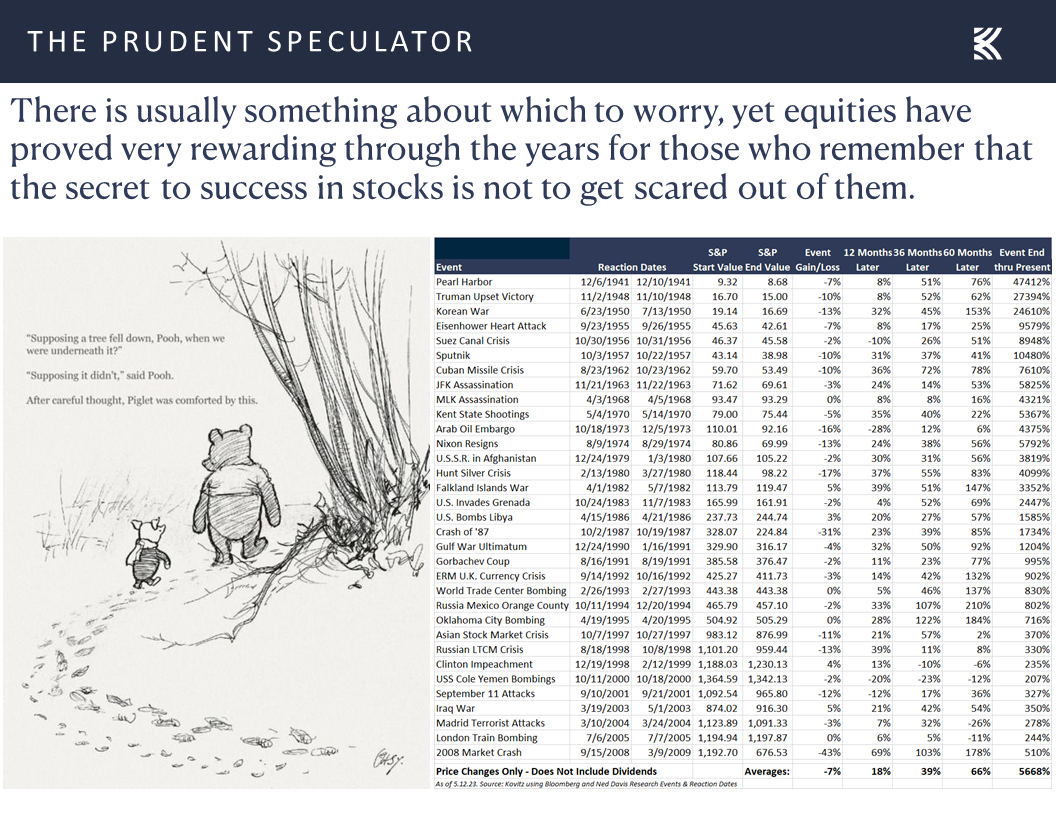
We also offer the reminder that history is filled with plenty of frightening events, yet equities have provided handsome rewards for those who stick with stocks through thick and thin.
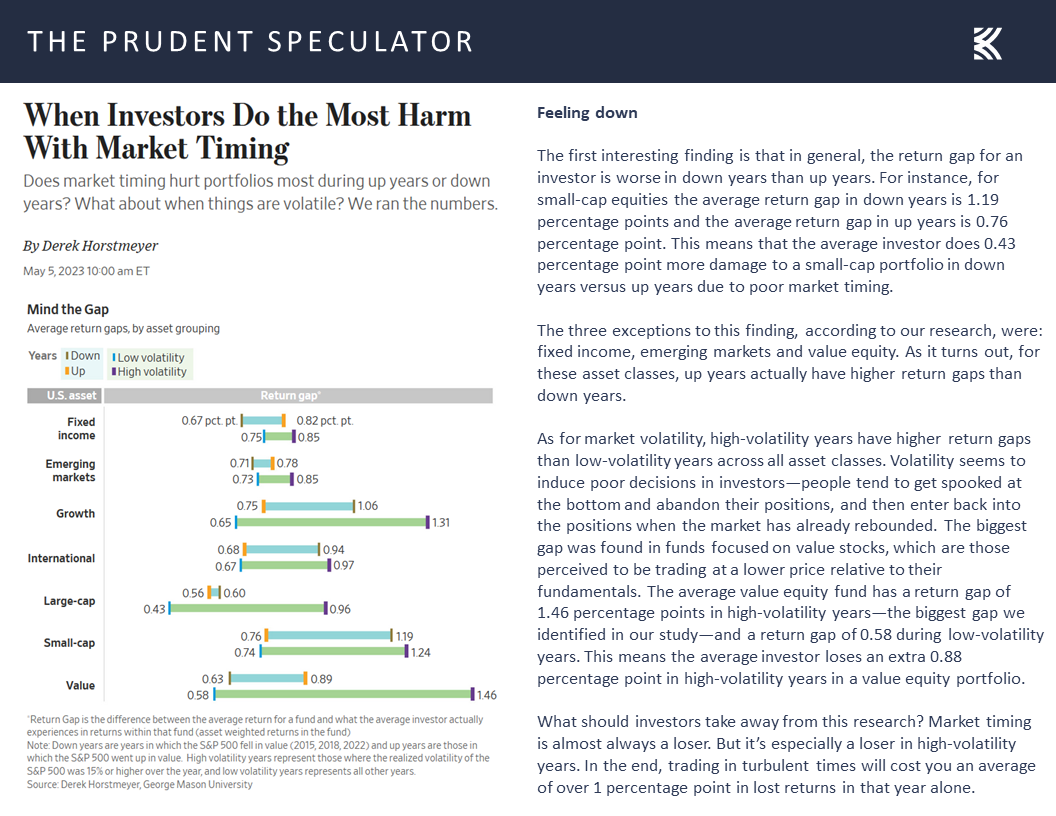
Despite the overwhelming evidence to the contrary, many think that they can outguess the ups and downs of the financial markets, yet a new study out last week from Derek Horstmeyer of George Mason University concluded, “Market timing is almost always a loser. But it’s especially a loser in high-volatility years. In the end, trading in turbulent times will cost you an average of over 1 percentage point in lost returns in that year alone.”
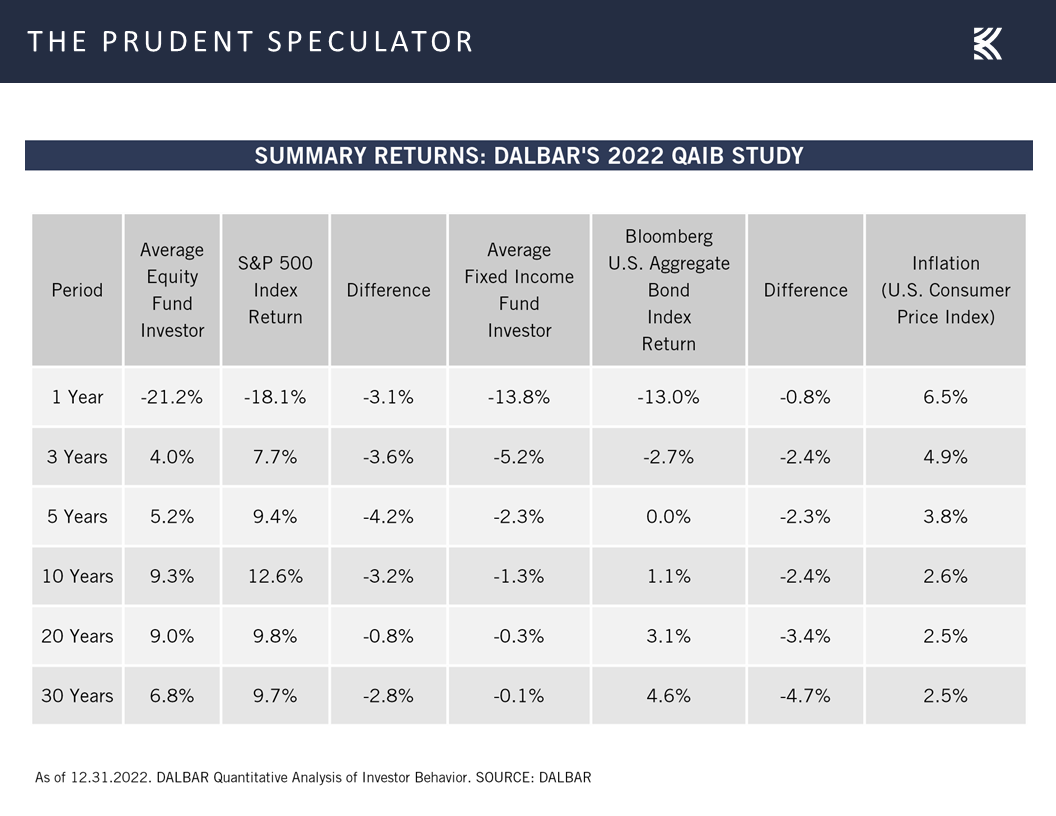
Indeed, time in the market trumps market timing, as data provider DALBAR has shown year after year with its Quantitative Analysis of Investor Behavior report. Incredibly, the latest numbers from DALBAR show that investors in fixed income funds had negative returns for the past 1, 3, 5, 10, 20 and 30 years, illustrating that it isn’t just stock investors who often end up shooting themselves in the foot.
Stock Market News: Updates on eleven stocks across eight different sectors
Keeping in mind that all stocks are rated as a “Buy” until such time as they are a “Sell,” a listing of all current recommendations is available for download via the following link:
https://theprudentspeculator.com/dashboard/. We also offer the reminder that any sales we make for our newsletter strategies are announced via our
Sales Alerts. Jason Clark, Chris Quigley and Zack Tart take a look at earnings reports and other market-moving news of note out last week for more than a few of our recommendations.

Debt Ceiling, Interest Rates, Regional Banks and More
The Prudent Speculator Weekly Commentary is expertly curated every week as a valuable resource for stock market news, investing tips, business insights, and economic trends as it relates to value stock investing. In this week’s market commentary, we discuss inflation, interest rates, regional banks, a historical perspective on the debt ceiling and more economic news. We also include a short preview of our specific stock picks for the week; the entire list is available only to our community of loyal subscribers.
Executive Summary
Week in Review – May Downturn Continues
Debt Ceiling – Historical Perspective
Recession – Weaker Econ Data, but Q2 Growth Still the Current Atlanta Fed Projection and No Reason to Panic if a Contraction Eventually Occurs
Inflation – Lower CPI & PPI Tallies
Interest Rates – Still Low By Historical Standards
Regional Banks – Deposit Outflows at PacWest; but Inflows for Western Alliance; CMA Very Undervalued
Valuations – Liking the Metrics for our Portfolios
Market Timing – Only Problem is Getting the Timing Right
Stock News – Updates on eleven stocks across eight different sectors
Week in Review – May Downturn Continues
It remained a not-so-grand start to the seasonally less favorable (it is still positive, on average, for Value Stocks and Dividend Payers) May – October period,
as the Russell 3000 Value index lost ground every day last week, following a miserable week prior in which the benchmark dropped four of the five trading days. The daily losses have been relatively modest, and we understand that volatility is a normal part of the investment process,
but we understand that there is plenty to worry about these days, including the drama in Washington over the debt ceiling.
Debt Ceiling – Historical Perspective
After all, U.S. Treasury Secretary Janet Yellen warned on Bloomberg Television on May 12, “If Congress fails to do that, it really impairs our credit rating. We have to default on some obligation, whether it’s Treasuries or payments to Social Security recipients. That’s something America hasn’t done since 1789. And we shouldn’t start now.”
As we said back in January, certainly, this sounds ominous, but this is not the first time we have had the debt ceiling hanging over our heads. In fact, as the Treasury’s website (https://home.treasury.gov/policy-issues/financial-markets-financial-institutions-and-fiscal-service/debt-limit) states, “Since 1960, Congress has acted 78 separate times to permanently raise, temporarily extend, or revise the definition of the debt limit – 49 times under Republican presidents and 29 times under Democratic presidents. Congressional leaders in both parties have recognized that this is necessary.”
No doubt, a U.S. default is not something we want to see, and it would undoubtedly lead to turmoil in the global financial markets, but here is what we wrote on the subject back in August 2011:
The debt drama in Washington is no doubt top of mind for almost every investor. Though there were initially hopes for some sort of a ‘Grand Plan’ to be struck that might see upwards of $4 trillion cut over 10 years from the country’s massive deficit, the warring parties are now trying to simply cobble something together to stave off a default prior to the somewhat arbitrary August 2nd deadline for raising the debt ceiling. As if this weren’t enough of a concern, the ratings agencies have suggested that the nation’s AAA credit rating may be downgraded even if some sort of a decent compromise is reached. Needless to say, few are happy with our supposed ‘leaders’, no matter which side of the aisle they may reside.
Not surprisingly, the political rancor has most folks on edge with reports surfacing that investors have been pulling cash from money market funds while the equity markets have been wobbling. Certainly, we do not want to make light of the debt issue, but we continue to think it highly unlikely that Uncle Sam will default on his obligations. Yes, there is a good chance that the U.S. credit rating will be downgraded, but we doubt that we will see a big change in the yields on Treasuries. The reason for this is that there is little place else for investors to go as those seeking the safety and yield of a supposedly risk-free (assuming the security is held to maturity) asset are unlikely to bail out of their Treasury investments.
Don’t believe me? Take a look at where things stand on the benchmark 10-Year U.S. Treasury as of July 29. Clearly, if investors thought that there was a risk of the government not making good on its interest and principal payments, yields would have spiked significantly higher, rather than touching their low for the year at 2.80%.
And, believe it or not, we’ve been down this road before. Consider the following commentary:
Republicans in Congress have vowed not to raise the debt ceiling until the President agrees to their plans to trim federal spending. The President has said he will not be blackmailed into agreeing to the GOP program.
The Treasury Secretary has said it is irresponsible for Republicans to hold the debt ceiling hostage in the budget debate because even the risk of a government default on its debt could cause turmoil in financial markets
“For all their loose talk,” Mr. Clinton said, “the Congressional leaders know that if they were to allow us to go into default, this would have a severe impact on our economy, on financial markets, and on the interest rates paid by government, business and homeowners.”
Hopefully, the quote from President Clinton gave away that the time period was November 1995 when the U.S. government had to put non-essential government workers on furlough and suspend non-essential services. While not quite the same situation we are facing today, the debt ceiling was the big sticking point back then and Washington was actually able to reopen for business five days after the initial ‘non-essential’ measures were taken. Of course, a deal still could not be reached and the government actually shut down completely four weeks later in an event that lasted from December 16, 1995 to January 6, 1996. Treasuries performed very well (yields actually moved lower!) during that turbulent time.
But stocks must have taken it on the chin, right? Well, there were definitely some rocky periods, but equities moved nicely higher with the large-cap S&P 500 advancing more than 15% from August 1995 through February 1996!
At the end of the day, we do expect some sort of deal on the debt ceiling to be reached, but we concede that there likely will be plenty of drama between now and then, while we remember that there have been 37 corrections of 10% or greater for the S&P 500 since we started publishing The Prudent Speculator in March 1977.
Happily, there have been 38 rallies of more than 10% in that index over the past 46 years, with the average gain in the times in the green dwarfing the average loss in the periods in the red. And, shifting back to Value stocks, we should point out that the Russell 3000 Value index (data for which begins in 1995) has had a 200% total return, or 9.77% per annum, since the July 2011 debt-ceiling scare, and an 851% total return, or 8.55% per annum, since the one in 1995.
Recession – Weaker Econ Data, but Q2 Growth Still the Current Atlanta Fed Projection and No Reason to Panic if a Contraction Eventually Occurs
We certainly do not mean to downplay the concerns of investors, as fears of recession, elevated inflation, higher interest rates and the banking turmoil are additional bogeymen now spooking folks. Looking at the latest developments on each of those fronts, we note that the odds of an economic contraction have remained at 65% for a while now,
though the exceedingly robust labor situation has shown a few cracks with the number of first-time filings for unemployment benefits rising in the latest week to a greater-than-expected 264,000, even as this tally is well below the historical average.
We also had the first read for May on the health of the consumer with the University of Michigan’s sentiment gauge dropping to 57.7, one of the weakest tallies on record,
yet the latest estimate from the Atlanta Fed for Q2 real GDP growth (yes, growth!) stood at a healthy 2.7%,
which is part of the reason that the outlook for corporate profits for the S&P 500 from Standard & Poor’s itself remains very good. Indeed, bottom-up operating EPS is projected to grow from $196.95 in 2022 to $218.86 in 2023 and $244.26 in 2024. For its part, Bloomberg has comparable estimates for 2023 and 2024.
To be sure, a recession later this year remains the consensus view of economists, but we do not think such an event, if the start and end could somehow be determined in advance, is cause for long-term-oriented investors to alter their exposure to equities. After all, the average returns for Value Stocks and Dividend Payers have been favorable pre-recession and spectacular post-recession, with only modest losses, on average, during the recession.
Inflation – Lower CPI & PPI Tallies
Looking at inflation, the Consumer Price Index (CPI) for April was released last week, and the barometer saw a further decline to 4.9%, down from 5.0% in March.
Of course, despite what the financial press might suggest, elevated inflation historically has not been a headwind for one-, three- and five-year average returns for Value Stocks and Dividend Payers. In fact, it has actually been a tailwind, on average!
Still, we understand that the so-called core CPI (excludes volatile food and energy) residing last month at a 5.5% year-over-year advance did little to alleviate consternation for inflation watchers, but the Producer Price Index (PPI) came in at 2.3%, the lowest year-over-year increase since January 2021.
Interest Rates – Still Low By Historical Standards
When all was said and done for the week, the market prognosis for movements in the Federal Funds rate over the balance of the year held steady. The futures market was predicting that there will be a rate cut at the July get-together of Jerome H. Powell & Co., with the year-end Fed Funds rate target dropping to 4.38%, down from the current 5.25%.
Meanwhile, the yield on the 10-Year U.S. Treasury ticked up a tad to 3.46%, but that interest rate benchmark remains well below the 5.85% average since The Prudent Speculator was launched more than 46 years ago,
which we continue to believe supports the argument that equities are still attractively priced on a relative basis.
Regional Banks – Deposit Outflows at PacWest; but Inflows for Western Alliance; CMA Very Undervalued
Finally, we concede that news on the regional banking front was problematic, at least as far as PacWest Bancorp goes, though the same could not be said for the other West Coast bank, Western Alliance, that we discussed in our May 4 Special Report, available here.
Unfortunately, PacWest disclosed that it lost more than 9% of its deposits the week ended May 5, with the majority of the outflow the last two days of that week, following a misleading story from Bloomberg that implied the company was looking to sell itself. PacWest did also choose to slash its quarterly dividend to $0.01 per share on May 5, down from the prior rate of $0.25, but the stock closed higher on May 8, before plunging anew following the deposit news on May 11.
On the other hand, Western Alliance issued another in its series of deposit updates, stating that the Phoenix-based bank had total deposits of roughly $49.4 billion as of May 9, up $1.8 billion from $47.6 billion as of March 31 and higher than $600 million from $48.8 billion as of May 2. Western added that it had total insured deposits of 79% of total deposits as of May 9, compared to 68% as of March 31.
Alas, PacWest’s news garnered far more airplay than Western’s, and provided more ammunition for those seeking to profit from and potentially create the demise of regional banks. JPMorgan Chase (JPM – $134.10) CEO Jamie Dimon stated on Thursday, “The SEC has the enforcement capability to look at what people are doing by name in options, derivatives, short sales. If someone’s doing anything wrong, people are in collusion, or people going short and then making a tweet about a bank, they should go after them and vigorously and they should be punished to the full extent the law allows it.”
Obviously, the continued plunge in regional bank stocks has done our portfolios no favors, but the weight of the evidence continues to suggest that there is no systemic run on the banks, while we note the following tweet on May 12 from one of my favorite journalists, Michael Brush.
I’ve examined insider activity every day for > 20 years. I don’t think I’ve ever seen a sector signal as strong as the one in banking right now. There is broad buying across the group, and a lot of depth in terms of purchase size. Gee I wonder who is right here.
Sadly, for those who own, and happily, for those considering a new purchase, shares of Comerica (CMA – $31.97) have shed another quarter of their value since the Dallas-based regional bank reported Q1 financial results at the end of April. With offices in California, we understand some might be skeptical of Comerica, especially given that the bank is financed by a significant portion of non-interest-bearing deposits.
Comerica CEO Curt Farmer said at the end of Q1, “We successfully protected our core customer relationships as deposit pressure was largely localized to select portfolios. I feel our strong deposit franchise is now more attractive as we retained our favorable noninterest-bearing orientation diversified across multiple businesses and geographies while improving risk characteristics, thereby creating an even more consistent funding profile. In fact, relative to pre-pandemic, we have a higher level of deposits, a better loan to deposit ratio and a lower percentage of uninsured deposits. Our business model was tested, and we emerged in a better position for long-term success.”
The bank has been quiet regarding its latest deposit flows, but a presentation released at the top of May stated that 95% of Commercial Bank noninterest-bearing deposits utilize Treasury Management services. We think little details like these point to the differentiation and value Comerica offers relative to some of its peers via its advisor style relationships with small and mid-size commercial customers.
We continue to stand by our remarks from April 28 that whether due to a high exposure to variable-rate loans or its large percentage of uninsured deposits, we have long viewed Comerica as a stock with above-average risk and reward. We also note that Comerica has classified all its investment securities as available-for-sale, meaning that marks to market for to its securities portfolio are more transparent relative to some peers that have classified a portion as held-to-maturity.
Even as our exposure to the stock is now modest, we continue to believe CMA has the capital and experience to navigate the near-term regional-bank uncertainty and investors will be well rewarded in the fullness of time. Analysts still think the company can earn more than $8.00 per share this year, with the consensus estimate for 2024 standing at $7.78. The dividend was hiked at the end of February and the yield is now 8.9%, with the latest $0.71 per share quarterly payout declared on April 25. We realize that conditions can change quickly, but our Target Price for CMA is presently $76.
Valuations – Liking the Metrics for our Portfolios
Certainly, we are braced for additional downside volatility for the equity markets, but we remain very comfortable with the reasonable valuations and generation dividend yields for our broadly diversified portfolios of what we believe to be undervalued stocks.
Market Timing – Only Problem is Getting the Timing Right
We also offer the reminder that history is filled with plenty of frightening events, yet equities have provided handsome rewards for those who stick with stocks through thick and thin.
Despite the overwhelming evidence to the contrary, many think that they can outguess the ups and downs of the financial markets, yet a new study out last week from Derek Horstmeyer of George Mason University concluded, “Market timing is almost always a loser. But it’s especially a loser in high-volatility years. In the end, trading in turbulent times will cost you an average of over 1 percentage point in lost returns in that year alone.”
Indeed, time in the market trumps market timing, as data provider DALBAR has shown year after year with its Quantitative Analysis of Investor Behavior report. Incredibly, the latest numbers from DALBAR show that investors in fixed income funds had negative returns for the past 1, 3, 5, 10, 20 and 30 years, illustrating that it isn’t just stock investors who often end up shooting themselves in the foot.
Stock Market News: Updates on eleven stocks across eight different sectors
About the Author
The Prudent Speculator
Explore
Popular Posts
Connect
Subscribe For Free Stock Picks
Get expert investing tips and market insights delivered straight to your inbox.