The Prudent Speculator Weekly Commentary is expertly curated every week as a valuable resource for stock market news, investing tips, business insights, and economic trends as it relates to value stock investing. In this week’s market commentary, we discuss the Economic Outlook, Historical Evidence, Interest Rates, Valuations and more. We also include a short preview of our specific stock picks for the week; the entire list is available only to our community of loyal subscribers.
Executive Summary
Newsletter Trades – 8 Buys for 4 Portfolios
Econ Stats – Mixed Numbers & Market Doesn’t Know Which Way to Go
Econ Outlook – Growth, Recession, Toss a Coin
Interest Rates – Little Change in Fed Rate Hike Expectations but Treasury Yields Jump
Inflation – Long-Term Consumer Expectations Remain Well Anchored
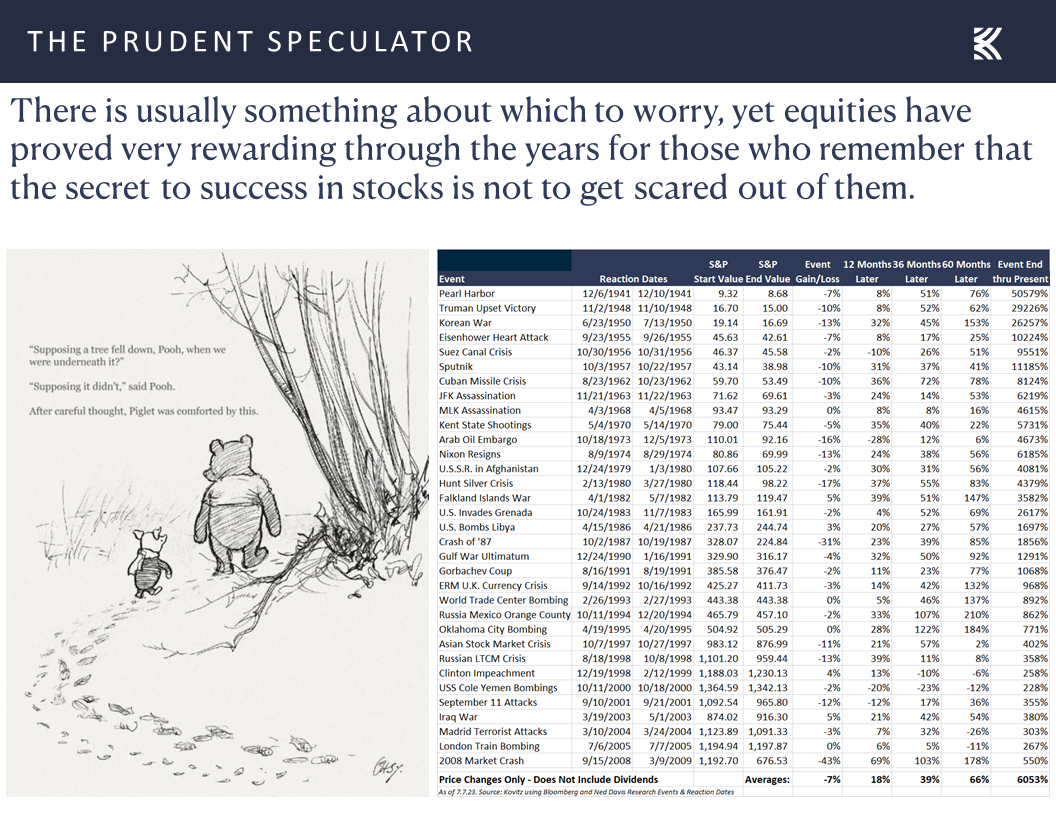
Long-Term Rewards – Plenty of Scary Events and Numerous Ups and Downs But Equity Trend Has Been Up
Valuations – Stocks, Especially Value, Remain Reasonably Priced
Historical Evidence – Value Stocks Perform Well, On Average, Whether Interest are Rising/Falling or High/Low
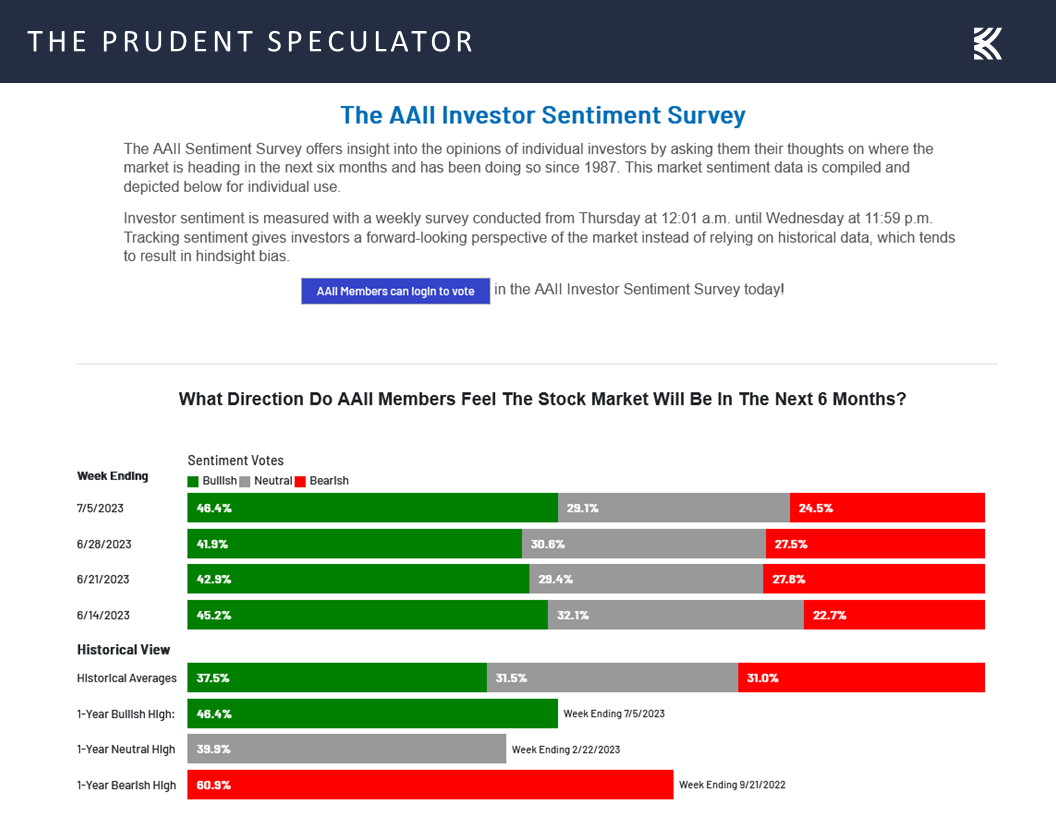
Sentiment – AAII Bullishness is Elevated
Valuations – Value Stocks Reasonably Priced
Market of Stocks – TPS Year-to-Date Winners/Losers
Stock News – Updates on GM, XOM & META
Econ Stats – Mixed Numbers & Market Doesn’t Know Which Way to Go
Given that noted economist John Kenneth Galbraith once proclaimed, “The only function of economic forecasting is to make astrology look respectable,” we might think it would be great to have a crystal ball that could provide the latest economic statistics ahead of time. After all, having advance knowledge of the numbers could surely lead to riches in the financial markets, no?
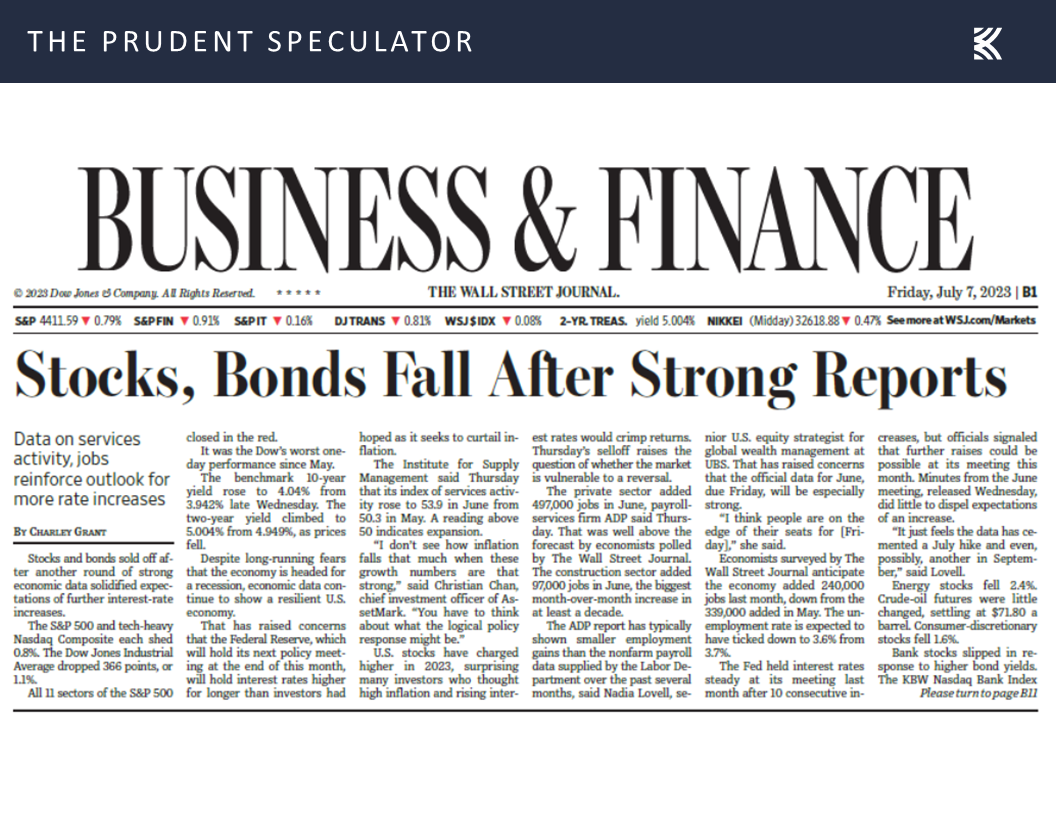
Such clairvoyance, we might argue, actually could be hazardous to one’s wealth, as one never can be certain how stocks and bonds might react to the data. Sometimes, weaker economic figures can lead to a market rally and vice-versa, with the headline, “Stocks, Bonds Fall After Strong Reports” from The Wall Street Journal’s July 7, 2023, edition illustrating the point.
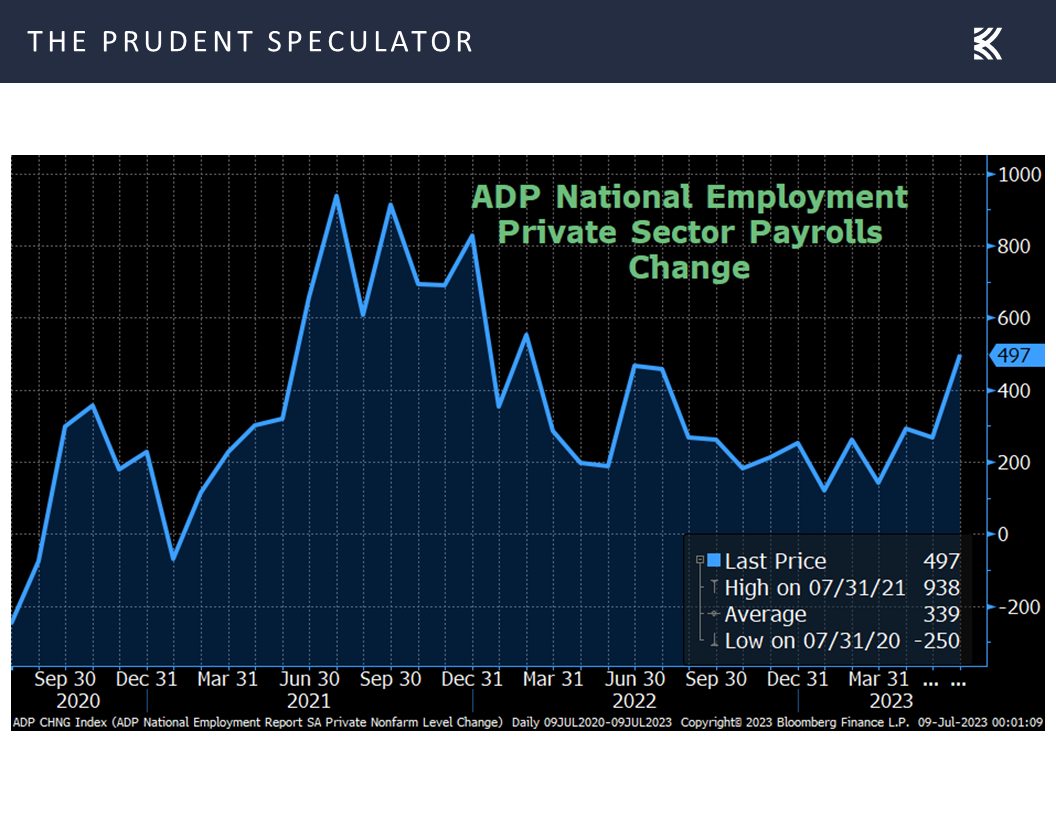
The “strong reports” on July 6 included a much-better-than-expected read on U.S. private sector employment, as the ADP monthly payrolls report for June saw the creation of 497,000 jobs, far above forecasts for 220,000. “Consumer-facing service industries had a strong June, aligning to push job creation higher than expected. But wage growth continues to ebb in these same industries, and hiring likely is cresting after a late-cycle surge,” explained Nela Richardson, ADP Chief Economist.
Compounding that good news, oops bad news, was word from the Institute for Supply Management (ISM) that the Non-Manufacturing Index (Services PMI) for June came in at 53.9, up from 50.2 in May and well above projections of 51.3. Chair of the ISM Services Business Survey Committee Anthony Nieves explained, “There has been an uptick in the rate of growth for the services sector. This is due mostly to the increase in business activity, new orders and employment. Increased capacity, backlog reduction and continued improvements in logistics have impacted delivery times (resulting in a decrease in the Supplier Deliveries Index). The majority of respondents indicate that business conditions remain stable; however, they are cautious relative to inflation and the future economic outlook.”
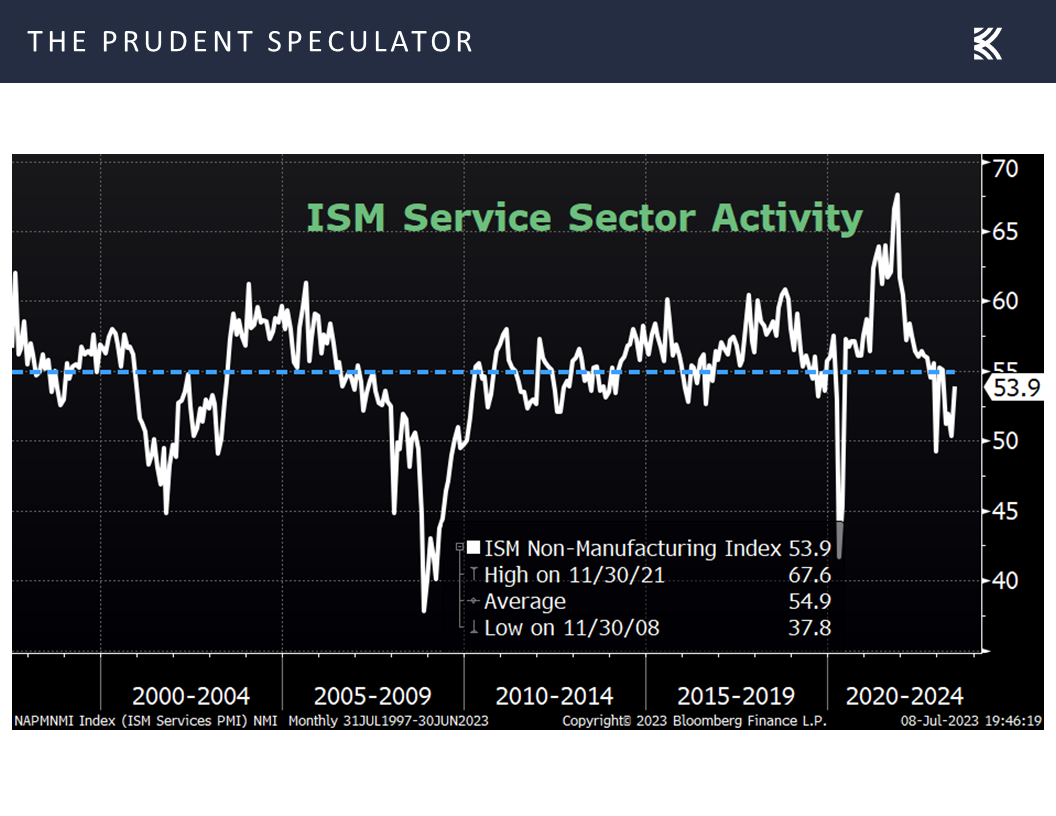
Mr Nieves added, “A Services PMI® above 49.9 percent, over time, generally indicates an expansion of the overall economy. Therefore, the June Services PMI® indicates the overall economy is growing for the sixth consecutive month after one month of contraction in December. The past relationship between the Services PMI® and the overall economy indicates that the Services PMI® for June (53.9 percent) corresponds to a 1.4-percent increase in real gross domestic product (GDP) on an annualized basis.”
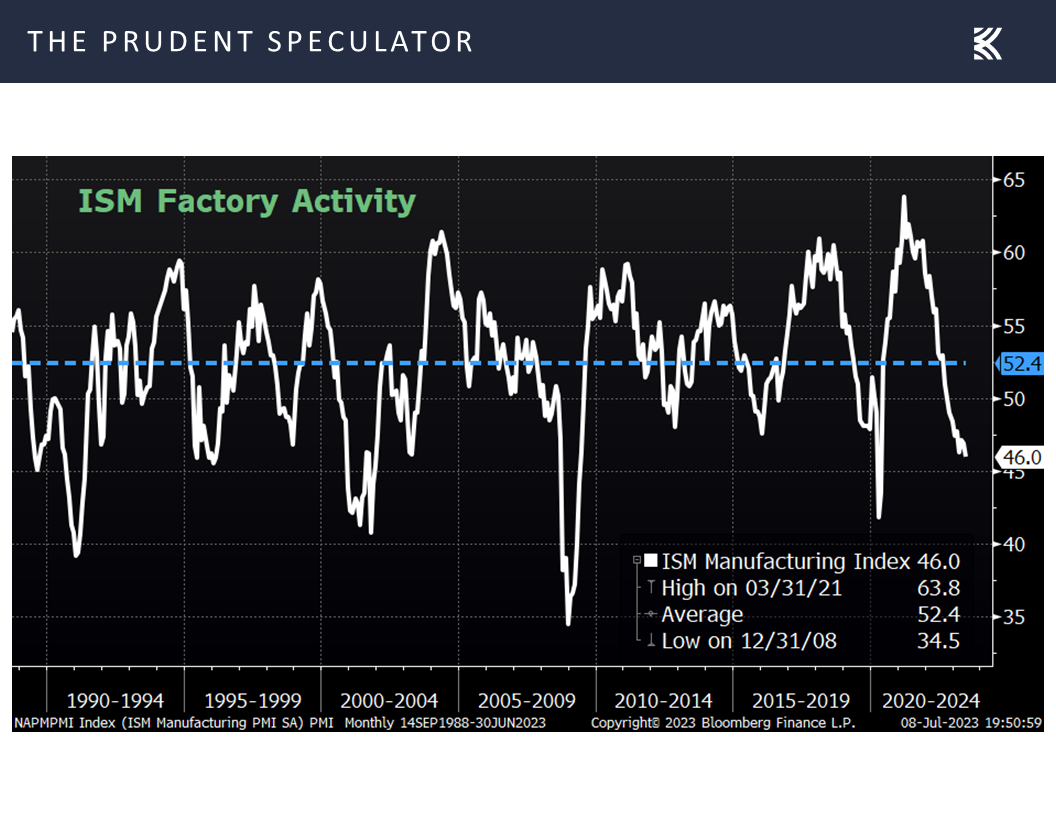
Lest folks decide that economic growth might be too robust, earlier in the week, ISM reported that its index of factory activity (Manufacturing PMI) retreated to 46.0 in June, down from 46.9 in May and below estimates of 47.3. Chair of the ISM Manufacturing Business Survey Committee Timothy R. Fiore stated, “The U.S. manufacturing sector shrank again, with the Manufacturing PMI® losing ground compared to the previous month, indicating a faster rate of contraction. The June composite index reading reflects companies continuing to manage outputs down as softness continues and optimism about the second half of 2023 weakens.”
Mr. Fiore added, “A Manufacturing PMI® above 48.7 percent, over a period of time, generally indicates an expansion of the overall economy. Therefore, the June Manufacturing PMI® indicates the overall economy contracted in June for a seventh consecutive month after 30 straight months of expansion. The past relationship between the Manufacturing PMI® and the overall economy indicates that the June reading (46 percent) corresponds to a change of minus-1 percent in real gross domestic product (GDP) on an annualized basis.”
Econ Outlook – Growth, Recession, Toss a Coin
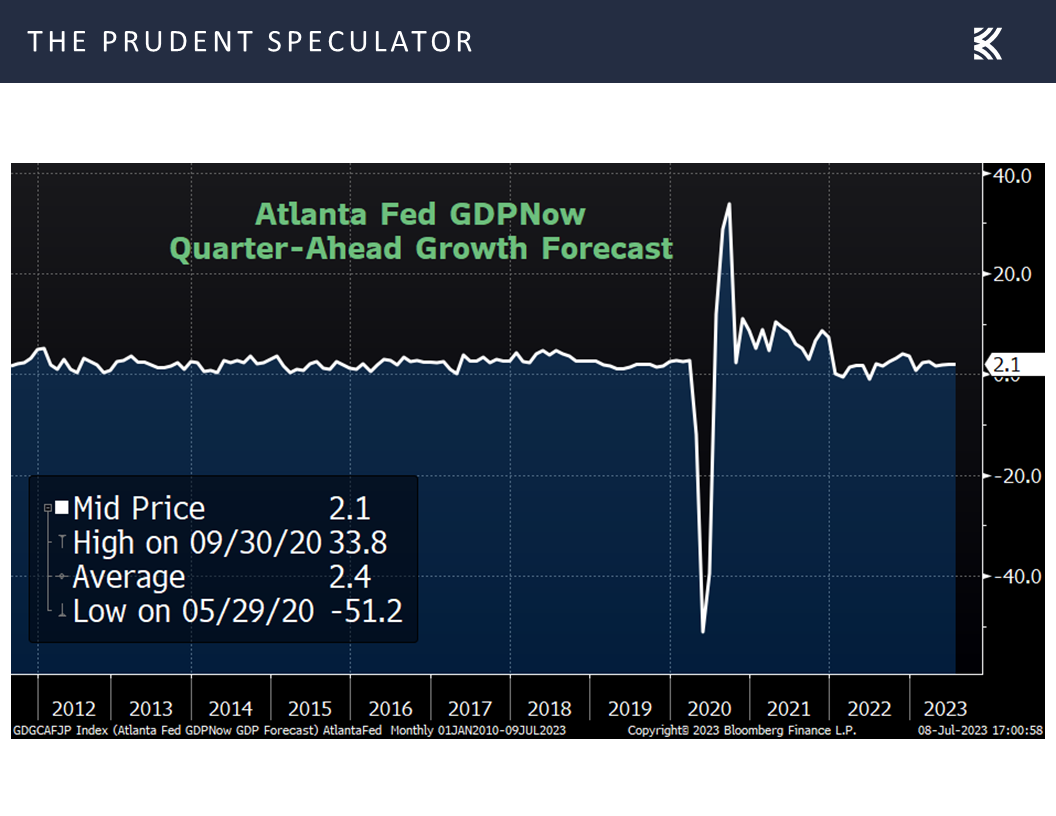
Either the economy will grow on a real basis…or it will contract, with the uncertainty confirmed by the latest estimate for Q2 GDP growth from the Atlanta Fed climbing to 2.1% this past week,
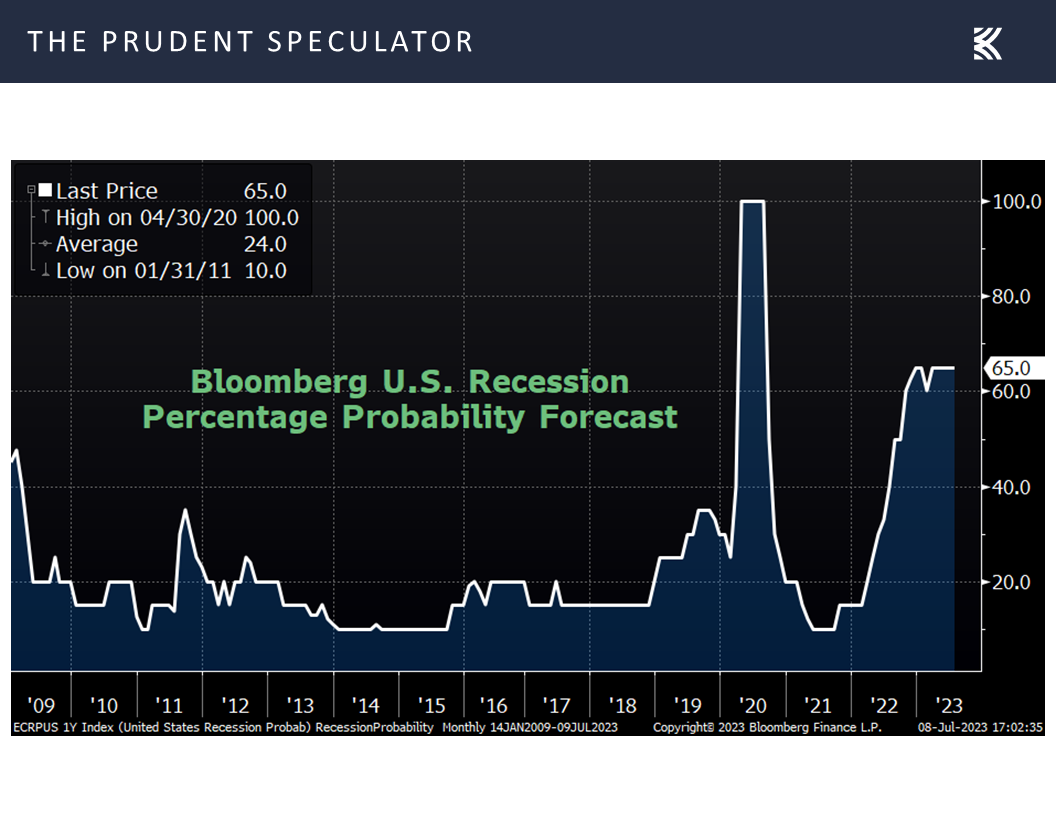
and the odds of recession over the ensuing 12 months, as tabulated by Bloomberg, continuing to reside at 65%.
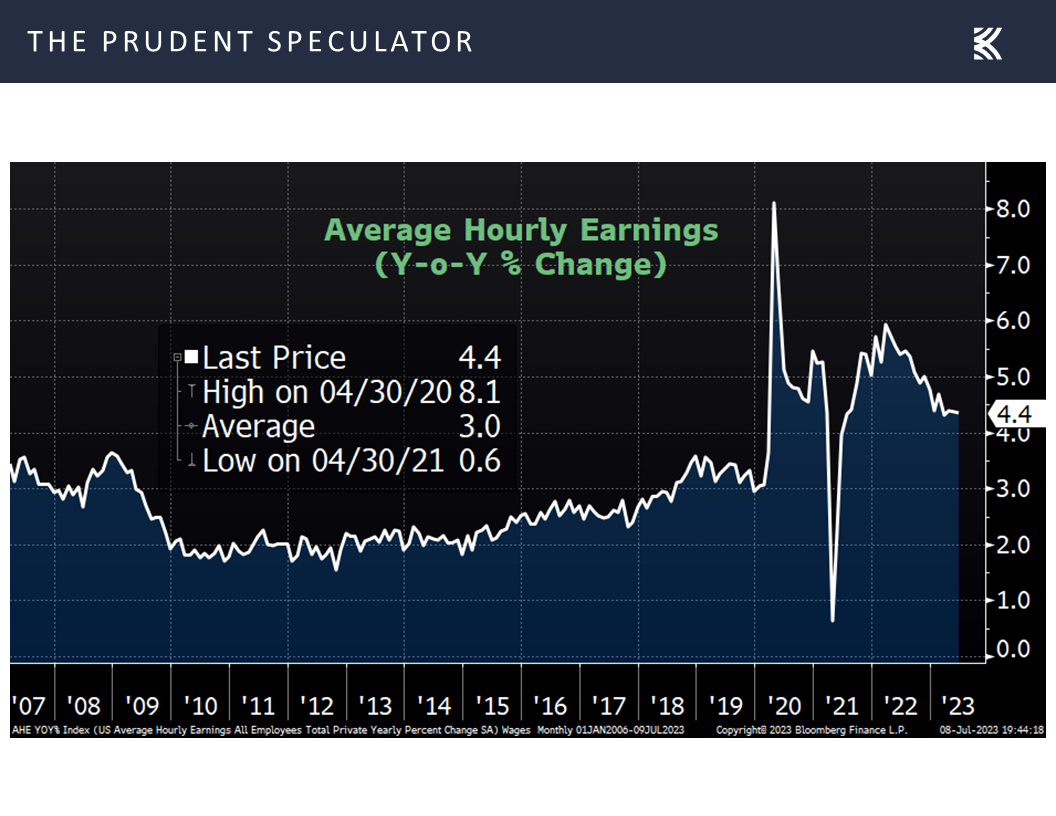
Friday’s trading activity provided more evidence that the economic outlook is as clear as mud, given the reaction of equities to the important monthly jobs report from the Labor Department. Stocks sold off on the open, supposedly on concerns that wage growth ticked up by 0.4% in June, above the consensus forecast of 0.3%. While the increase seemingly heightened concerns about inflation, the year-over-year increase held steady at 4.4%
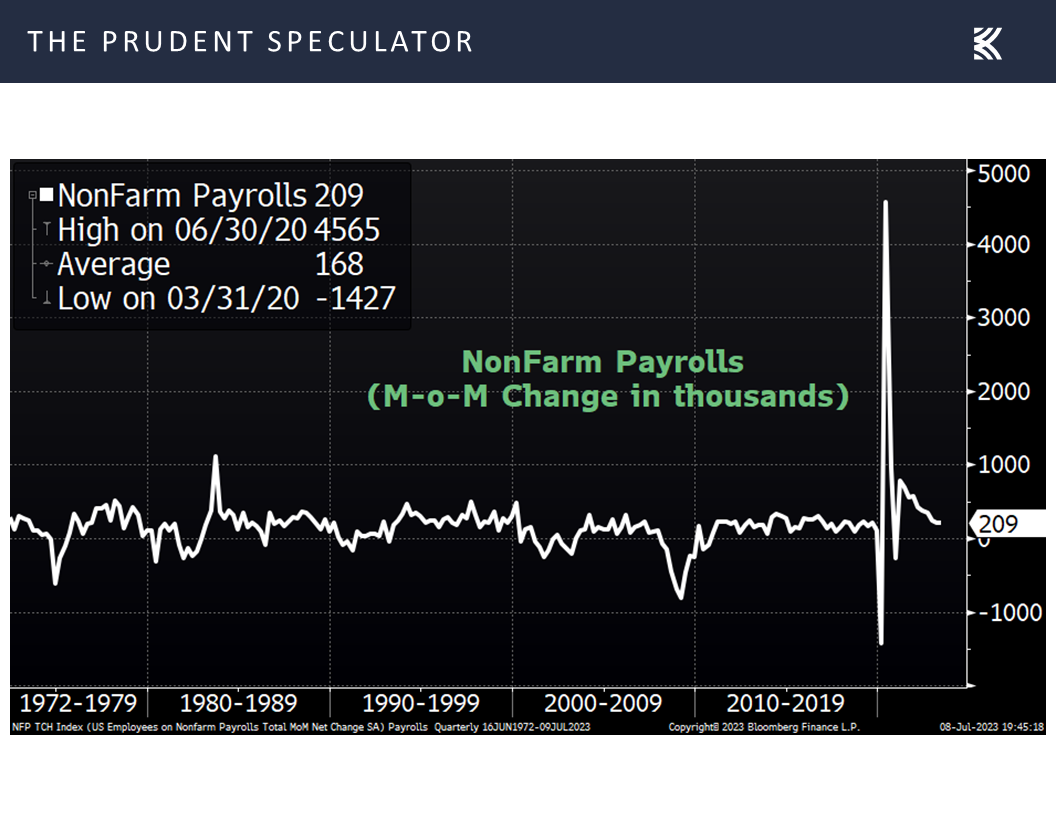
and the number of new jobs created in June was “only” 209,000, below expectations of a 240,000 increase, while the April and May figures were revised lower,
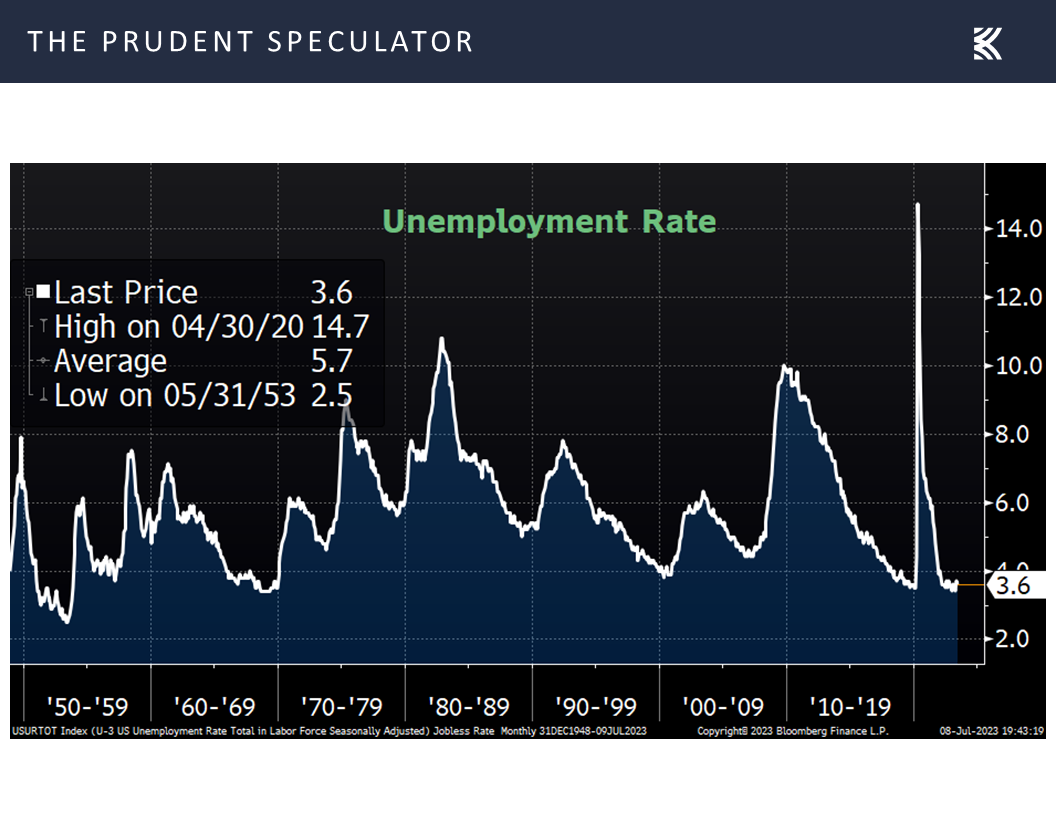
even as the employment rate edged down to 3.6% from 3.7% the month prior.
The realization that the labor market had cooled somewhat arguably led to a mid-day rally as all major market indexes were in the green at one point. However, the large-cap stock advance faded into the close, so much so that the headlines for the day were that equities ended modestly in the red, even as the average stock closed modestly higher and the small-cap Russell 2000 finished up more than 1%.
Interest Rates – Little Change in Fed Rate Hike Expectations but Treasury Yields Jump
Needless to say, there is plenty of uncertainty these days in regard to the economy and actions the Federal Reserve might take in its fight with inflation. For example, The New York Times had this to say following the release of the minutes last week from the June meeting of the Federal Open Market Committee,…
While “almost all” Fed officials thought it was “appropriate or acceptable” to leave rates unchanged in June, “some” either favored raising interest rates or “could have supported such a proposal” given continued strength in the labor market, persistent momentum in the economy, and “few clear signs” that inflation was getting back on track, the minutes showed.
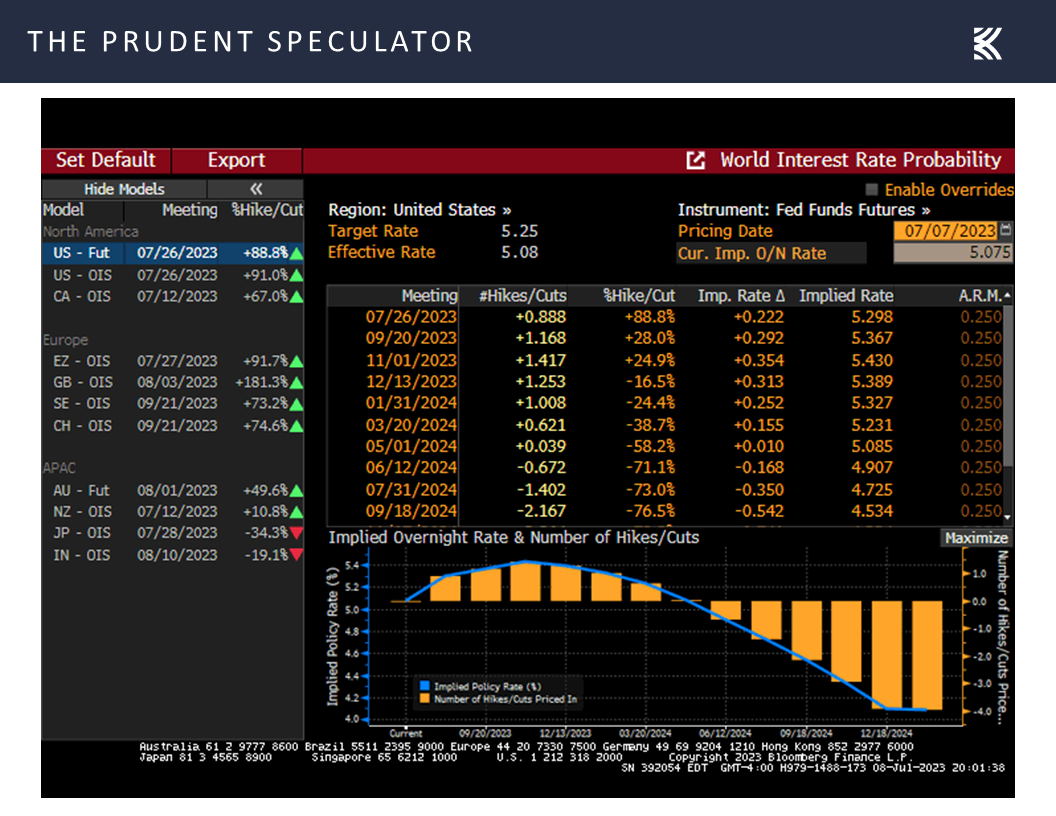
but market expectations for additional Fed rate hikes this year (5.39% year-end rate vs. 5.38% a week ago) were little changed,
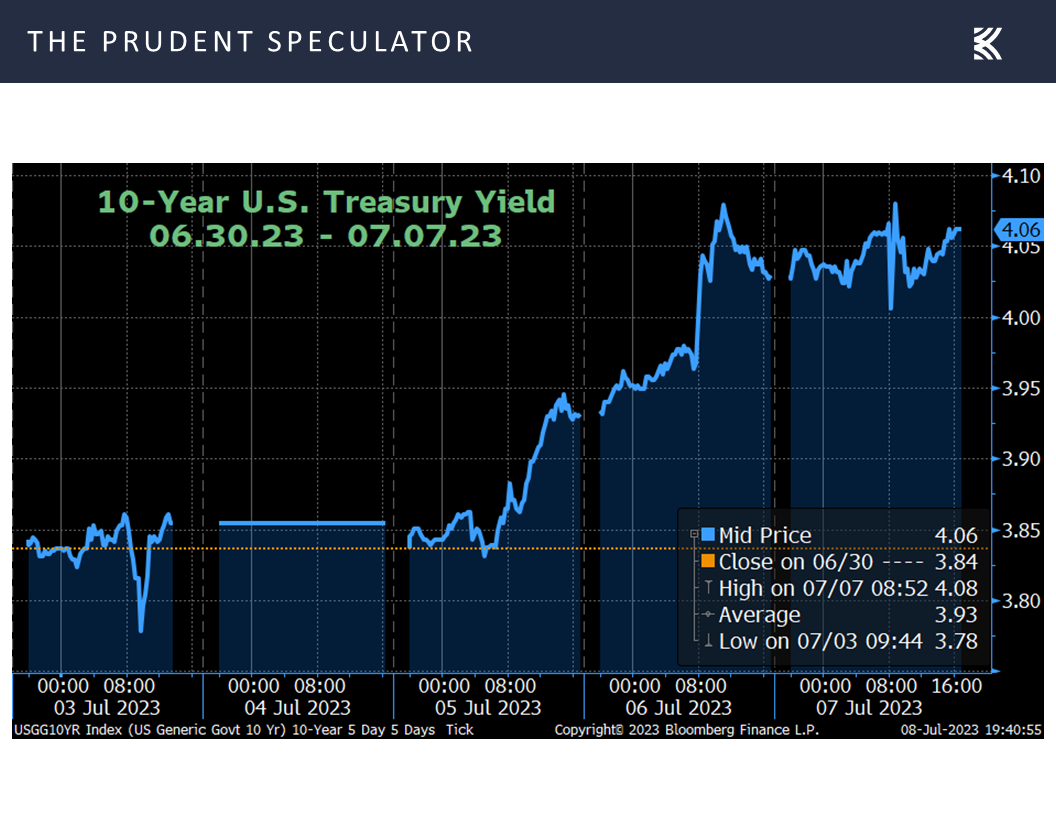
even as there was a big jump in yields for the benchmark 10-Year U.S. Treasury to above 4%.
Inflation – Long-Term Consumer Expectations Remain Well Anchored
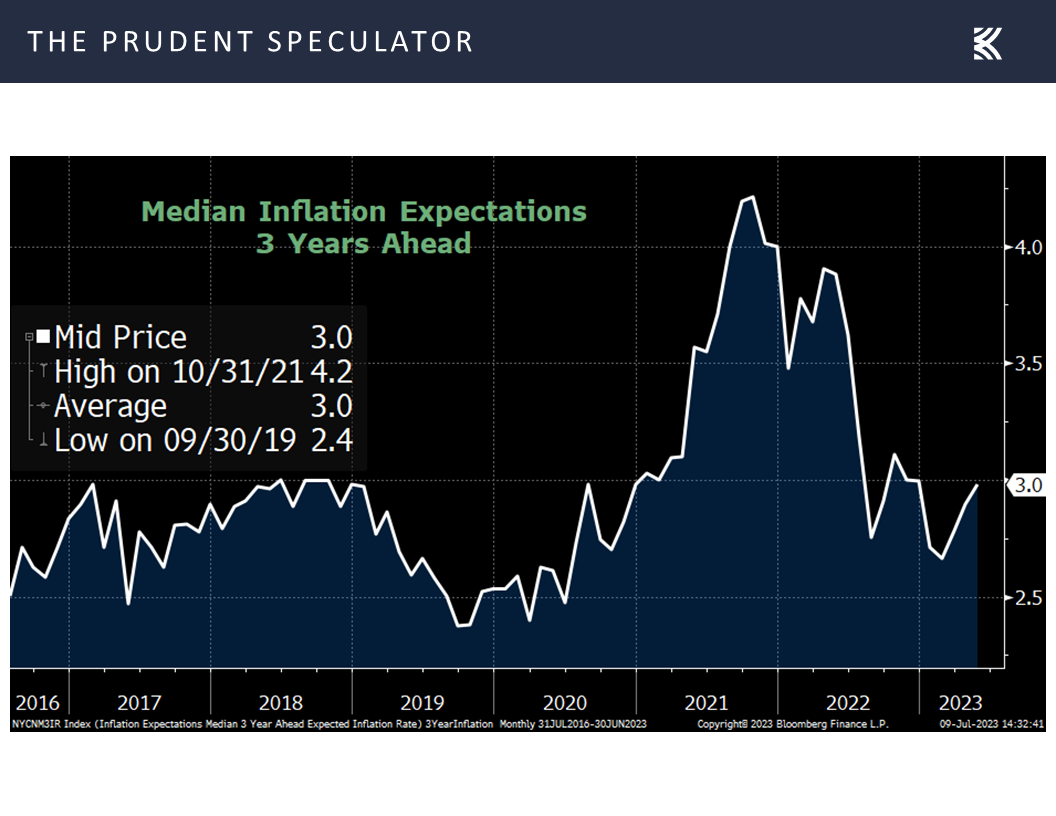
Interestingly, we also learned from the New York Fed that that consumers expect to see 4.1% inflation a year from now, the lowest such reading in two years and down sharply from its recent peak of 6.8%. More importantly, three- and five-year numbers confirm Fed Chair Jerome H. Powell’s recent assertion, “Longer-term inflation expectations appear to remain well-anchored.” Indeed, per the New York Fed, consumers expect inflation to ease to 3.0% in three years and to 2.7% in five years, the former in line with the average reading since 2016.
Long-Term Rewards – Plenty of Scary Events and Numerous Ups and Downs But Equity Trend Has Been Up
Certainly, we understand that market players will continue to hang on every Fed utterance or economic statistic release, but we see no reason to alter our view that equities will provide handsome rewards over the long term as has been the case for more than nine decades.

Of course, one must remember that the secret to success in stocks is not to get scared out of them,
Sentiment – AAII Bullishness is Elevated
Obviously, anything can happen when it comes to stocks, and the futures are pointing south on Sunday evening, so we must always be braced for downside action in equities. We also respect that investor sentiment has turned decidedly Bullish, with the latest Survey from the American Association of Individual Investors (AAII) showing a jump in optimists to 46.4% and a drop in pessimists to 24.5%. The former tally is more Bullish than usual (average has been 37.5%) and the latter more Bearish than usual (average has been 31.0%)
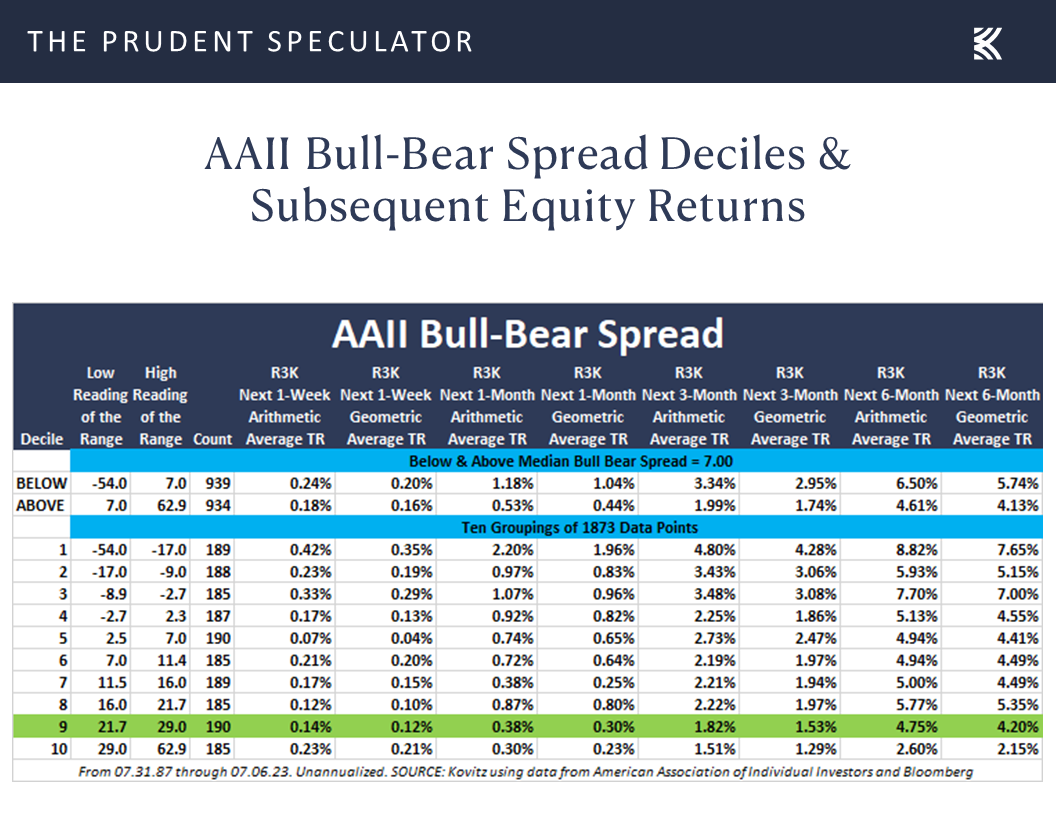
but history shows that while it is usually a good idea to be greedy when others are fearful, there really isn’t empirical evidence related to the AAII numbers, on average, to support the corollary of being fearful when others are greedy (stocks have still appreciated over the subsequent periods)
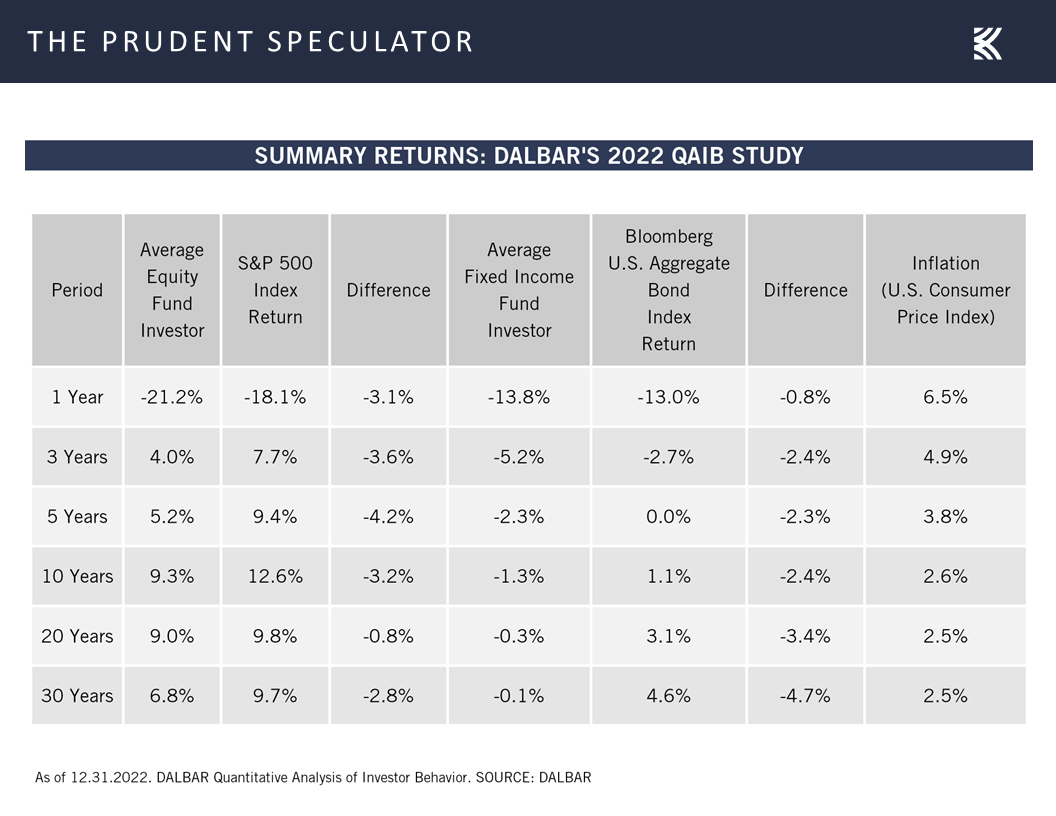
especially as so many endure miserable returns in equities by shooting themselves in the foot with poorly timed entry and exit decisions. Alas, data from DALBAR shows that far too many seem to buy high and sell low.
Historical Evidence – Value Stocks Perform Well, On Average, Whether Interest are Rising/Falling or High/Low
so we offer the friendly reminder that rising interest rates, on average, have heretofore only been bad for long-term bonds,
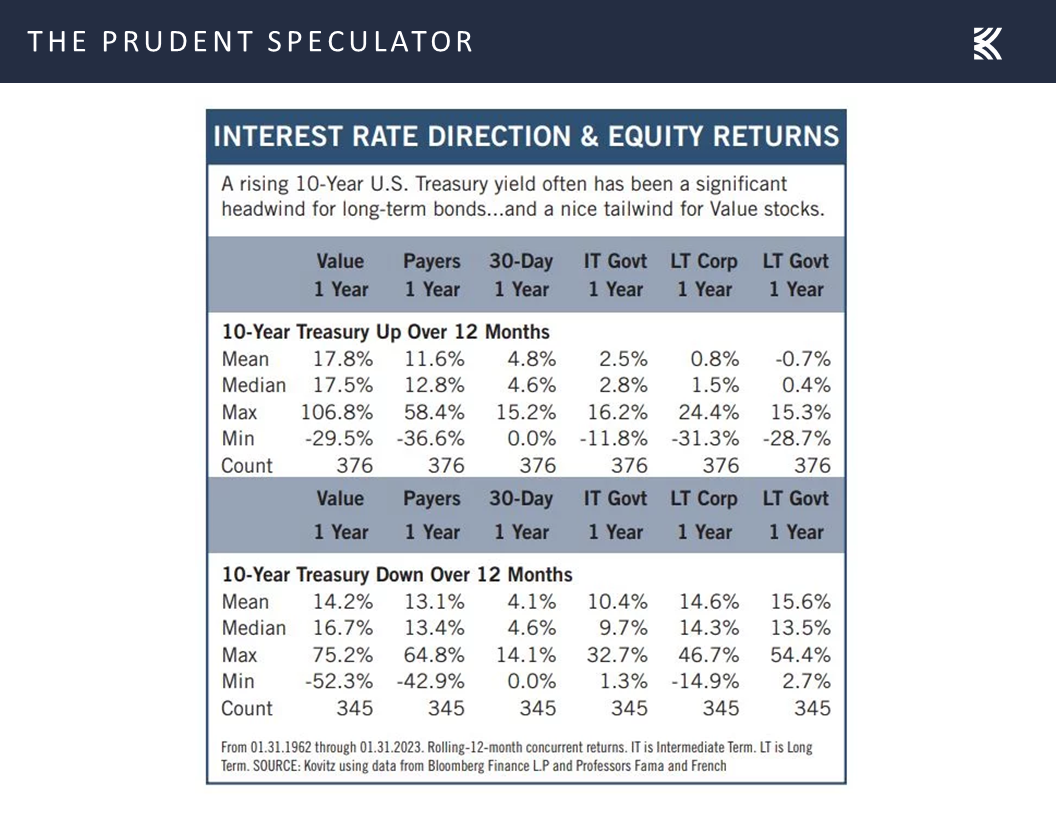
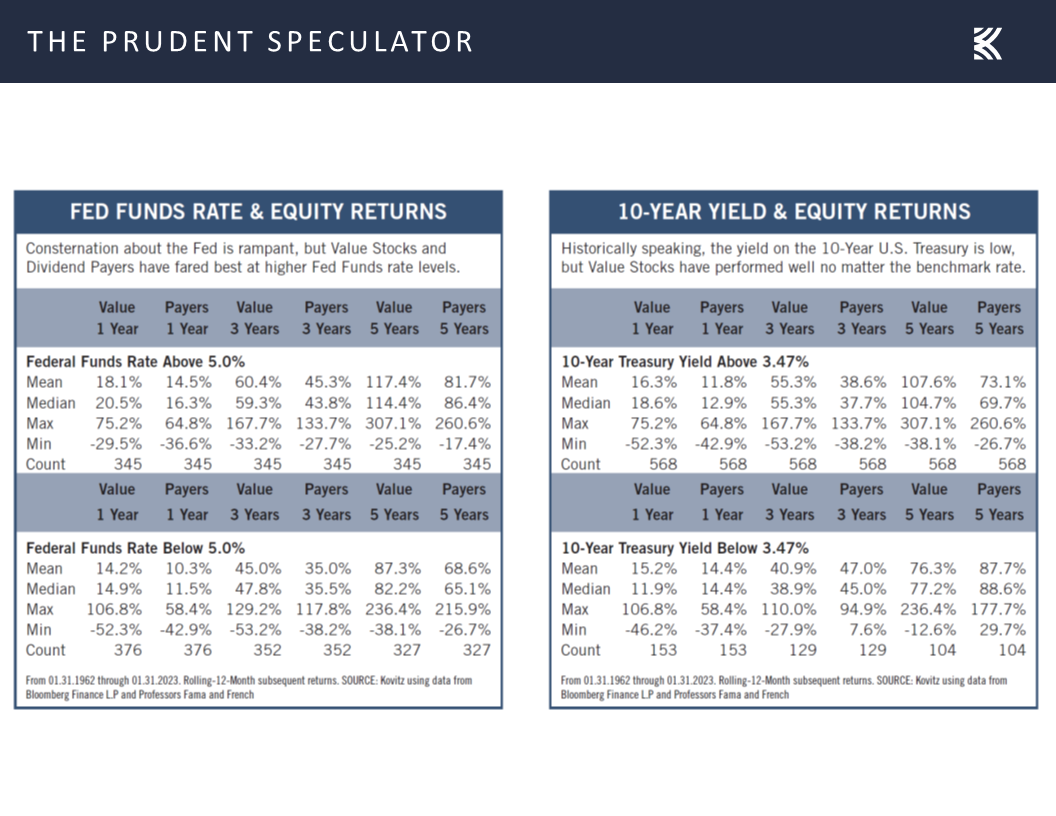
while elevated Fed Funds and 10-Year Treasury rates, also on average, actually have been a tailwind for Value stocks, like those that we have long championed.
Valuations – Value Stocks Reasonably Priced
True, a capitalization-weighted index like the S&P 500 has seen a sizable advance this year, driven by a handful of mega-cap stocks, so we would not be surprised if it took a breather in the near term, but we are very comfortable with the reasonable valuation metrics and generous dividend yields associated with our broadly diversified portfolios of what we believe to be undervalued stocks.
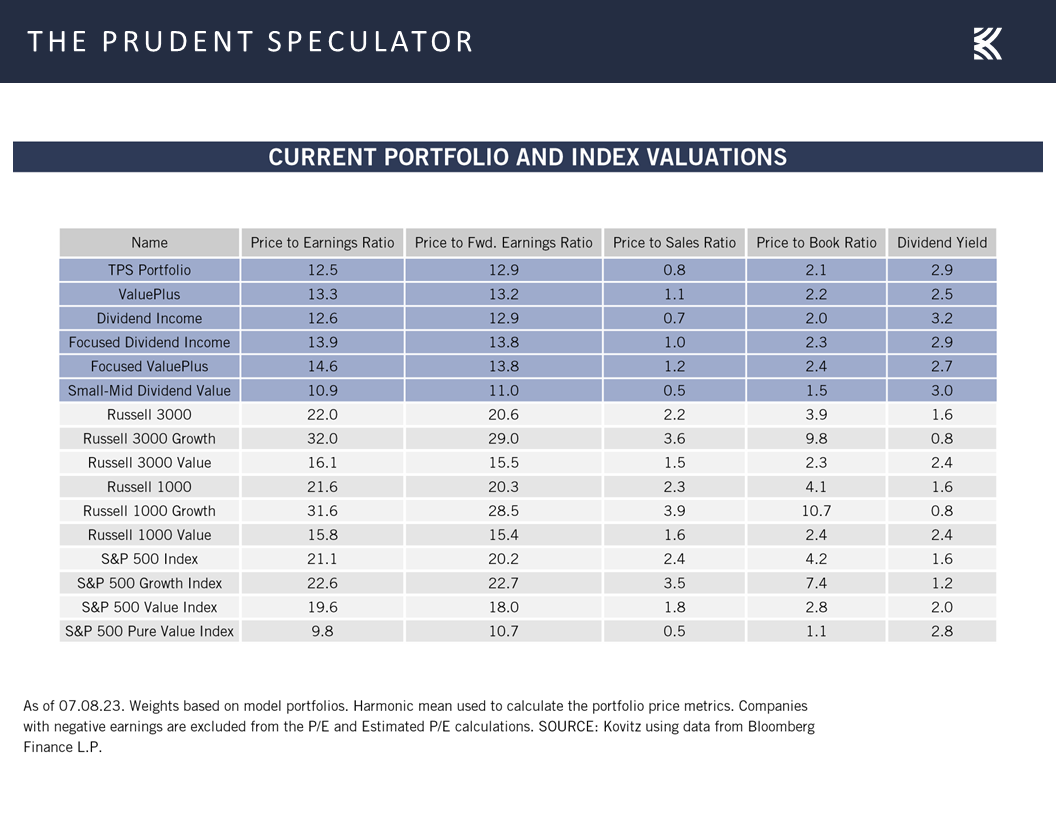
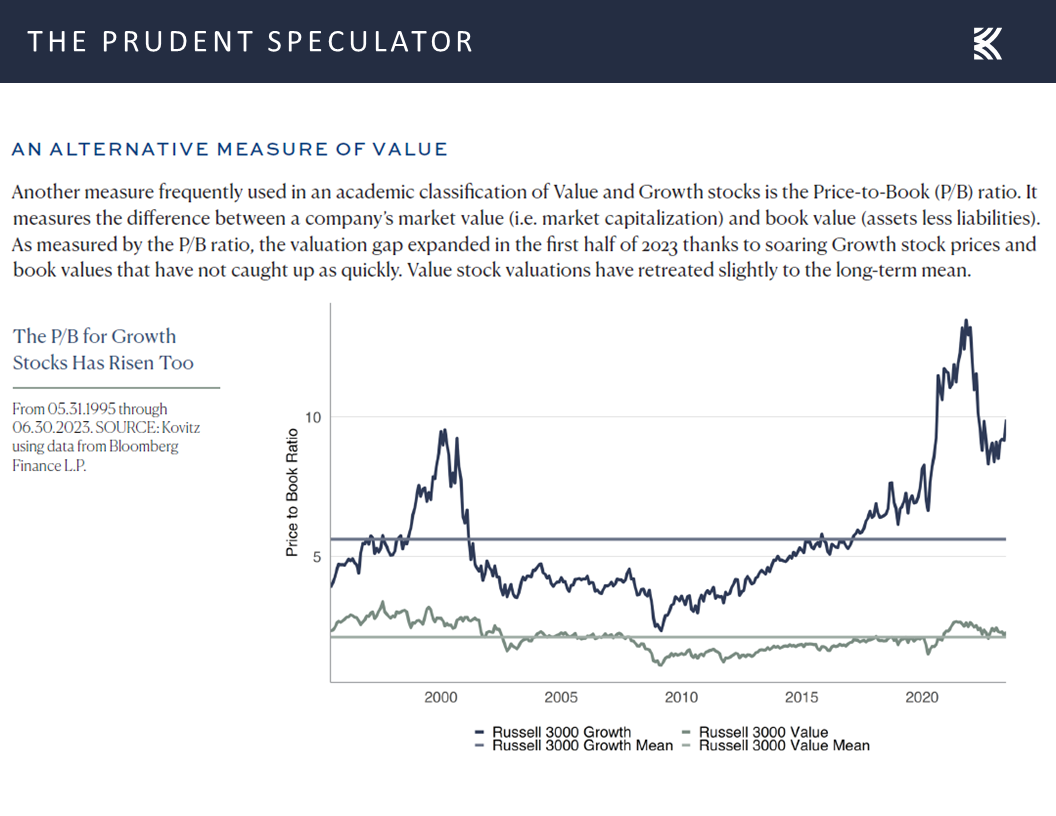
Further, we like that valuation metrics these days for Value stocks in general are not expensive relative to where they have resided over the past 28 years, on both a Price to Earnings basis
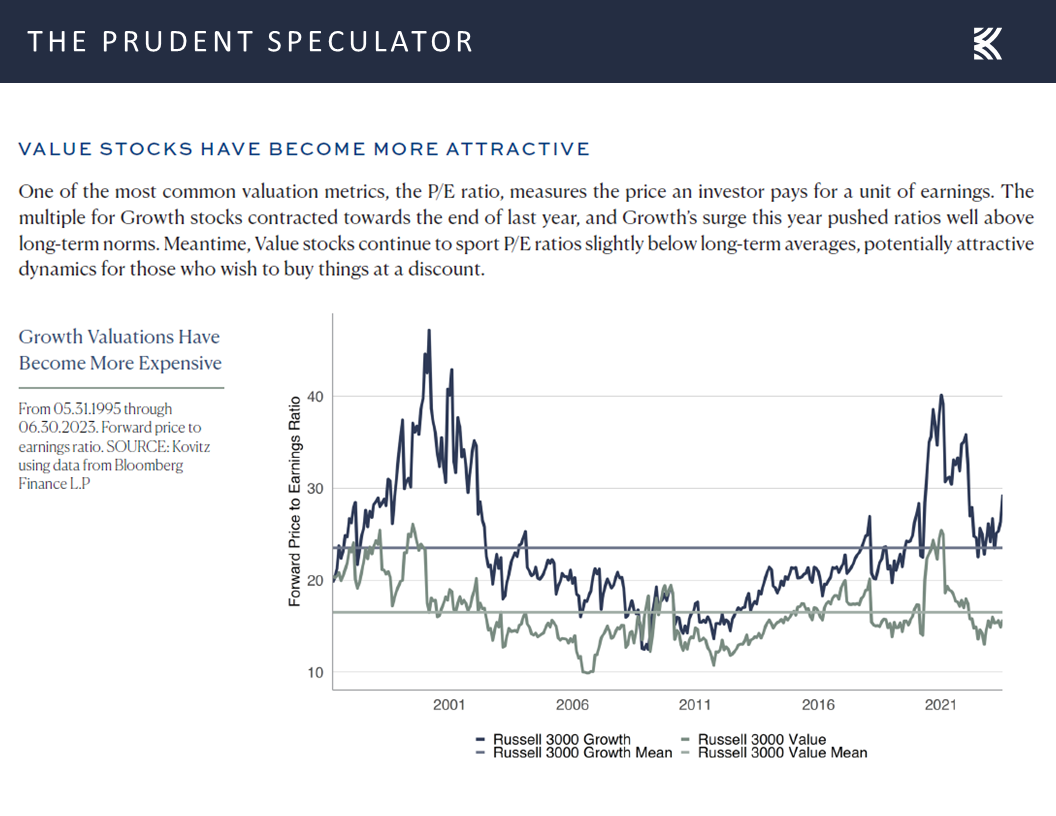
and a Price to Book Value basis.
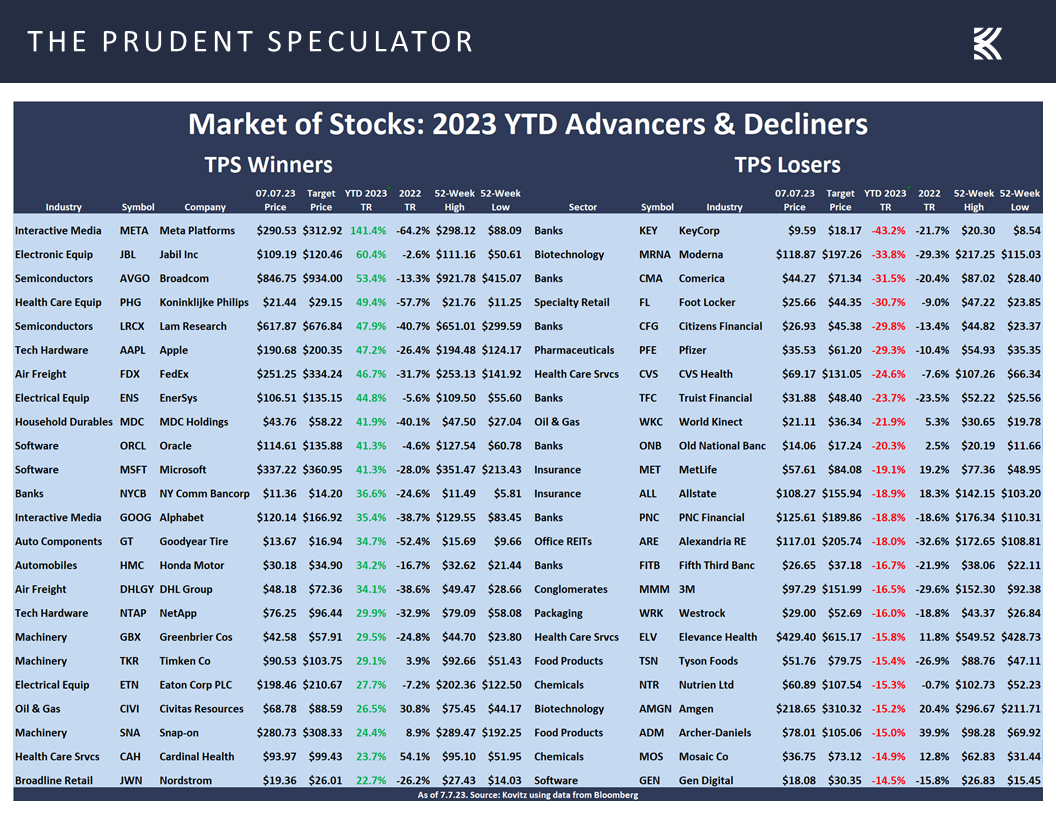
Market of Stocks – TPS Year-to-Date Winners/Losers
Indeed, it is a market of stocks, and while the rising tide has lifted more than a few of our boats this year, there are plenty of vessels that have yet to have any wind in their sails.
mm
Stock News – Updates on three stocks across three different sectors
Keeping in mind that all stocks are rated as a “Buy” until such time as they are a “Sell,” a listing of all current recommendations is available for download via the following link:
https://theprudentspeculator.com/dashboard/. We also offer the reminder that any sales we make for our newsletter strategies are announced via our
Sales Alerts. Jason Clark, Chris Quigley and Zack Tart take a look at earnings reports and other market-moving news of note out last week for more than a few of our recommendations.

Economic Outlook, Historical Evidence, Interest Rates and Valuations
The Prudent Speculator Weekly Commentary is expertly curated every week as a valuable resource for stock market news, investing tips, business insights, and economic trends as it relates to value stock investing. In this week’s market commentary, we discuss the Economic Outlook, Historical Evidence, Interest Rates, Valuations and more. We also include a short preview of our specific stock picks for the week; the entire list is available only to our community of loyal subscribers.
Executive Summary
Newsletter Trades – 8 Buys for 4 Portfolios
Econ Stats – Mixed Numbers & Market Doesn’t Know Which Way to Go
Econ Outlook – Growth, Recession, Toss a Coin
Interest Rates – Little Change in Fed Rate Hike Expectations but Treasury Yields Jump
Inflation – Long-Term Consumer Expectations Remain Well Anchored
Long-Term Rewards – Plenty of Scary Events and Numerous Ups and Downs But Equity Trend Has Been Up
Valuations – Stocks, Especially Value, Remain Reasonably Priced
Historical Evidence – Value Stocks Perform Well, On Average, Whether Interest are Rising/Falling or High/Low
Sentiment – AAII Bullishness is Elevated
Valuations – Value Stocks Reasonably Priced
Market of Stocks – TPS Year-to-Date Winners/Losers
Stock News – Updates on GM, XOM & META
Econ Stats – Mixed Numbers & Market Doesn’t Know Which Way to Go
Given that noted economist John Kenneth Galbraith once proclaimed, “The only function of economic forecasting is to make astrology look respectable,” we might think it would be great to have a crystal ball that could provide the latest economic statistics ahead of time. After all, having advance knowledge of the numbers could surely lead to riches in the financial markets, no?
Such clairvoyance, we might argue, actually could be hazardous to one’s wealth, as one never can be certain how stocks and bonds might react to the data. Sometimes, weaker economic figures can lead to a market rally and vice-versa, with the headline, “Stocks, Bonds Fall After Strong Reports” from The Wall Street Journal’s July 7, 2023, edition illustrating the point.
The “strong reports” on July 6 included a much-better-than-expected read on U.S. private sector employment, as the ADP monthly payrolls report for June saw the creation of 497,000 jobs, far above forecasts for 220,000. “Consumer-facing service industries had a strong June, aligning to push job creation higher than expected. But wage growth continues to ebb in these same industries, and hiring likely is cresting after a late-cycle surge,” explained Nela Richardson, ADP Chief Economist.
Compounding that good news, oops bad news, was word from the Institute for Supply Management (ISM) that the Non-Manufacturing Index (Services PMI) for June came in at 53.9, up from 50.2 in May and well above projections of 51.3. Chair of the ISM Services Business Survey Committee Anthony Nieves explained, “There has been an uptick in the rate of growth for the services sector. This is due mostly to the increase in business activity, new orders and employment. Increased capacity, backlog reduction and continued improvements in logistics have impacted delivery times (resulting in a decrease in the Supplier Deliveries Index). The majority of respondents indicate that business conditions remain stable; however, they are cautious relative to inflation and the future economic outlook.”
Mr Nieves added, “A Services PMI® above 49.9 percent, over time, generally indicates an expansion of the overall economy. Therefore, the June Services PMI® indicates the overall economy is growing for the sixth consecutive month after one month of contraction in December. The past relationship between the Services PMI® and the overall economy indicates that the Services PMI® for June (53.9 percent) corresponds to a 1.4-percent increase in real gross domestic product (GDP) on an annualized basis.”
Lest folks decide that economic growth might be too robust, earlier in the week, ISM reported that its index of factory activity (Manufacturing PMI) retreated to 46.0 in June, down from 46.9 in May and below estimates of 47.3. Chair of the ISM Manufacturing Business Survey Committee Timothy R. Fiore stated, “The U.S. manufacturing sector shrank again, with the Manufacturing PMI® losing ground compared to the previous month, indicating a faster rate of contraction. The June composite index reading reflects companies continuing to manage outputs down as softness continues and optimism about the second half of 2023 weakens.”
Mr. Fiore added, “A Manufacturing PMI® above 48.7 percent, over a period of time, generally indicates an expansion of the overall economy. Therefore, the June Manufacturing PMI® indicates the overall economy contracted in June for a seventh consecutive month after 30 straight months of expansion. The past relationship between the Manufacturing PMI® and the overall economy indicates that the June reading (46 percent) corresponds to a change of minus-1 percent in real gross domestic product (GDP) on an annualized basis.”
Econ Outlook – Growth, Recession, Toss a Coin
Either the economy will grow on a real basis…or it will contract, with the uncertainty confirmed by the latest estimate for Q2 GDP growth from the Atlanta Fed climbing to 2.1% this past week,
and the odds of recession over the ensuing 12 months, as tabulated by Bloomberg, continuing to reside at 65%.
Friday’s trading activity provided more evidence that the economic outlook is as clear as mud, given the reaction of equities to the important monthly jobs report from the Labor Department. Stocks sold off on the open, supposedly on concerns that wage growth ticked up by 0.4% in June, above the consensus forecast of 0.3%. While the increase seemingly heightened concerns about inflation, the year-over-year increase held steady at 4.4%
and the number of new jobs created in June was “only” 209,000, below expectations of a 240,000 increase, while the April and May figures were revised lower,
even as the employment rate edged down to 3.6% from 3.7% the month prior.
The realization that the labor market had cooled somewhat arguably led to a mid-day rally as all major market indexes were in the green at one point. However, the large-cap stock advance faded into the close, so much so that the headlines for the day were that equities ended modestly in the red, even as the average stock closed modestly higher and the small-cap Russell 2000 finished up more than 1%.
Interest Rates – Little Change in Fed Rate Hike Expectations but Treasury Yields Jump
Needless to say, there is plenty of uncertainty these days in regard to the economy and actions the Federal Reserve might take in its fight with inflation. For example, The New York Times had this to say following the release of the minutes last week from the June meeting of the Federal Open Market Committee,…
While “almost all” Fed officials thought it was “appropriate or acceptable” to leave rates unchanged in June, “some” either favored raising interest rates or “could have supported such a proposal” given continued strength in the labor market, persistent momentum in the economy, and “few clear signs” that inflation was getting back on track, the minutes showed.
but market expectations for additional Fed rate hikes this year (5.39% year-end rate vs. 5.38% a week ago) were little changed,
even as there was a big jump in yields for the benchmark 10-Year U.S. Treasury to above 4%.
Inflation – Long-Term Consumer Expectations Remain Well Anchored
Interestingly, we also learned from the New York Fed that that consumers expect to see 4.1% inflation a year from now, the lowest such reading in two years and down sharply from its recent peak of 6.8%. More importantly, three- and five-year numbers confirm Fed Chair Jerome H. Powell’s recent assertion, “Longer-term inflation expectations appear to remain well-anchored.” Indeed, per the New York Fed, consumers expect inflation to ease to 3.0% in three years and to 2.7% in five years, the former in line with the average reading since 2016.
Long-Term Rewards – Plenty of Scary Events and Numerous Ups and Downs But Equity Trend Has Been Up
Certainly, we understand that market players will continue to hang on every Fed utterance or economic statistic release, but we see no reason to alter our view that equities will provide handsome rewards over the long term as has been the case for more than nine decades.
Of course, one must remember that the secret to success in stocks is not to get scared out of them,
Sentiment – AAII Bullishness is Elevated
Obviously, anything can happen when it comes to stocks, and the futures are pointing south on Sunday evening, so we must always be braced for downside action in equities. We also respect that investor sentiment has turned decidedly Bullish, with the latest Survey from the American Association of Individual Investors (AAII) showing a jump in optimists to 46.4% and a drop in pessimists to 24.5%. The former tally is more Bullish than usual (average has been 37.5%) and the latter more Bearish than usual (average has been 31.0%)
but history shows that while it is usually a good idea to be greedy when others are fearful, there really isn’t empirical evidence related to the AAII numbers, on average, to support the corollary of being fearful when others are greedy (stocks have still appreciated over the subsequent periods)
especially as so many endure miserable returns in equities by shooting themselves in the foot with poorly timed entry and exit decisions. Alas, data from DALBAR shows that far too many seem to buy high and sell low.
Historical Evidence – Value Stocks Perform Well, On Average, Whether Interest are Rising/Falling or High/Low
so we offer the friendly reminder that rising interest rates, on average, have heretofore only been bad for long-term bonds,
while elevated Fed Funds and 10-Year Treasury rates, also on average, actually have been a tailwind for Value stocks, like those that we have long championed.
Valuations – Value Stocks Reasonably Priced
True, a capitalization-weighted index like the S&P 500 has seen a sizable advance this year, driven by a handful of mega-cap stocks, so we would not be surprised if it took a breather in the near term, but we are very comfortable with the reasonable valuation metrics and generous dividend yields associated with our broadly diversified portfolios of what we believe to be undervalued stocks.
Further, we like that valuation metrics these days for Value stocks in general are not expensive relative to where they have resided over the past 28 years, on both a Price to Earnings basis
and a Price to Book Value basis.
Market of Stocks – TPS Year-to-Date Winners/Losers
Indeed, it is a market of stocks, and while the rising tide has lifted more than a few of our boats this year, there are plenty of vessels that have yet to have any wind in their sails.
mm
Stock News – Updates on three stocks across three different sectors
About the Author
The Prudent Speculator
Explore
Popular Posts
Connect
Subscribe For Free Stock Picks
Get expert investing tips and market insights delivered straight to your inbox.