Recessions, Fed Tightening & High Inflation No Reason to Sell Stocks
The Prudent Speculator Weekly Commentary is expertly curated every week as a valuable resource for stock market news, investing tips, business insights, and economic trends as it relates to value stock investing. This week, we cover the AAII sentiment, inflation, the Fed remaining hawkish, a subscribers mail bag question, Buffet’s latest and more. We also include a short preview of our specific stock picks for the week; the entire list is available only to our community of loyal subscribers.
Inflation: PCE Higher than Expected; Fed Likely to Remain Hawkish
Econ Numbers: GDP Growth Outlook Increases; More Positive than Negative Data
Corporate Profits: Solid Q4 EPS and Decent Outlook for 2023
History Lessons: Recessions, Fed Tightening & High Inflation No Reason to Sell Stocks
Reader Mail Bag: Stocks Did Not Go Nowhere From 1966 – 1982
Buffett’s Latest: Don’t Bet Against America
Valuations: Inexpensive Metrics & Generous Dividend Yield for TPS Portfolio
Stock News: Updates on 10 companies across 6 different sectors
Week In Review:
It was a tough week for the equity markets, to say the least, with a sizable 3% setback dragging the Dow Jones Industrial Average into the red for the year,
It is a market of stocks and returns over the last couple of years years show wide dispersion, similar in magnitude to what was seen after the bursting of the Tech Bubble in the year 2000.
Not surprisingly, the downturn soured the mood of folks on Main Street as the latest read on Sentiment from the American Association of Individual Investors (AAII) saw the number of Bulls plunge by 12.5 percentage points and the count of Bears jump by 9.8 percentage points.
The good folks in the AAII Sentiment Survey became a lot more pessimistic last week, which is a good thing for potential near-term equity market gains.
Of course, the AAII gauge historically has been a very good contra-indicator for returns going forward and the current Bull-Bear reading of negative 17.0 is in first decile (most pessimistic) of the readings since the inception of the data in 1987. As the chart above illustrates, returns over the ensuing week, month, three months and six months for that first decile have been the best of the lot, illustrating why it can pay to be greedy when others are fearful.
No doubt, that is easier said than done, as the financial press usually does its part to instill fear. For example, the front page of Saturday’s The Wall Street Journal trumpeted, Stocks Post Worst Week of 2023, warning, “Hot economic data rekindled worries that a more restrictive Federal Reserve policy will persist.”
We respect that many are worried about Jerome H. Powell & Co., especially as the Fed’s preferred measure of inflation, the core personal consumption expenditure (PCE) index rose 4.7% in January, above the consensus forecast for a 4.4% advance, and higher than the revised year-over-year advance of 4.6% in December.
Inflation: PCE Higher than Expected; Fed Likely to Remain Hawkish
Inflation headed in the wrong direction in January as the Core PCE rose 4.7%.
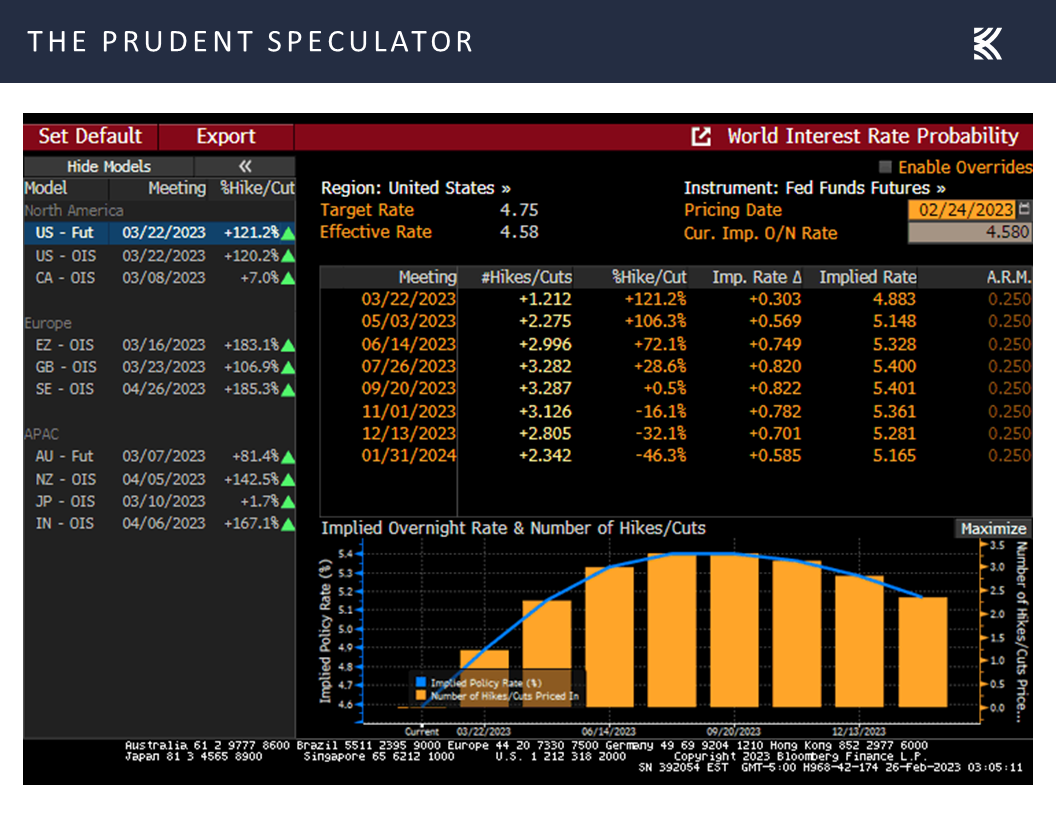
Cleveland Fed President Loretta Mester was quick to remind, “Inflation is too high,” and the futures market moved higher the peak of the Fed Funds rate this year to 5.4%, with the year-end guesstimate pushed up to 5.28%.
The Fed Fund futures became more hawkish last week, projecting a peak in the rate at 5.4% this summer.
Interestingly, the most recent published estimates from Federal Reserve Board members called for 4.6% unemployment, 3.5% core PCE inflation and a 5.1% Fed Funds rate at the end of the year.
The latest projections from the FOMC.
SOURCE: Kovitz using FOMC Data
Economic forecasting is fraught with peril, so only time will tell how accurate those projections will be, including the prediction of 0.5% real GDP growth. After all, even as stock prices headed south, the outlook for the economy improved last week, with the Atlanta Fed boosting its forecast for Q1 real U.S. GDP growth to 2.7%,
Econ Numbers : GDP Growth Outlook Increases; More Positive than Negative Data
It is fascinating to see so much pessimism toward the U.S. economy when the current estimate for Q1 real (inflation-adjusted) GDP growth stands at a decent level.
due in part to improved and better-than-expected preliminary tallies for the S&P Global Markit Manufacturing and Services PMIs,
S&P Global Markit PMI readings moved higher in February.
higher-than-forecast new homes sales in January,
New Home Sales topped expectations in January.
and continued strength in the labor market.
The labor market remains robust with jobless claims still near five-decade-plus lows.
What’s more, the odds of recession over the next 12 months, as tabulated by Bloomberg, retreated to 60% last week, down from the 65% level that had been in place for the past few months.
Prognosticators now project a 60% chance of a U.S. recession occurring in the next 12 months, down from 65% a week ago.
Certainly, we do not mean to suggest that a so-called soft landing for the economy is in the cards, but it seems certain that nominal GDP will continue to grow, even if there is a modest decline in inflation-adjusted growth,
There was a huge 7.4% jump in Q4 nominal GDP, even as real (inflation-adjusted) growth was “only” 2.7%.
while we can’t forget that corporate profits (which still are expected to show significant growth this year) and stock prices are not tabulated on a real basis.
Corporate Profits: Solid Q4 EPS and Decent Outlook for 2023
Certainly, we realize that analysts are often overly optimistic in their earnings outlooks, but Q4 2022 results have been solid thus far and the outlook for 2023 is still for significantly higher EPS.
We also offer the reminder that even if we knew in advance when a recession would arrive, long-term-oriented investors we would not want to bail out of equities, given positive average equity returns before and after the start of an economic downturn,
History Lessons: Recessions, Fed Tightening & High Inflation No Reason to Sell Stocks
There is much hand-wringing over a “hard” or “soft” landing, but the historical evidence shows that even if the U.S. economy officially enters a recessions, long-term oriented investors should stick with stocks.
while history shows that stocks have been a very good hedge, on average, against high inflation.
There is plenty of consternation about elevated inflation levels, but history suggests that equities, especially Value stocks, have performed better when CPI is 6.4% or higher than when it is lower than that mark.
In addition, equities, especially those of the Value variety, have performed admirably, on average, both concurrent with and subsequent to Fed rate hikes,
Contrary to popular belief, equities, especially Value stocks, have performed admirably, on average, both concurrent with and subsequent to hikes in the Fed Funds rate.
with then-Fed-Chair Paul Volcker’s slaying of the Great Inflation in the 1980s leading to fantastic performance numbers, including a 24.7% average annualized return for Value from the end of 1978 to the end of 1986.
It is puzzling that so many fret about today’s Fed battle with inflation, given that the Volcker Fed’s fight against the Great Inflation saw sensational equity market returns despite two recessions along the way.
Reader Mail Bag: Stocks Did Not Go Nowhere From 1966 – 1982
To be sure, past performance is no guarantee of future returns and anything can happen as we move forward, but we present tons of data to try to keep our readers on the path to achieving their long-term investment objectives. After all, as Lao Tzu stated, “If you do not change direction, you may end up where you are heading.”
Our recent Special Report showed that stocks historically have been indifferent to rising interest rates (and inflation). Alas, one reader took issue with our arguments and we paraphrase his comments:
I appreciate and commend your stock market investment approach. However, some of these charts are hard to believe. For those of us who invested in the 70’s during a time frame of escalating interest rates, the stock market gyrated but the bottom line is it just moved sideways…as you may or may not recall, during this ‘nowhere’ time for stocks, money market mutual funds were yielding 12% to 14% and U.S. Treasuries and investment grade bonds even higher. With the rampant inflation, it just wasn’t a prudent time to be in the stock market.
We always welcome challenges to our data, but this fellow was not the first to make the “stocks went nowhere” claim.
In fact, The Wall Street Journal wrote last year:
It helps, whenever markets turn worrisome, to look at historical precedents. How bad could things get?
In this case, what U.S. investors should probably fear the most is a replay of the stagflationary slog from 1966 to 1982, when economic growth was spotty, inflation stayed double digits for years and stocks went utterly nowhere.
On Feb. 9, 1966, the S& P 500 closed at a then-record 94.06. More than 16 years later, on Aug. 12, 1982, it stood at 102.42.
Corporate earnings, after inflation, shrank 15%, according to data from Yale University economist Robert Shiller.
Yes, stocks paid generous dividends, reaching nearly 6% by the end of the period, but inflation devoured them whole.
That period was such an ordeal it turned the individual investor into an endangered species.
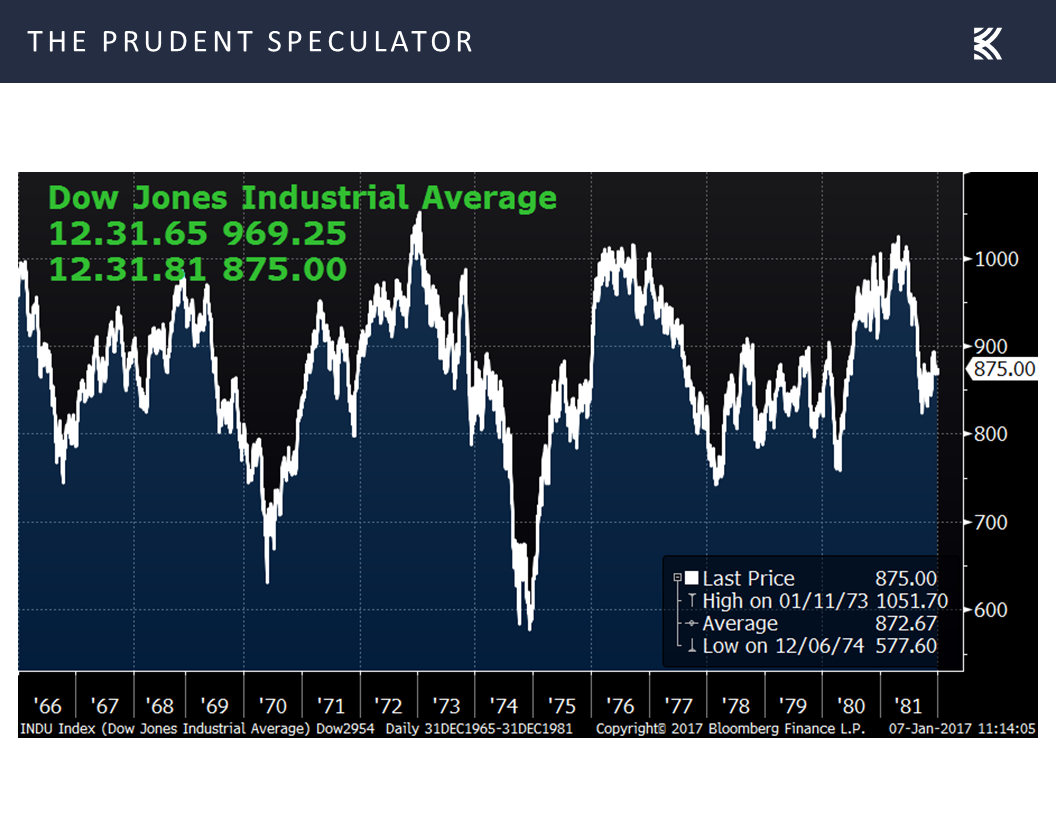
The Dow Jones Industrial Average (on a price basis) went nowhere from the beginning of 1966 to the beginning of 1982.
Such a claim sounds accurate in that the Dow Jones Industrial Average lost ground from 12.31.65 to 12.31.81, but that assessment ignores dividends and the impact of their reinvestment.
Some have suggested that dividends don’t count. However, if this were true, the income received on bonds should not count either, which would negate the entire point of investing in the fixed income asset class. Same thing with money markets funds and most bank savings instruments as the price return on those instruments is always zero, and real estate would also likely be of much less interest as rental income would not count.
Obviously, it is silly to ignore the income an investment produces and a total-return analysis of how stocks and bonds performed over those 16 years is eye-opening to say the least. After all, despite losing nearly 10% on a price basis, the Dow’s total return during the period was 3.94% per annum and the S&P 500’s was 5.95% per annum. Yes, that is correct, those are the average returns PER YEAR for the 16 years. True, those numbers hardly are stellar, but they are far better than zero.
And illustrating why we find value in applying rigor to stock selection, from the beginning of 1966 to the beginning of 1982, the total return on Value stocks was a superb 13.39% PER YEAR. As that Value number compounds over 16 years to 647%, we can only hope that we have another “nowhere” market!
To be sure, short-term cash-like instruments were a decent investment during those same 16 years, even as the 6.8% annualized return on 30-Day U.S. Treasuries trailed the 7.0% annualized inflation tally.
Of course, bonds were miserable investments back then as Long-Term Corporate Bonds returned 2.9% per annum and Long-Term Government Bonds returned 2.5% per annum, so there was a massive loss of purchasing power in those supposedly safe fixed-income instruments.
Yes, bonds had large yields, but a big reason they were so high during that time is that their prices plunged!
In reality, about the only conclusion we can draw with certainty is that rising long-term interest rates are bad for long-term bonds.
Buffett’s Latest: Don’t Bet Against America
The only thing the historical data show is that rising long-term interest rates are bad for… longer-term bonds.
As we live by the Vannevar Bush quotation, “Fear cannot be banished, but it can be calm and without panic; it can be mitigated by reason and evaluation,” we will always challenge assertions based on factually incorrect or incomplete data. That does not mean that the past will always be prologue, but we like what Warren Buffett wrote in the latest Berkshire Hathaway Letter to Shareholders, which was released this weekend.
America’s dynamism has made a huge contribution to whatever success Berkshire has achieved – a contribution Berkshire will always need. We count on the American Tailwind and, though it has been becalmed from time to time, its propelling force has always returned.
I have been investing for 80 years – more than one-third of our country’s lifetime. Despite our citizens’ penchant – almost enthusiasm – for self-criticism and self-doubt, I have yet to see a time when it made sense to make a long-term bet against America. And I doubt very much that any reader of this letter will have a different experience in the future.
The evidence overwhelmingly supports the Oracle of Omaha. Despite plenty of ups and downs (including the current 5% dip, the 315th since 1928) along the way, equities have proved very rewarding for those with the courage to stick with them,
Valuations: Inexpensive Metrics & Generous Dividend Yield for TPS Portfolio
The secret to success is not to get scared out of them as every downturn has been followed by an upswing of far greater magnitude, so much so that long-term returns for Value stocks have exceeded 13% per annum.
with inexpensively stocks like those that we have long championed leading the long-term performance derby.
We sleep very well at night, given the inexpensive valuation multiples and generous dividend yields associated with our managed account portfolios.
Stock News & Earnings – Updates on 10 stocks across 6 sectors
Keeping in mind that all stocks are rated as a “Buy” until such time as they are a “Sell,” a listing of all current recommendations is available for download via the following link: https://theprudentspeculator.com/dashboard/. We also offer the reminder that any sales we make for our newsletter strategies are announced via our Sales Alerts. Jason Clark, Chris Quigley and Zack Tart take a look at earnings reports and other market-moving news of note out last week for more than a few of our recommendations.
Recessions, Fed Tightening & High Inflation No Reason to Sell Stocks
The Prudent Speculator Weekly Commentary is expertly curated every week as a valuable resource for stock market news, investing tips, business insights, and economic trends as it relates to value stock investing. This week, we cover the AAII sentiment, inflation, the Fed remaining hawkish, a subscribers mail bag question, Buffet’s latest and more. We also include a short preview of our specific stock picks for the week; the entire list is available only to our community of loyal subscribers.
Executive Summary
Week In Review:
It was a tough week for the equity markets, to say the least, with a sizable 3% setback dragging the Dow Jones Industrial Average into the red for the year,
It is a market of stocks and returns over the last couple of years years show wide dispersion, similar in magnitude to what was seen after the bursting of the Tech Bubble in the year 2000.
Not surprisingly, the downturn soured the mood of folks on Main Street as the latest read on Sentiment from the American Association of Individual Investors (AAII) saw the number of Bulls plunge by 12.5 percentage points and the count of Bears jump by 9.8 percentage points.
The good folks in the AAII Sentiment Survey became a lot more pessimistic last week, which is a good thing for potential near-term equity market gains.
Of course, the AAII gauge historically has been a very good contra-indicator for returns going forward and the current Bull-Bear reading of negative 17.0 is in first decile (most pessimistic) of the readings since the inception of the data in 1987. As the chart above illustrates, returns over the ensuing week, month, three months and six months for that first decile have been the best of the lot, illustrating why it can pay to be greedy when others are fearful.
No doubt, that is easier said than done, as the financial press usually does its part to instill fear. For example, the front page of Saturday’s The Wall Street Journal trumpeted, Stocks Post Worst Week of 2023, warning, “Hot economic data rekindled worries that a more restrictive Federal Reserve policy will persist.”
We respect that many are worried about Jerome H. Powell & Co., especially as the Fed’s preferred measure of inflation, the core personal consumption expenditure (PCE) index rose 4.7% in January, above the consensus forecast for a 4.4% advance, and higher than the revised year-over-year advance of 4.6% in December.
Inflation: PCE Higher than Expected; Fed Likely to Remain Hawkish
Inflation headed in the wrong direction in January as the Core PCE rose 4.7%.
Cleveland Fed President Loretta Mester was quick to remind, “Inflation is too high,” and the futures market moved higher the peak of the Fed Funds rate this year to 5.4%, with the year-end guesstimate pushed up to 5.28%.
The Fed Fund futures became more hawkish last week, projecting a peak in the rate at 5.4% this summer.
Interestingly, the most recent published estimates from Federal Reserve Board members called for 4.6% unemployment, 3.5% core PCE inflation and a 5.1% Fed Funds rate at the end of the year.
The latest projections from the FOMC.
Economic forecasting is fraught with peril, so only time will tell how accurate those projections will be, including the prediction of 0.5% real GDP growth. After all, even as stock prices headed south, the outlook for the economy improved last week, with the Atlanta Fed boosting its forecast for Q1 real U.S. GDP growth to 2.7%,
Econ Numbers : GDP Growth Outlook Increases; More Positive than Negative Data
It is fascinating to see so much pessimism toward the U.S. economy when the current estimate for Q1 real (inflation-adjusted) GDP growth stands at a decent level.
due in part to improved and better-than-expected preliminary tallies for the S&P Global Markit Manufacturing and Services PMIs,
S&P Global Markit PMI readings moved higher in February.
higher-than-forecast new homes sales in January,
New Home Sales topped expectations in January.
and continued strength in the labor market.
The labor market remains robust with jobless claims still near five-decade-plus lows.
What’s more, the odds of recession over the next 12 months, as tabulated by Bloomberg, retreated to 60% last week, down from the 65% level that had been in place for the past few months.
Prognosticators now project a 60% chance of a U.S. recession occurring in the next 12 months, down from 65% a week ago.
Certainly, we do not mean to suggest that a so-called soft landing for the economy is in the cards, but it seems certain that nominal GDP will continue to grow, even if there is a modest decline in inflation-adjusted growth,
There was a huge 7.4% jump in Q4 nominal GDP, even as real (inflation-adjusted) growth was “only” 2.7%.
while we can’t forget that corporate profits (which still are expected to show significant growth this year) and stock prices are not tabulated on a real basis.
Corporate Profits: Solid Q4 EPS and Decent Outlook for 2023
Certainly, we realize that analysts are often overly optimistic in their earnings outlooks, but Q4 2022 results have been solid thus far and the outlook for 2023 is still for significantly higher EPS.
We also offer the reminder that even if we knew in advance when a recession would arrive, long-term-oriented investors we would not want to bail out of equities, given positive average equity returns before and after the start of an economic downturn,
History Lessons: Recessions, Fed Tightening & High Inflation No Reason to Sell Stocks
There is much hand-wringing over a “hard” or “soft” landing, but the historical evidence shows that even if the U.S. economy officially enters a recessions, long-term oriented investors should stick with stocks.
while history shows that stocks have been a very good hedge, on average, against high inflation.
There is plenty of consternation about elevated inflation levels, but history suggests that equities, especially Value stocks, have performed better when CPI is 6.4% or higher than when it is lower than that mark.
In addition, equities, especially those of the Value variety, have performed admirably, on average, both concurrent with and subsequent to Fed rate hikes,
Contrary to popular belief, equities, especially Value stocks, have performed admirably, on average, both concurrent with and subsequent to hikes in the Fed Funds rate.
with then-Fed-Chair Paul Volcker’s slaying of the Great Inflation in the 1980s leading to fantastic performance numbers, including a 24.7% average annualized return for Value from the end of 1978 to the end of 1986.
It is puzzling that so many fret about today’s Fed battle with inflation, given that the Volcker Fed’s fight against the Great Inflation saw sensational equity market returns despite two recessions along the way.
Reader Mail Bag: Stocks Did Not Go Nowhere From 1966 – 1982
To be sure, past performance is no guarantee of future returns and anything can happen as we move forward, but we present tons of data to try to keep our readers on the path to achieving their long-term investment objectives. After all, as Lao Tzu stated, “If you do not change direction, you may end up where you are heading.”
Our recent Special Report showed that stocks historically have been indifferent to rising interest rates (and inflation). Alas, one reader took issue with our arguments and we paraphrase his comments:
I appreciate and commend your stock market investment approach. However, some of these charts are hard to believe. For those of us who invested in the 70’s during a time frame of escalating interest rates, the stock market gyrated but the bottom line is it just moved sideways…as you may or may not recall, during this ‘nowhere’ time for stocks, money market mutual funds were yielding 12% to 14% and U.S. Treasuries and investment grade bonds even higher. With the rampant inflation, it just wasn’t a prudent time to be in the stock market.
We always welcome challenges to our data, but this fellow was not the first to make the “stocks went nowhere” claim.
In fact, The Wall Street Journal wrote last year:
It helps, whenever markets turn worrisome, to look at historical precedents. How bad could things get?
In this case, what U.S. investors should probably fear the most is a replay of the stagflationary slog from 1966 to 1982, when economic growth was spotty, inflation stayed double digits for years and stocks went utterly nowhere.
On Feb. 9, 1966, the S& P 500 closed at a then-record 94.06. More than 16 years later, on Aug. 12, 1982, it stood at 102.42.
Corporate earnings, after inflation, shrank 15%, according to data from Yale University economist Robert Shiller.
Yes, stocks paid generous dividends, reaching nearly 6% by the end of the period, but inflation devoured them whole.
That period was such an ordeal it turned the individual investor into an endangered species.
The Dow Jones Industrial Average (on a price basis) went nowhere from the beginning of 1966 to the beginning of 1982.
Such a claim sounds accurate in that the Dow Jones Industrial Average lost ground from 12.31.65 to 12.31.81, but that assessment ignores dividends and the impact of their reinvestment.
Some have suggested that dividends don’t count. However, if this were true, the income received on bonds should not count either, which would negate the entire point of investing in the fixed income asset class. Same thing with money markets funds and most bank savings instruments as the price return on those instruments is always zero, and real estate would also likely be of much less interest as rental income would not count.
Obviously, it is silly to ignore the income an investment produces and a total-return analysis of how stocks and bonds performed over those 16 years is eye-opening to say the least. After all, despite losing nearly 10% on a price basis, the Dow’s total return during the period was 3.94% per annum and the S&P 500’s was 5.95% per annum. Yes, that is correct, those are the average returns PER YEAR for the 16 years. True, those numbers hardly are stellar, but they are far better than zero.
And illustrating why we find value in applying rigor to stock selection, from the beginning of 1966 to the beginning of 1982, the total return on Value stocks was a superb 13.39% PER YEAR. As that Value number compounds over 16 years to 647%, we can only hope that we have another “nowhere” market!
To be sure, short-term cash-like instruments were a decent investment during those same 16 years, even as the 6.8% annualized return on 30-Day U.S. Treasuries trailed the 7.0% annualized inflation tally.
Of course, bonds were miserable investments back then as Long-Term Corporate Bonds returned 2.9% per annum and Long-Term Government Bonds returned 2.5% per annum, so there was a massive loss of purchasing power in those supposedly safe fixed-income instruments.
Yes, bonds had large yields, but a big reason they were so high during that time is that their prices plunged!
In reality, about the only conclusion we can draw with certainty is that rising long-term interest rates are bad for long-term bonds.
Buffett’s Latest: Don’t Bet Against America
The only thing the historical data show is that rising long-term interest rates are bad for… longer-term bonds.
As we live by the Vannevar Bush quotation, “Fear cannot be banished, but it can be calm and without panic; it can be mitigated by reason and evaluation,” we will always challenge assertions based on factually incorrect or incomplete data. That does not mean that the past will always be prologue, but we like what Warren Buffett wrote in the latest Berkshire Hathaway Letter to Shareholders, which was released this weekend.
America’s dynamism has made a huge contribution to whatever success Berkshire has achieved – a contribution Berkshire will always need. We count on the American Tailwind and, though it has been becalmed from time to time, its propelling force has always returned.
I have been investing for 80 years – more than one-third of our country’s lifetime. Despite our citizens’ penchant – almost enthusiasm – for self-criticism and self-doubt, I have yet to see a time when it made sense to make a long-term bet against America. And I doubt very much that any reader of this letter will have a different experience in the future.
The evidence overwhelmingly supports the Oracle of Omaha. Despite plenty of ups and downs (including the current 5% dip, the 315th since 1928) along the way, equities have proved very rewarding for those with the courage to stick with them,
Valuations: Inexpensive Metrics & Generous Dividend Yield for TPS Portfolio
The secret to success is not to get scared out of them as every downturn has been followed by an upswing of far greater magnitude, so much so that long-term returns for Value stocks have exceeded 13% per annum.
with inexpensively stocks like those that we have long championed leading the long-term performance derby.
We sleep very well at night, given the inexpensive valuation multiples and generous dividend yields associated with our managed account portfolios.
Stock News & Earnings – Updates on 10 stocks across 6 sectors
About the Author
The Prudent Speculator
Explore
Popular Posts
Connect
Subscribe For Free Stock Picks
Get expert investing tips and market insights delivered straight to your inbox.