Strange as it sounds, more than five decades of historical market data demonstrates that Value investors benefit handsomely from higher interest rates. Sure, it’s easy to argue that this time is different, but we should be careful not to discount evidence which supports the thinking that higher rates are good for stocks. While the charts, tables and data in this Insight might not fully convince Wall Street that rising rates aren’t to be feared, we hope the additional context relieves some concern that the stock market train is headed for a derailment.
The result of February’s FOMC (Federal Open Market Committee) meeting was a ‘modest’ 0.25% interest rate hike (Figure 1). The action was accompanied by a mix of hawkish (members focused on inflation) and dovish (members focused on growth) statements, along with the usual uncertainty introduced by Fed Chair Jerome Powell during the subsequent press conference.
Chair Powell said, “We have covered a lot of ground, and the full effects of our rapid tightening so far are yet to be felt. Even so, we have more work to do. Price stability is the responsibility of the Federal Reserve and serves as the bedrock of our economy. Without price stability, the economy does not work for anyone. In particular, without price stability, we will not achieve a sustained period of labor market conditions that benefit all.”
He continued, “Restoring price stability will likely require maintaining a restrictive stance for some time…The U.S. economy slowed significantly last year, with real GDP rising at a below-trend pace of 1 percent. Recent indicators point to modest growth of spending and production this quarter. Consumer spending appears to be expanding at a subdued pace, in part reflecting tighter financial conditions over the past year. Activity in the housing sector continues to weaken, largely reflecting higher mortgage rates. Higher interest rates and slower output growth also appear to be weighing on business fixed investment…Labor demand substantially exceeds the supply of available workers.”
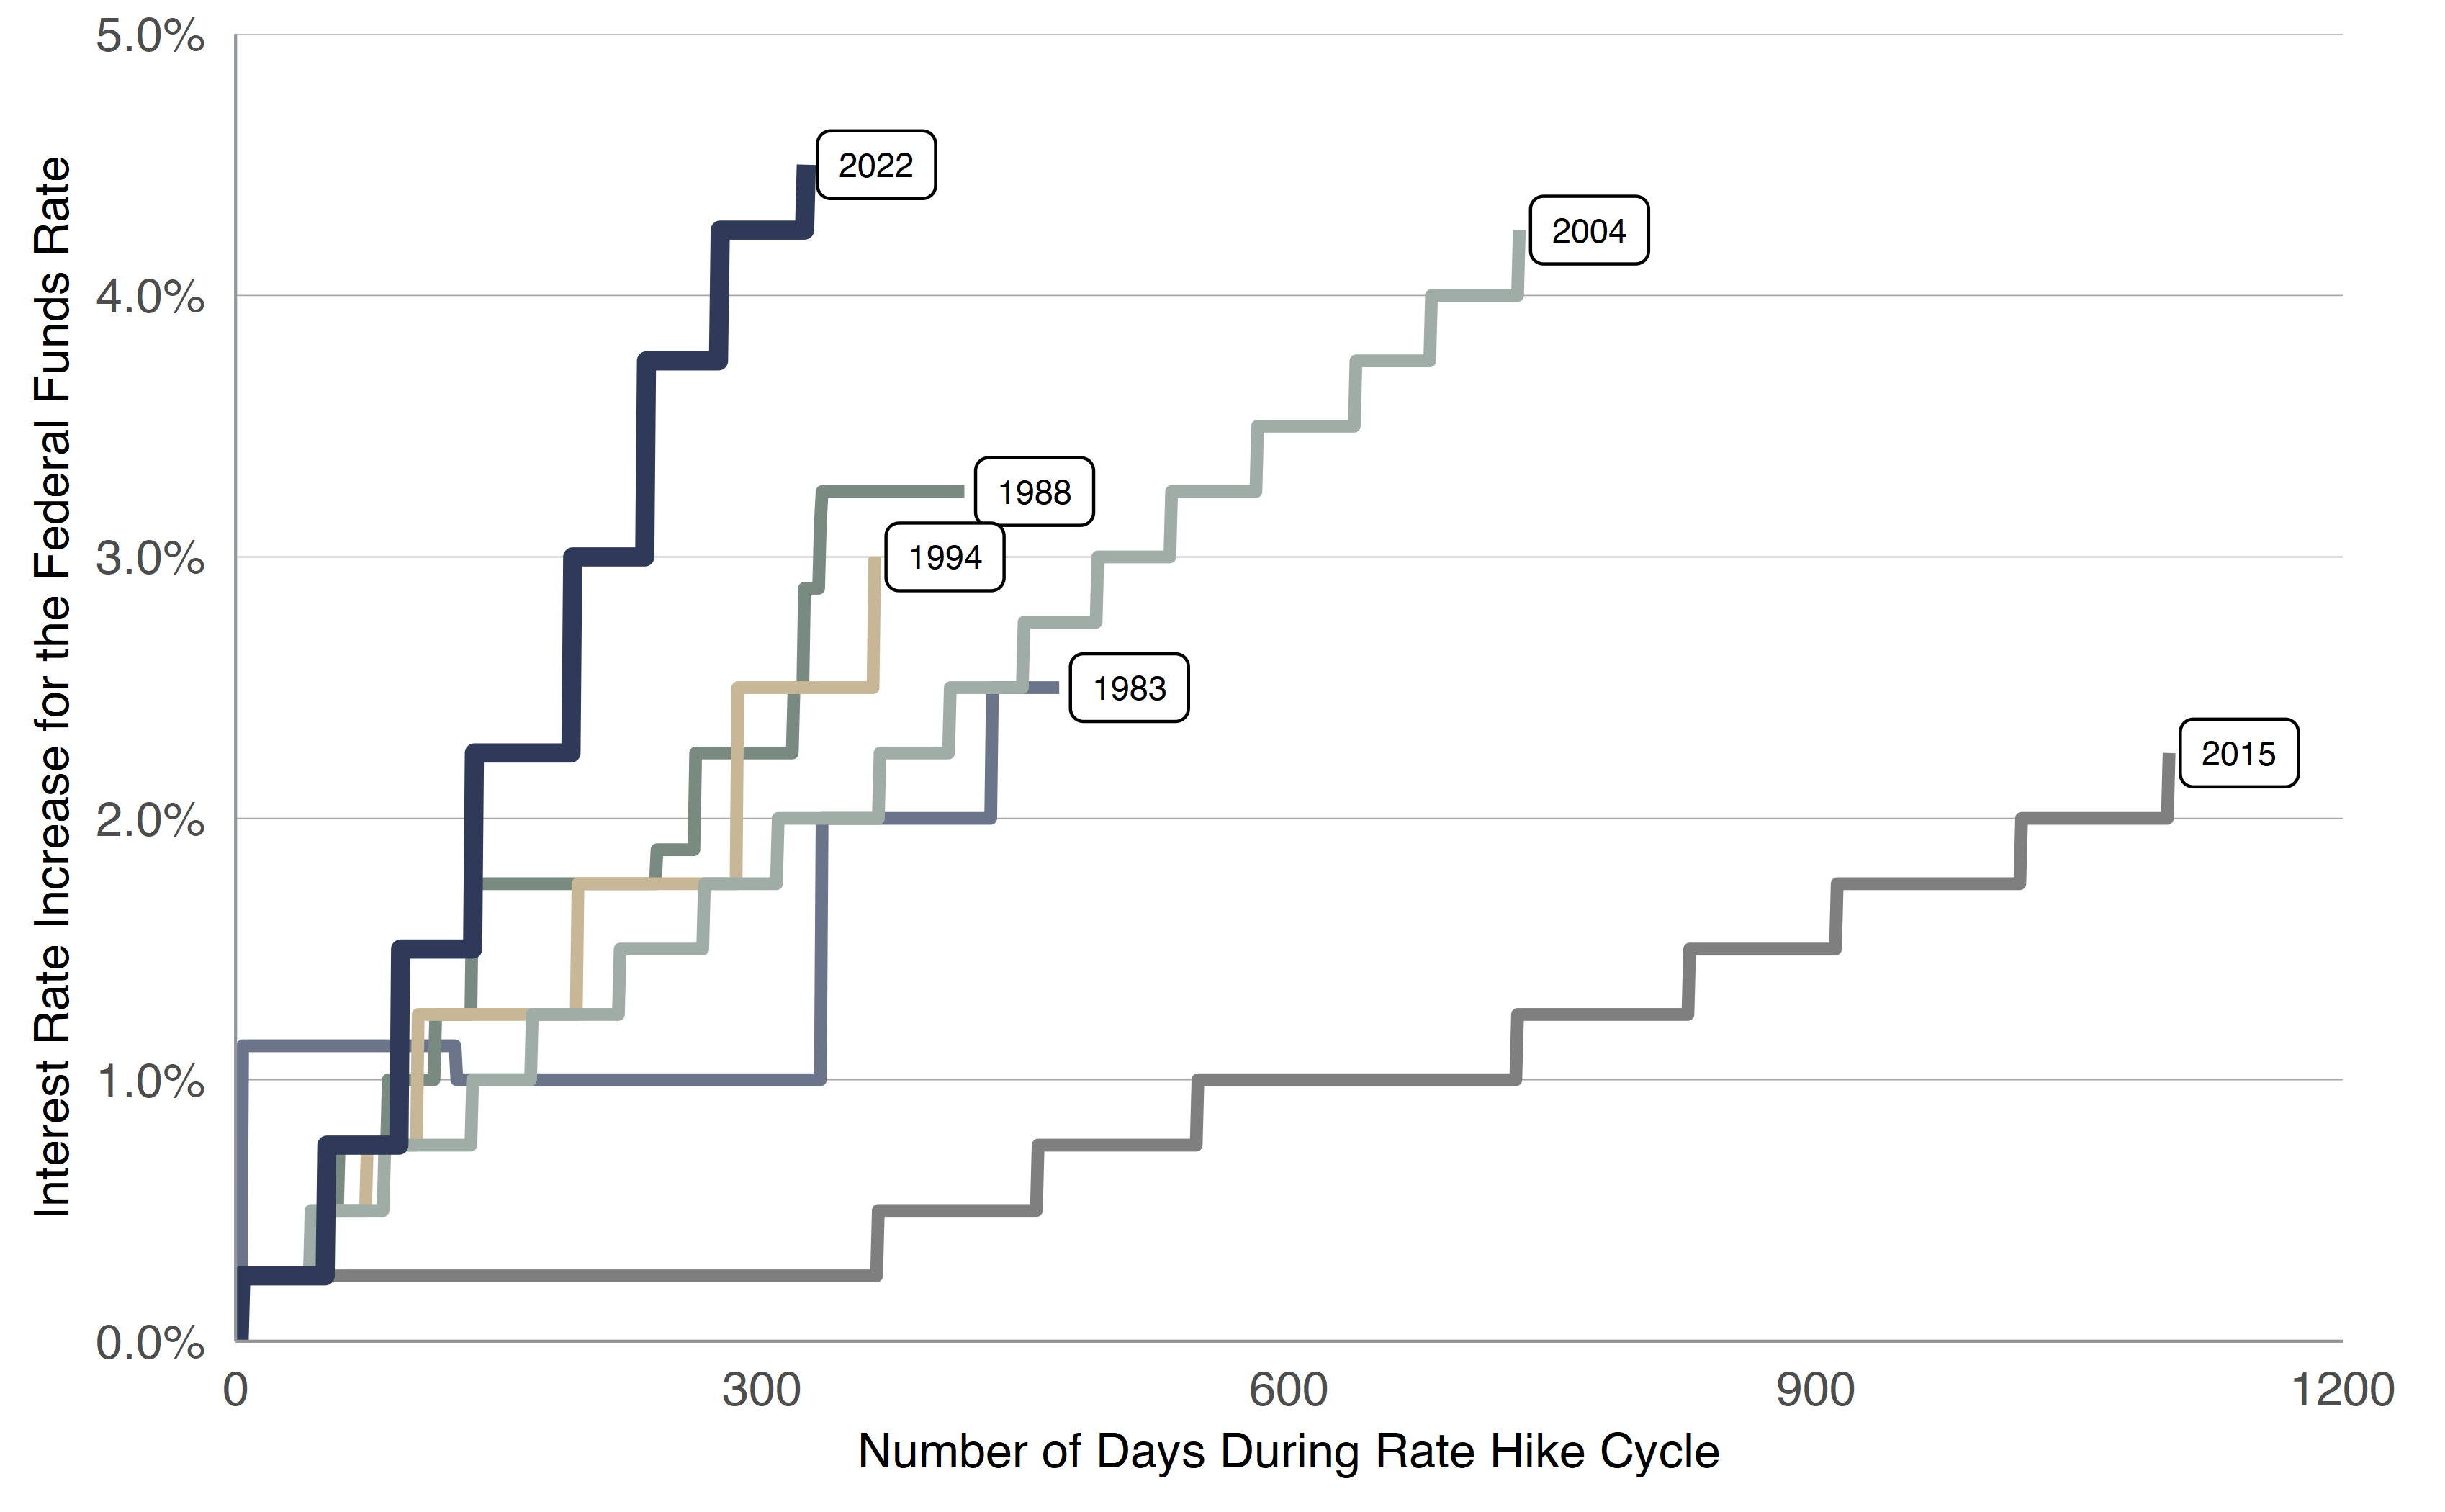
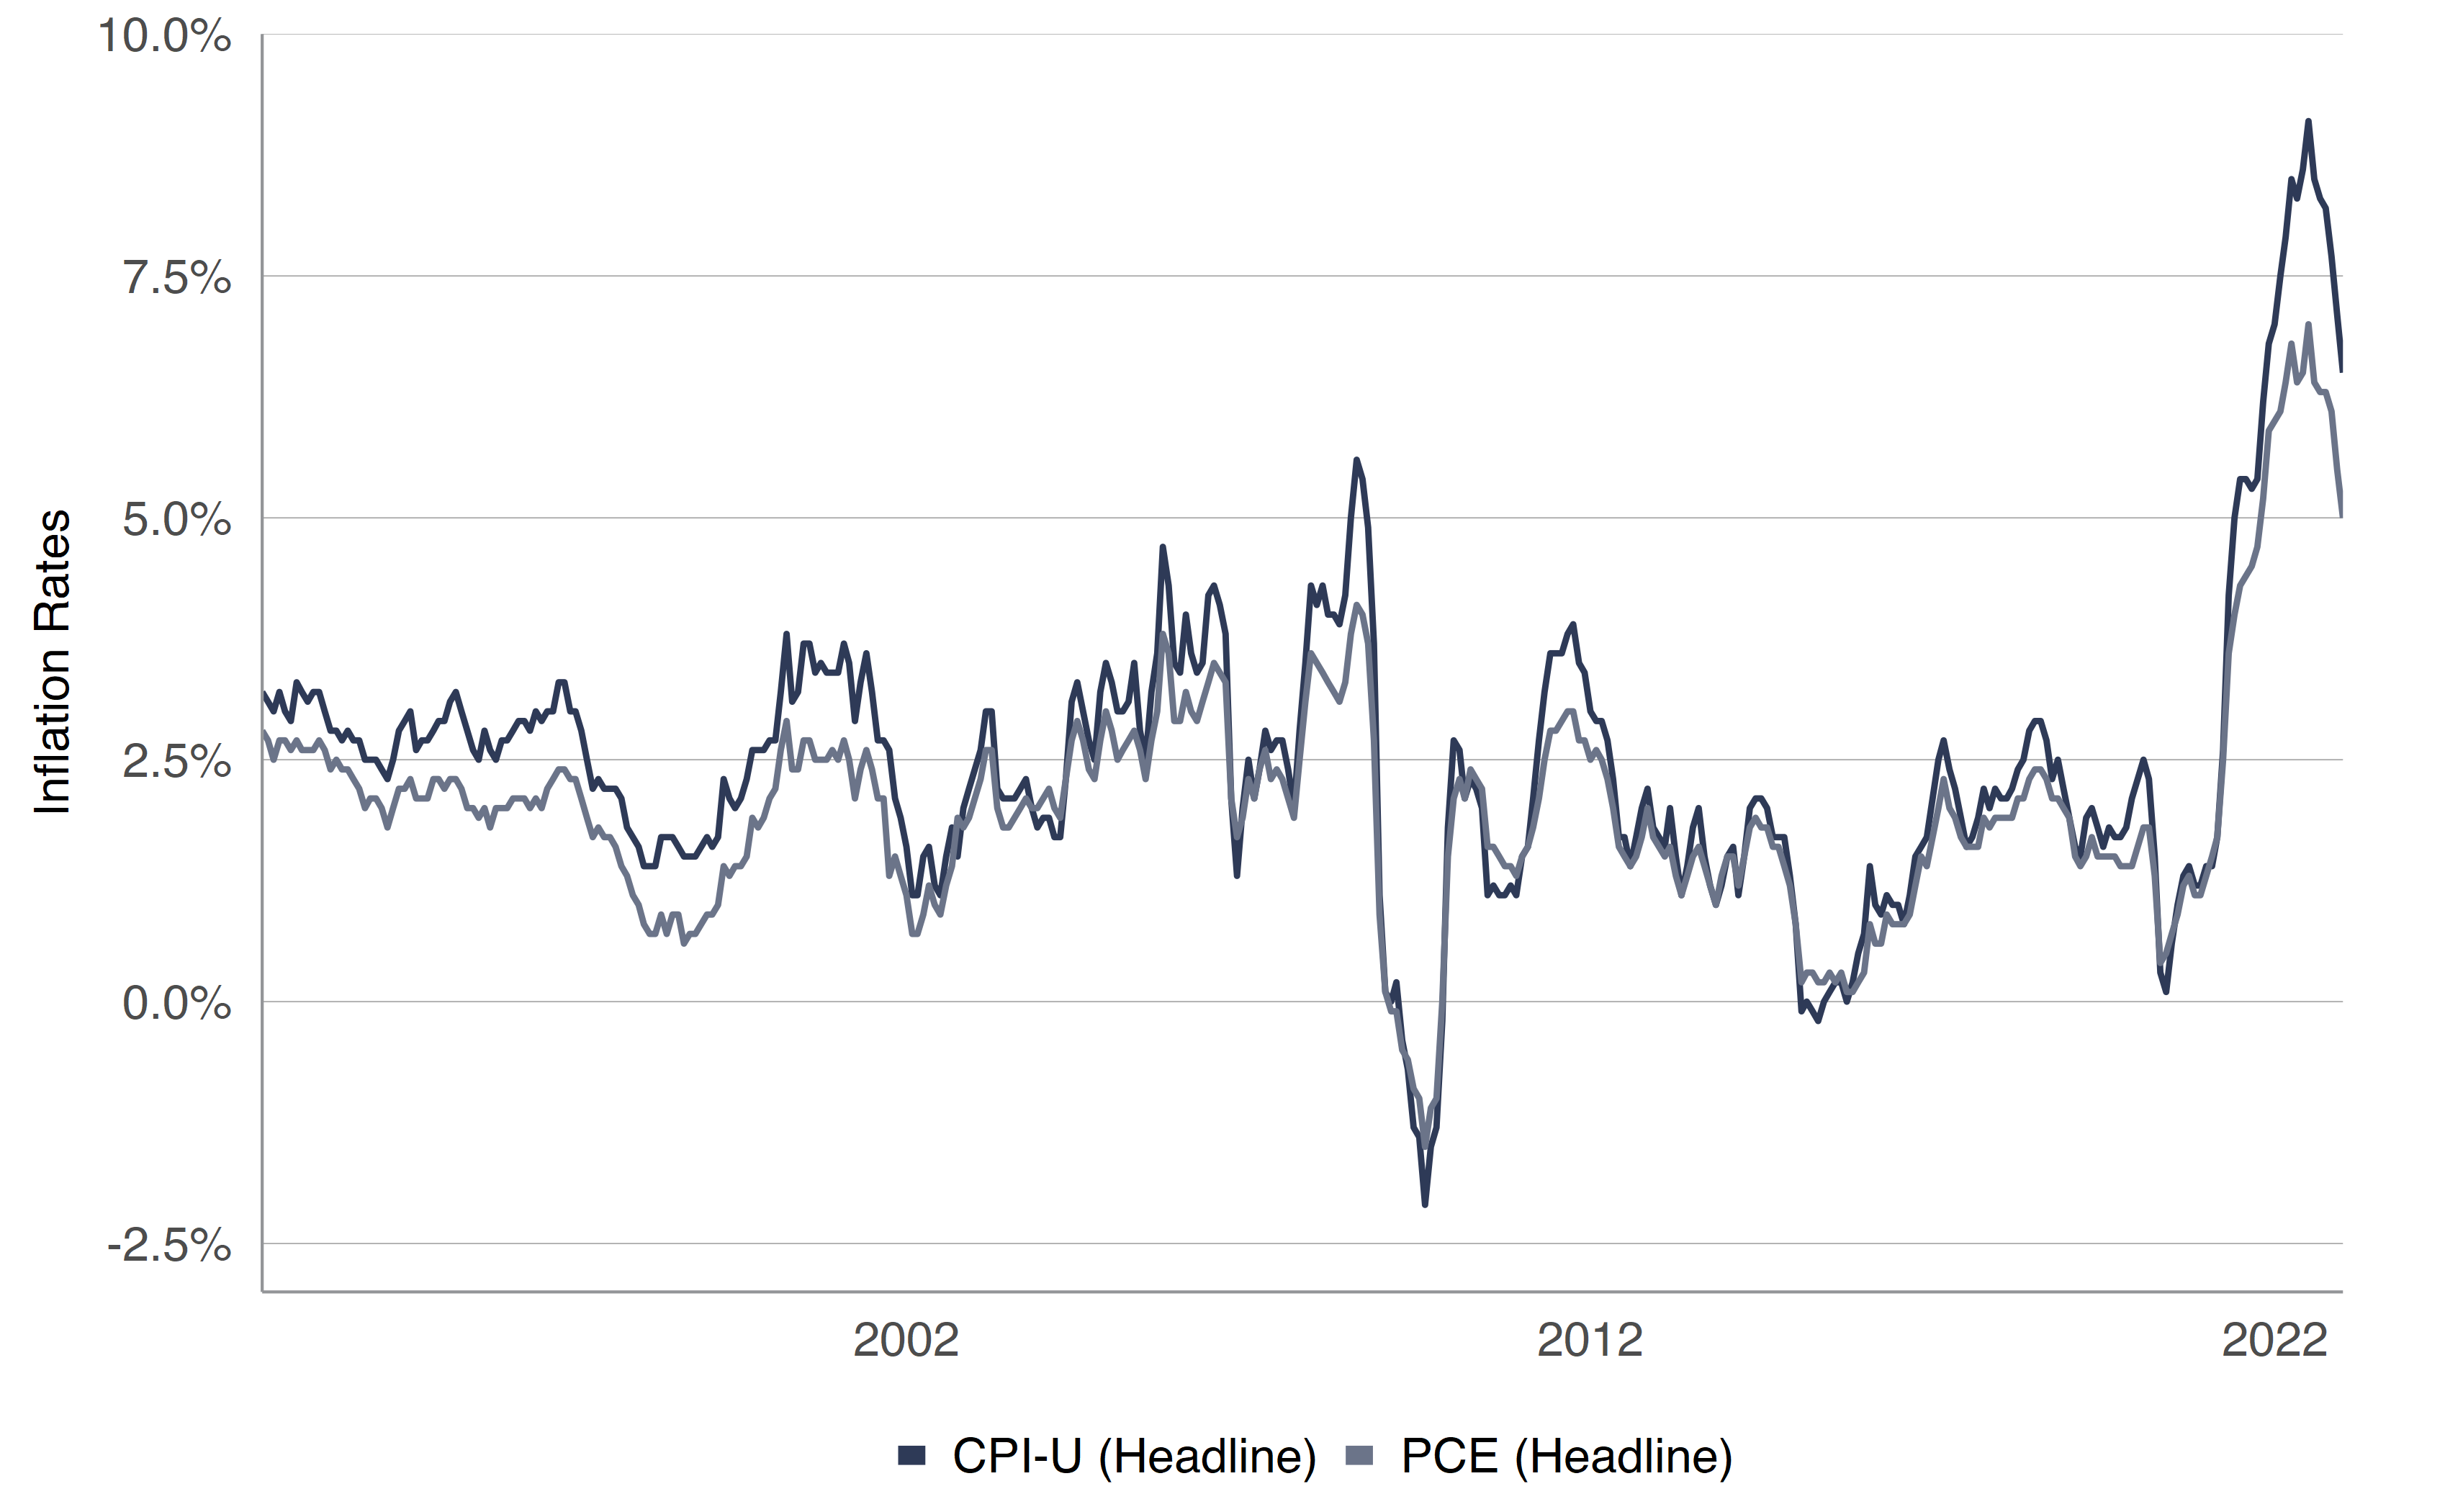
The Chair’s comments sent mixed messages to market participants. On one hand, the rate hikes were working to tame inflation (Figure 2), suggesting rates could peak soon in order to avoid pushing the economy into a recession, thus achieving a ‘soft landing.’ Better late than never, we suppose. On the other hand, the labor market remains robust with demand for workers ‘substantially’ exceeding supply, suggesting further hikes would be helpful to keep the cooling effect going. The competing forces are surely top of mind for Mr. Powell as his ‘data-dependent’ path forward evolves. We think the uncertainty around rates started to ease late last year as the Fed began slowing the pace of interest rate changes from 75 basis points (bps) (0.75%) to 50 bps to 25 bps at the February meeting. Perhaps there are just one or two hikes left. We will find out soon enough.
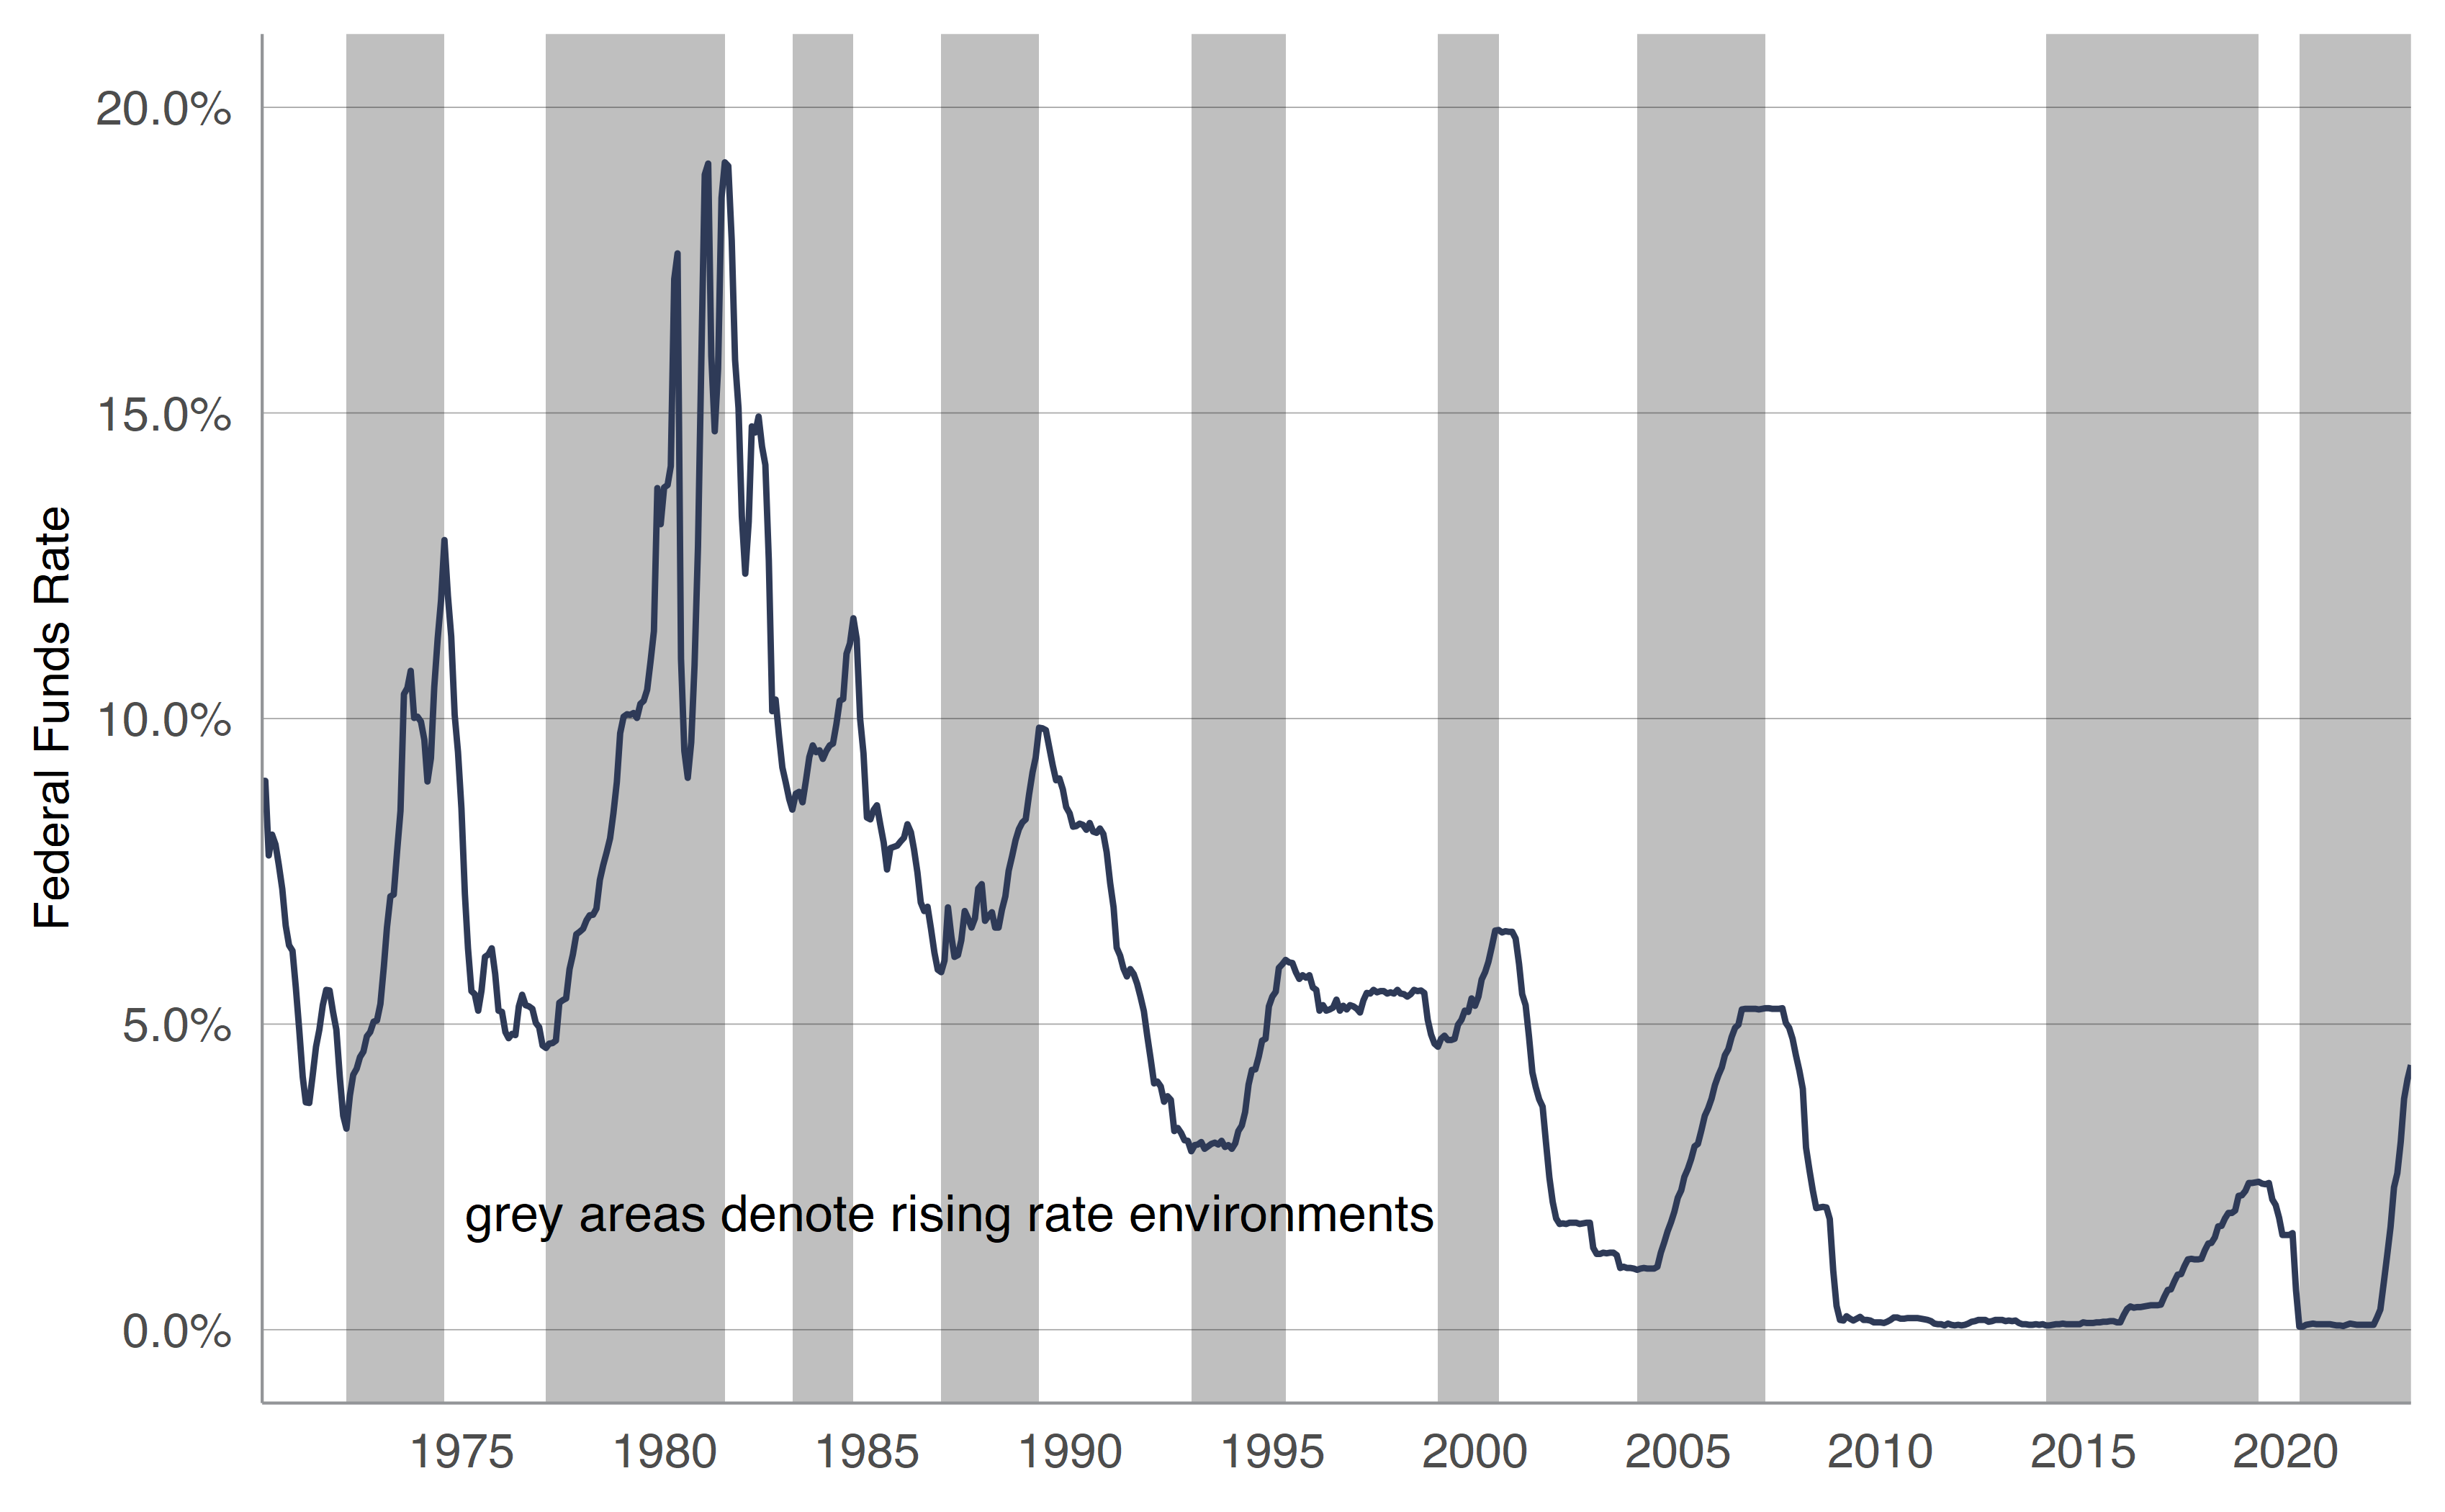
Figure 3 shows the Federal Funds Rate remains below long-term historical averages. No question, the rate volatility and nearly 20% cost of borrowing in the early 1980s might send shivers down spines, but we remain far from those levels and there are no grand indications that the economy needs 10%+ rates to fix the current inflationary headwinds.
RATES ARE RISING
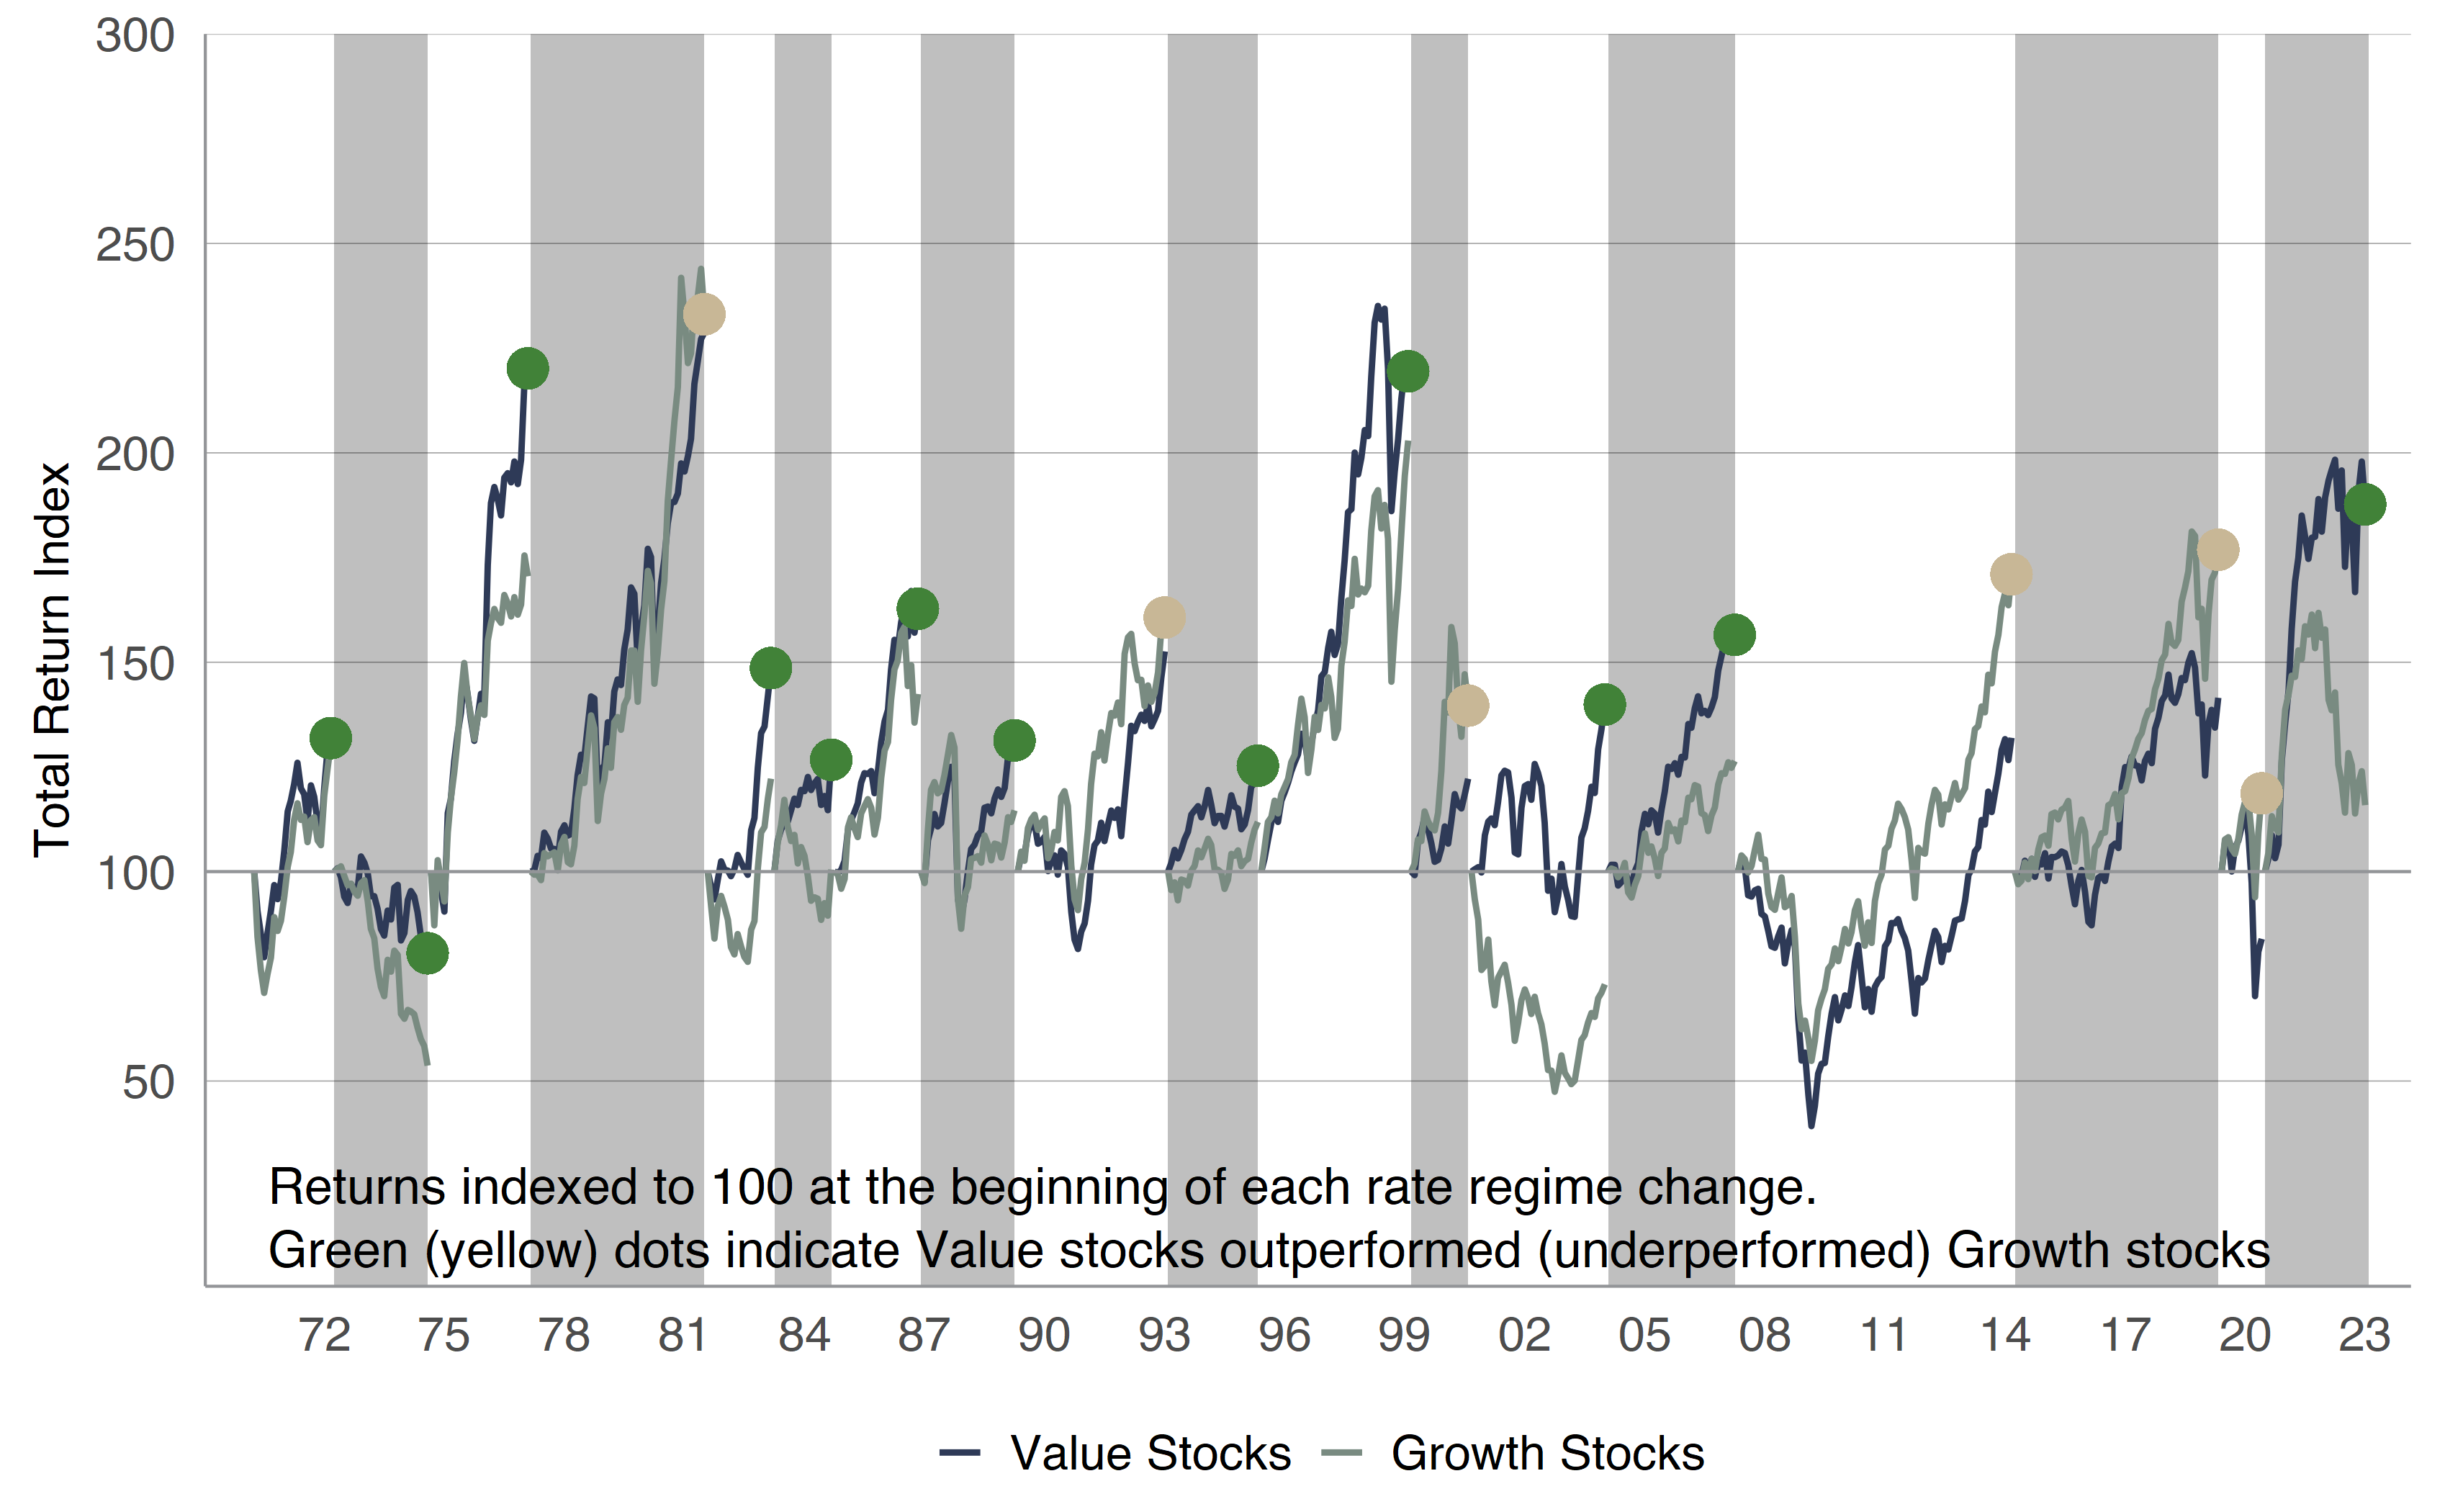
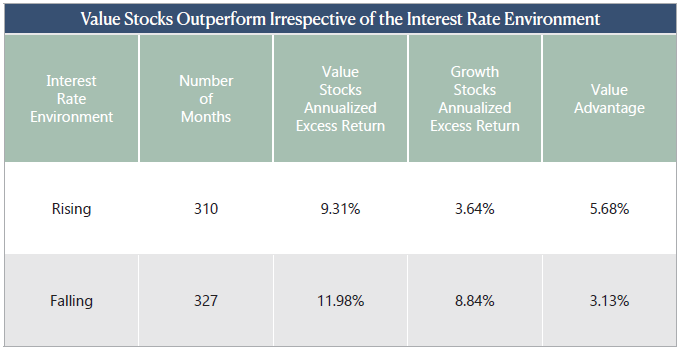
A rising rate environment heightens concern that risk assets, including stocks, will decline in price due to the higher cost of capital. We think this effect is less pronounced for Value stocks than their Growth counterparts. Yet, historical data reaching back to 1969 in Figure 4 suggests that stocks are generally indifferent about the interest rate environment. When the rate environment switches between rising and falling, we reset the Value vs. Growth performance race to 100. Green dots indicate Value outperformed Growth, and yellow dots indicate Growth outperformed Value. The rising rate environments are shaded in grey. More than 50 years of market history suggests that stocks have tended to rise throughout interest rate cycles, even if there are short-term gyrations that might cause one to rethink plans to stay the course.
Over five-plus decades, Value stocks have notched wins against Growth stocks in 12 of 18 rate environments and the margin by which they win is substantial. In Figure 5, we compare Value and Growth stock returns in rising-rate and falling-rate environments using excess returns (the monthly stock index return less the monthly risk-free cash return). We think the excess return method enhances the analysis because the comparison removes the bias that comes with the actual level of rates.
RATES HAVE RISEN
It’s all fine and well that Value stocks do well during rising rate environments, but we are now more than a year into this rising-rate cycle and borrowing costs have risen to levels we haven’t experienced in more than a decade. Surprisingly, high rates have not brought market doom. In fact, they actually don’t seem to matter much at all.
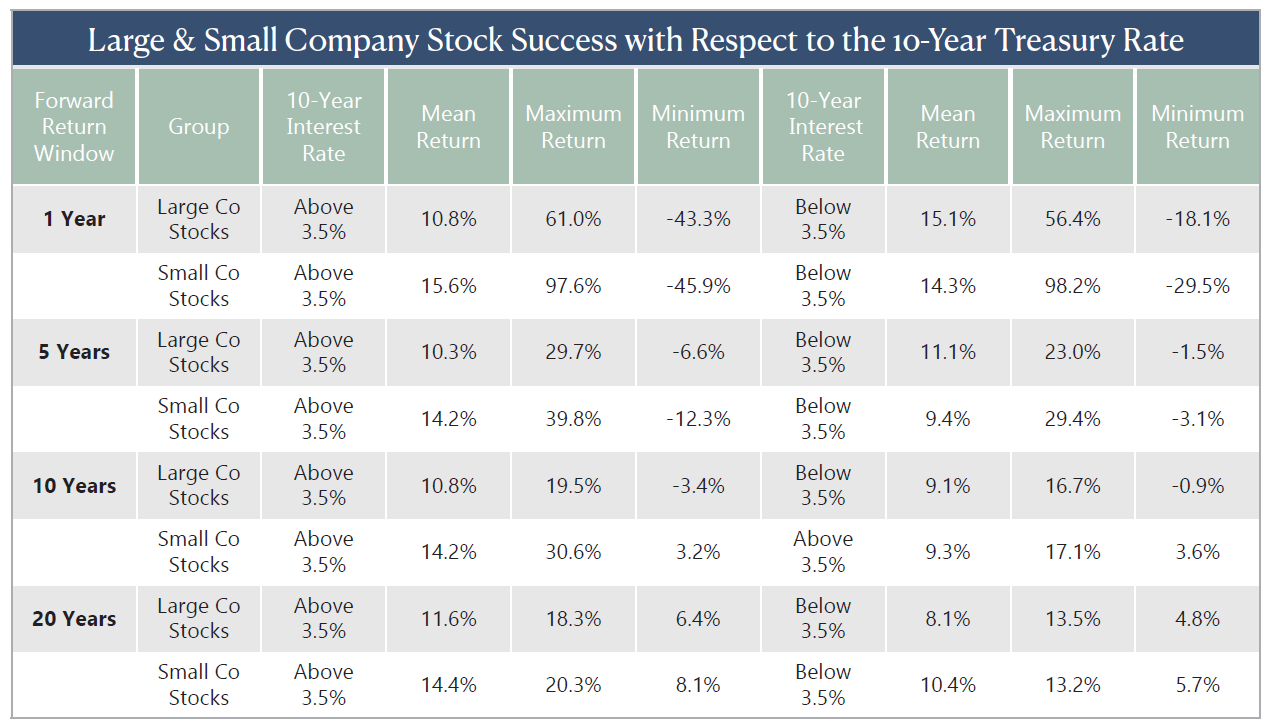
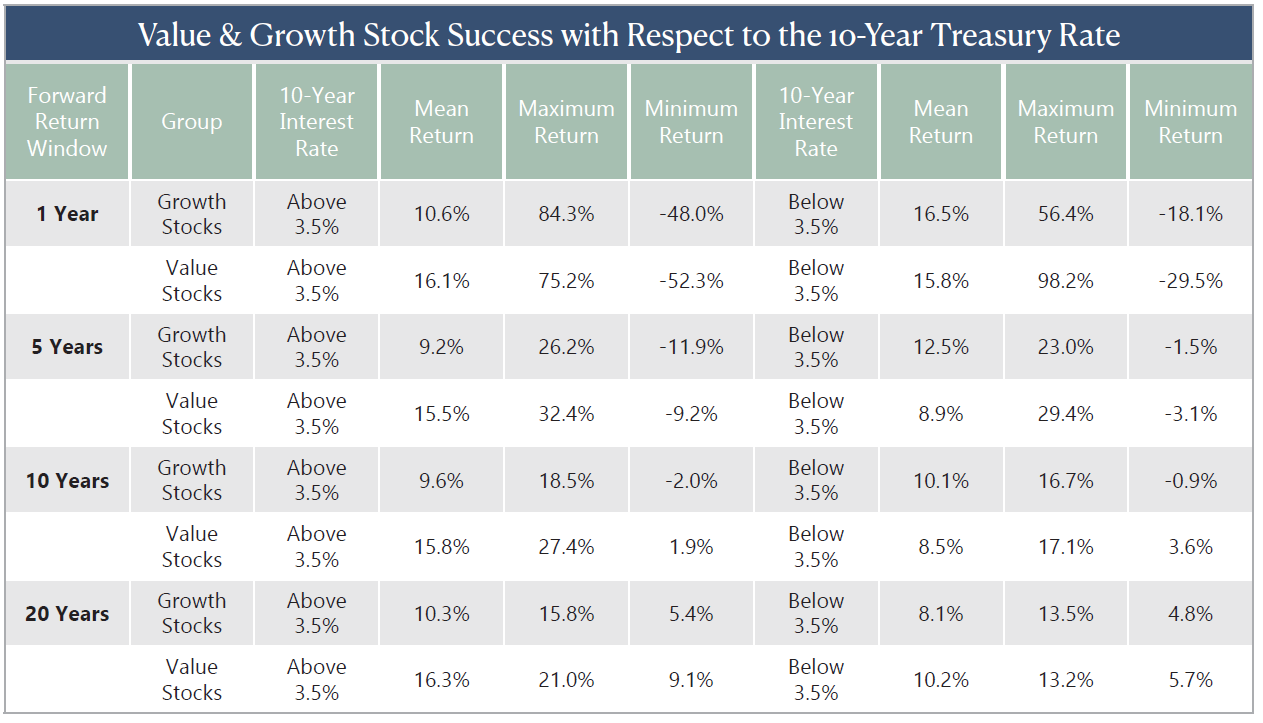
Figures 6 and 7 present forward returns depending on the 10-Year U.S. Treasury rate being above or below the 3.5% level on January 31. While the difference between the best outcomes and the worst is fairly wide, the mean return for all categories is positive one year forward. Unsurprisingly, the returns are better for Small Company (15.6%) and Value stocks (16.1%) than those of Large Company (10.8%) and Growth (10.6%), but are still positive on balance. Looking out twenty years, the minimum return moves from negative to positive for all four factor portfolios.
TERMINAL VELOCITY
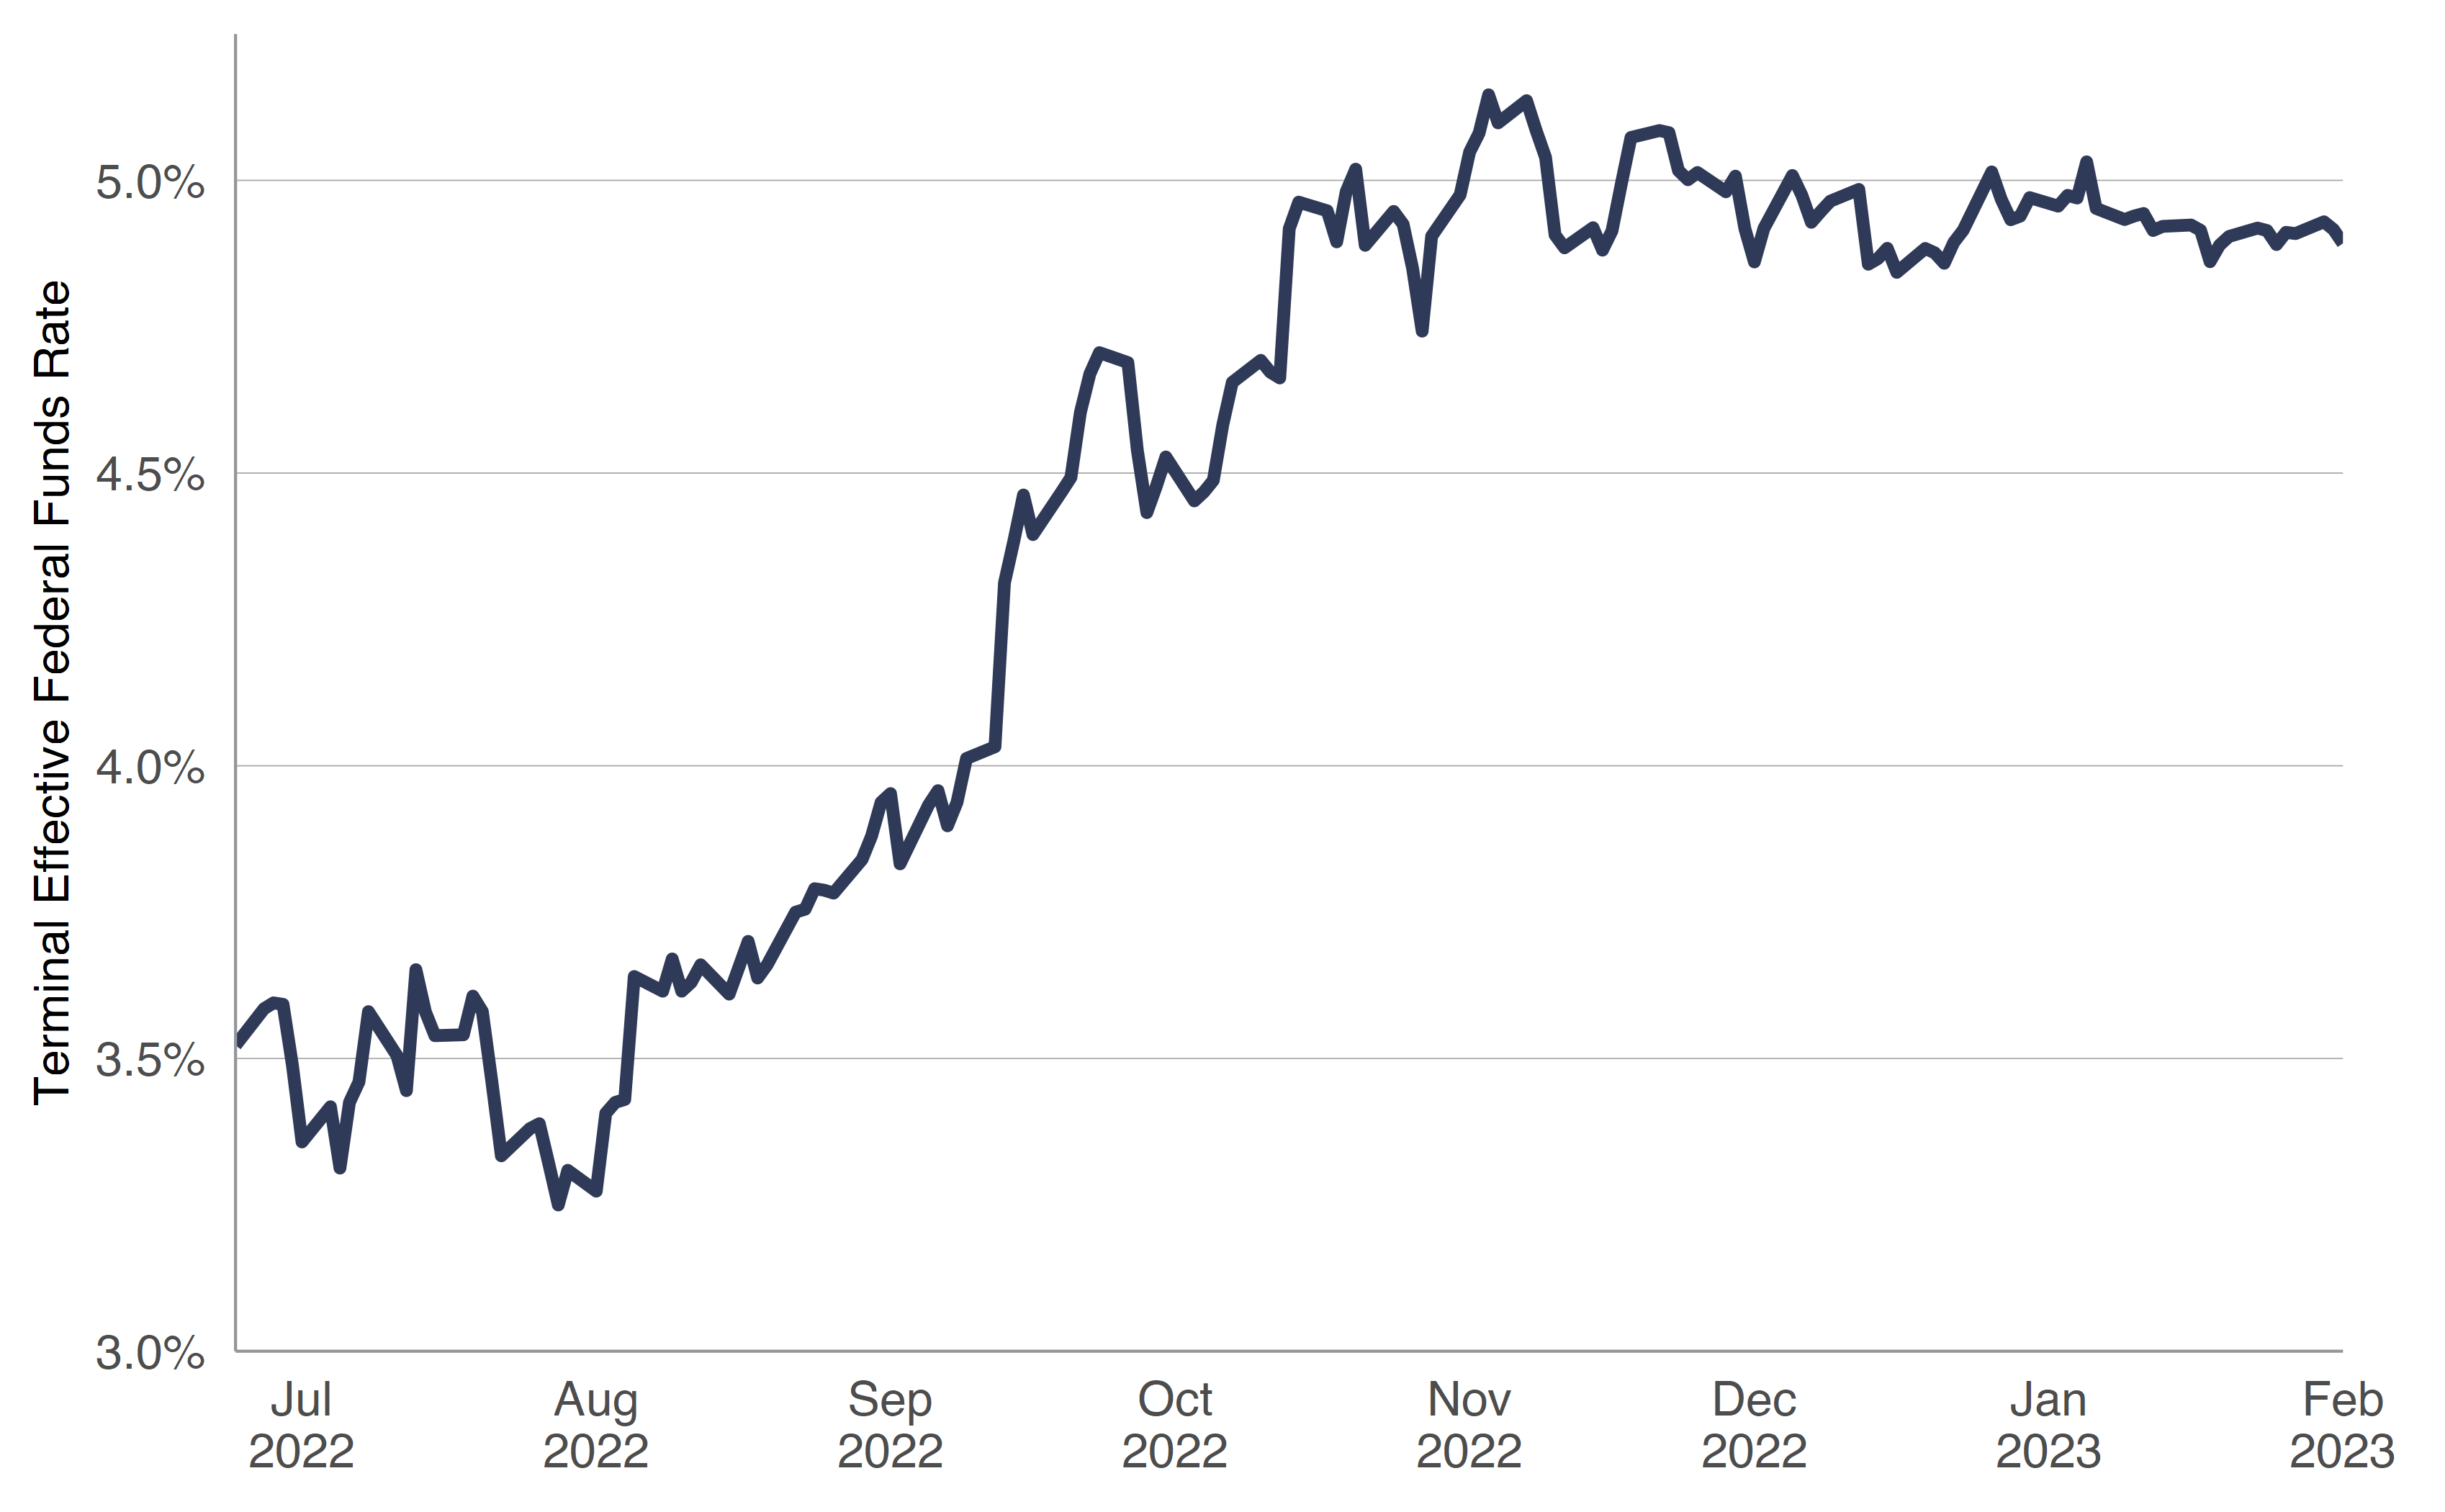
The expected high point for the Effective Federal Funds rate has hovered around the 5% level since late October, even though the Federal Reserve was still hiking rates at a pace of 0.75% per meeting at the time. While the rate increases hadn’t started to slow, inflation figures were starting to come down and a swell of optimism resulted in a tide change for stock returns in Q4.
HOPE FOR THE ELUSIVE SOFT LANDING
In the days preceding the Fed’s February meeting, the pundits on television were hard at work trying to make sense of the market’s short-term gyrations. It would probably come as a surprise, despite the persistent hand-wringing by anchors and their guests, that the S&P 500 index actually rose in value in the lead-up. Plus, the index’s return for January was a solid 6.3% as prospects for a ‘soft landing’ began to rise. No question, there’s some needle-threading to be done to concurrently achieve economic growth and tame inflation, while the calls for a recession have been pushed from mid-2022 to late 2022 to early 2023 and now to mid-2023. A recession will eventually happen and the worriers on television will eventually be right, but we are far from convinced they’ll get their reasoning correct.
It could be considered a sport to bet money on short-term market moves–a stressful one at that–but for the excitement of ups and downs, there are negative performance implications to consider. There are always reasons to worry about the future, even though it’s easy to forget there are always reasons to believe in a bright future. Of course, positive takes usually make poor headlines, which in turn does not sell newspapers. We believe the comparative lack of coverage is not great for most investors, especially as there’s a body of research from DALBAR and Morningstar that shows emotion can adversely impact investor returns.
This Insight should offer some evidence to counter the pervasive idea that rising rates are bad for stocks. They’re not, on average. Plus, market history suggests the present level of rates should not be particularly concerning to investors either, even if it’s a bit shocking to see mortgage or other debt rates soaring from extremely low levels. Rising rate environments are a normal market phenomena and should not deter investors from staying the course. The stock market always seems to be on the edge of a precipice, yet we refuse to let near-term worries weaken the enthusiasm we have for the long-term prospects of our Value-oriented, broadly diversified portfolios.
STOCK PICKS
For those who share our passion for value investing, we offer 10 inexpensive and generous yielding stocks for consideration. Long-term-oriented investors, we think, should take a look at chemical producer Celanese (CE), oil & gas concern Civitas Resources (CIVI), regional bank Comerica (CMA), retailer Kohl’s (KSS), staffing services company ManpowerGroup (MAN), homebuilder MDC Holdings (MDC), pharmaceutical titan Pfizer (PFE), semiconductor designer Qualcomm (QCOM), poultry and beef giant Tyson Foods (TSN) and telecom behemoth Verizon Communications (VZ).