
The Prudent Speculator Weekly Commentary is expertly curated every week as a valuable resource for stock market news, investing tips, business insights, and economic trends as it relates to value stock investing. In this week’s market commentary, we discuss Volatility, AAII Sentiment, Historic Perspective and more. We also include a short preview of our specific stock picks for the week, the entire list is available only to our community of loyal subscribers.
Executive Summary
Week – Big Rally on Friday, But 601st Worst Five-Day Period Ever; S&P Hits Correction Territory
Volatility – Stocks Go Up and Down in the Short Term, But Have Provided Handsome Rewards in the Long-Term
Sentiment – Major AAII…and Univ. of Michigan Contrarian Buy Signal
Perspective – In the Fullness of Time, Stocks Have Overcome Tariffs, Government Shutdowns, Russian Events, Recessions, Inflation & Fed Actions
Valuations – Liking the Metrics on our Portfolios
Stock News – Updates on INTC, ORCL, VWAPY, DKS, AEO, VZ, ABT & ETN
Week – Big Rally on Friday, But 601st Worst Five-Day Period Ever; S&P Hits Correction Territory
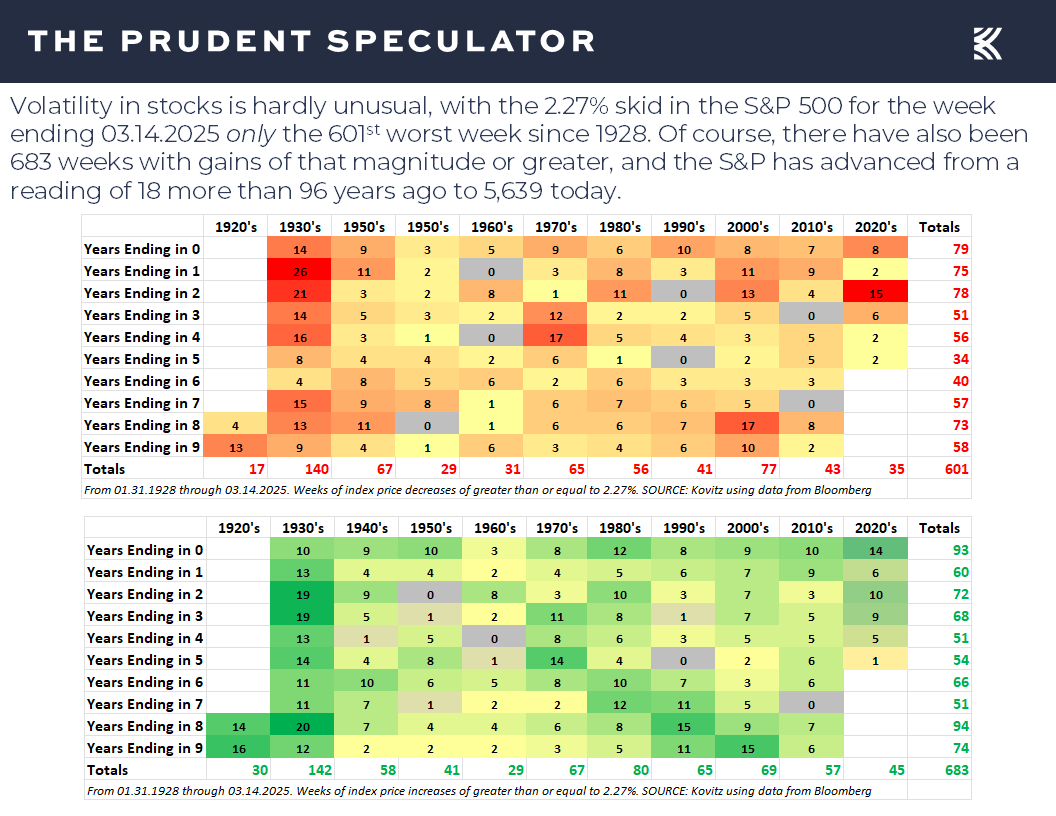
While we will always believe that uncertainty is the friend of the buyer of long-term value, the equity market sailing was again very rough last week. Indeed, despite a big rally on Friday, stocks endured a second straight week of sizable losses, turning in the 601st worst weekly period since 1928.
Volatility – Stocks Go Up and Down in the Short Term, But Have Provided Handsome Rewards in the Long-Term
Of course, there have been 683 weeks over the last 96+ years with gains of even greater magnitude than the latest downturn and long-term returns have been terrific for those able to cope with the numerous bouts of downside volatility. Value Stocks and Dividend Payers have posted double-digit percentage average long-term returns, despite the markets suffering 5% setbacks 3 times per year, on average, 10% corrections every 11 months and even 20% Bear Markets every 3.4 years.

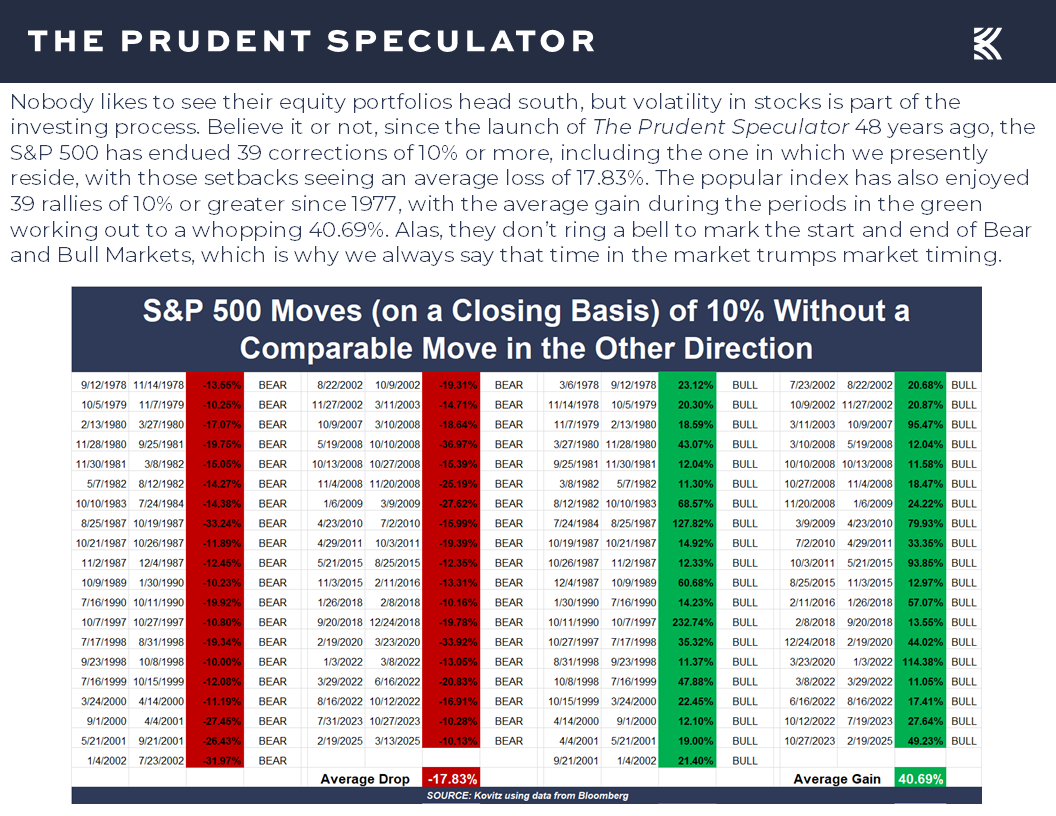
Time will tell if the current trip south extends further, but the S&P 500 pierced the 10% correction threshold on Thursday, marking the 39th decline of that level or greater since the launch of our newsletter 48 years ago this month. Happily, there have also been 39 advances of 10% or greater over the same nearly half century, with an average gain of 40.69% during those periods dwarfing the average drop during corrections of 17.83%.
Sentiment – Major AAII…and Univ. of Michigan Contrarian Buy Signal
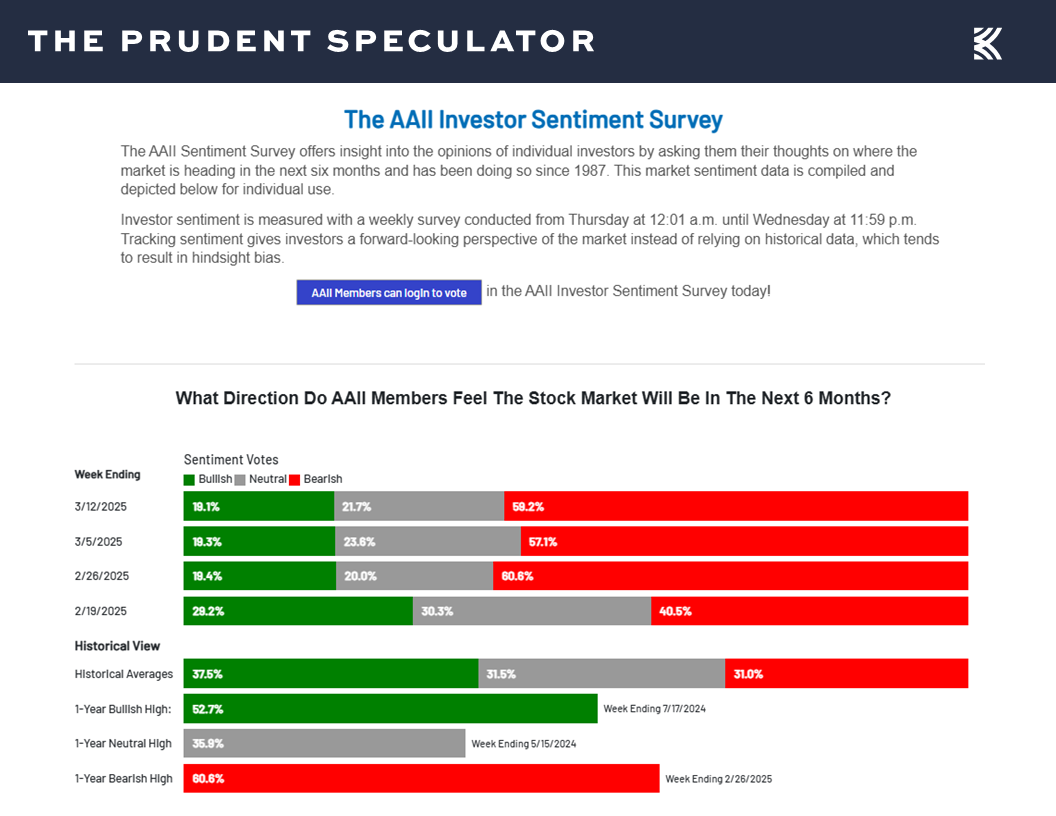
No doubt, fear levels are running high, with the latest weekly Sentiment Survey from the American Association of Individual Investors (AAII) showing only 19.1% of those polled saying they were Bullish on the prospects for stocks over the next six months, versus 59.2% who said they were Bearish.
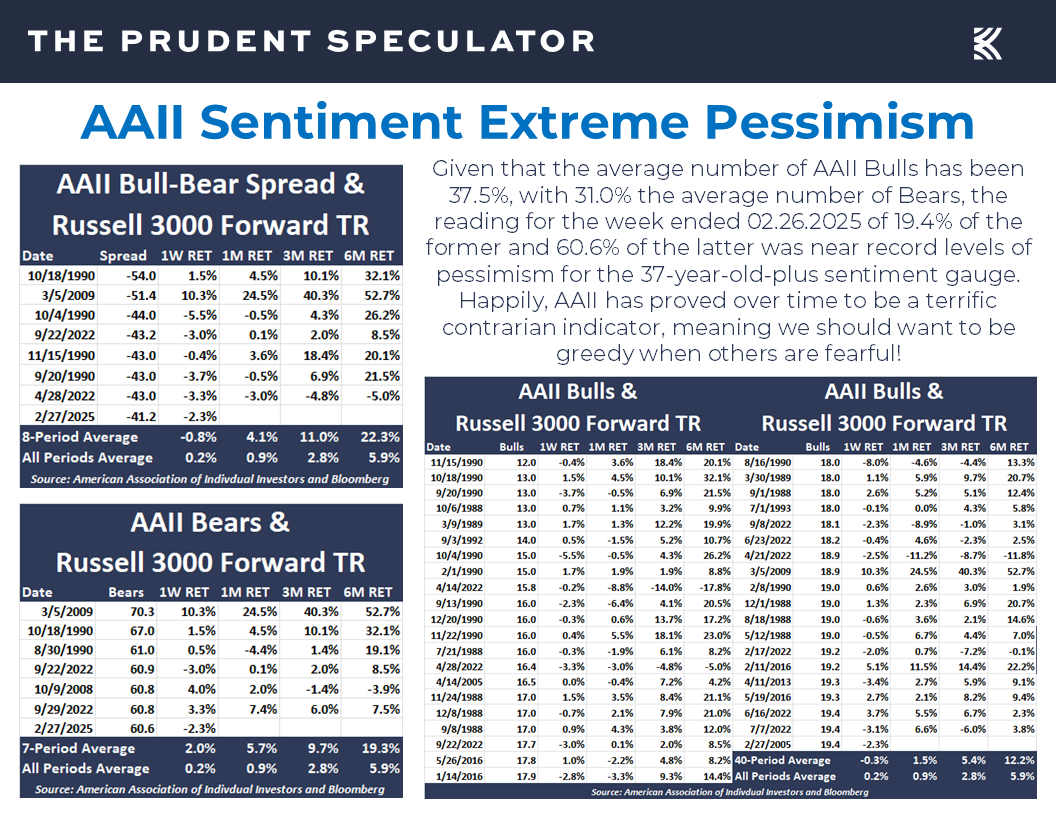
There are no guarantees that past is prologue, but such a lopsided level of pessimism warms our contrarian hearts, especially given the AAII one-month, three-month and six-month forward return numbers for equities in the chart below. It historically has paid handsomely in the long run to be greedy when others are fearful.
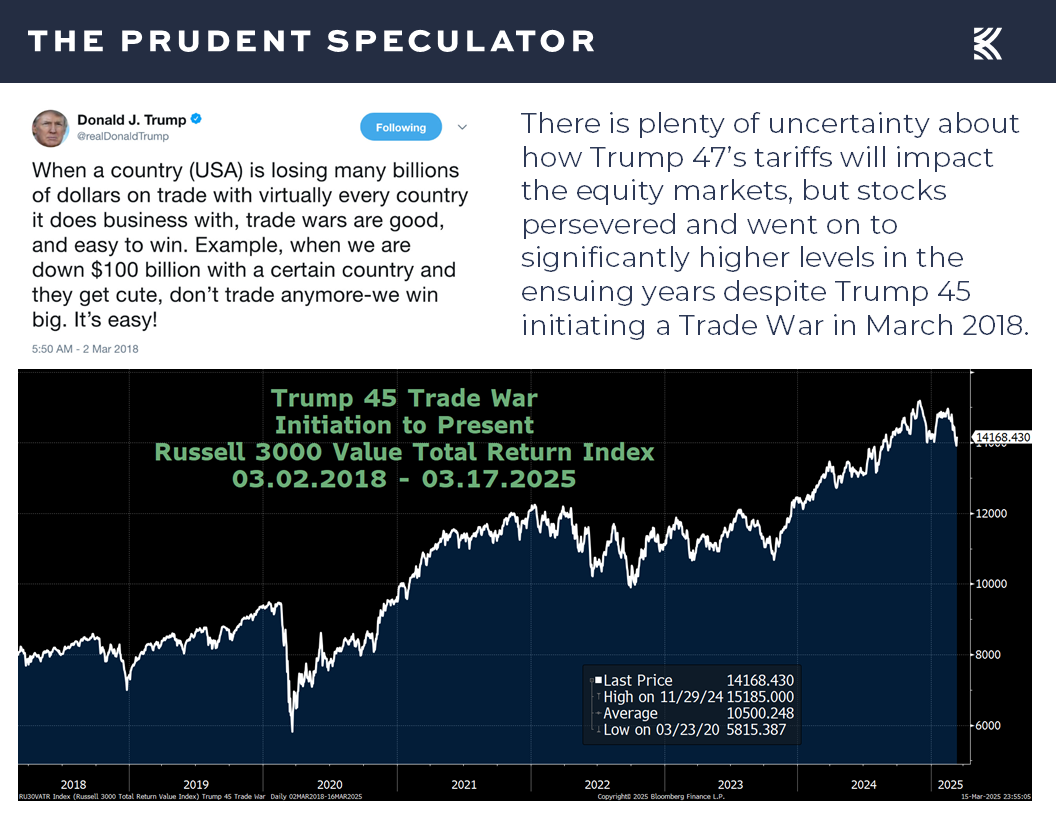
Certainly, we realize there is plenty about which to worry these days, starting with the on-again, off-again tariff uncertainty,
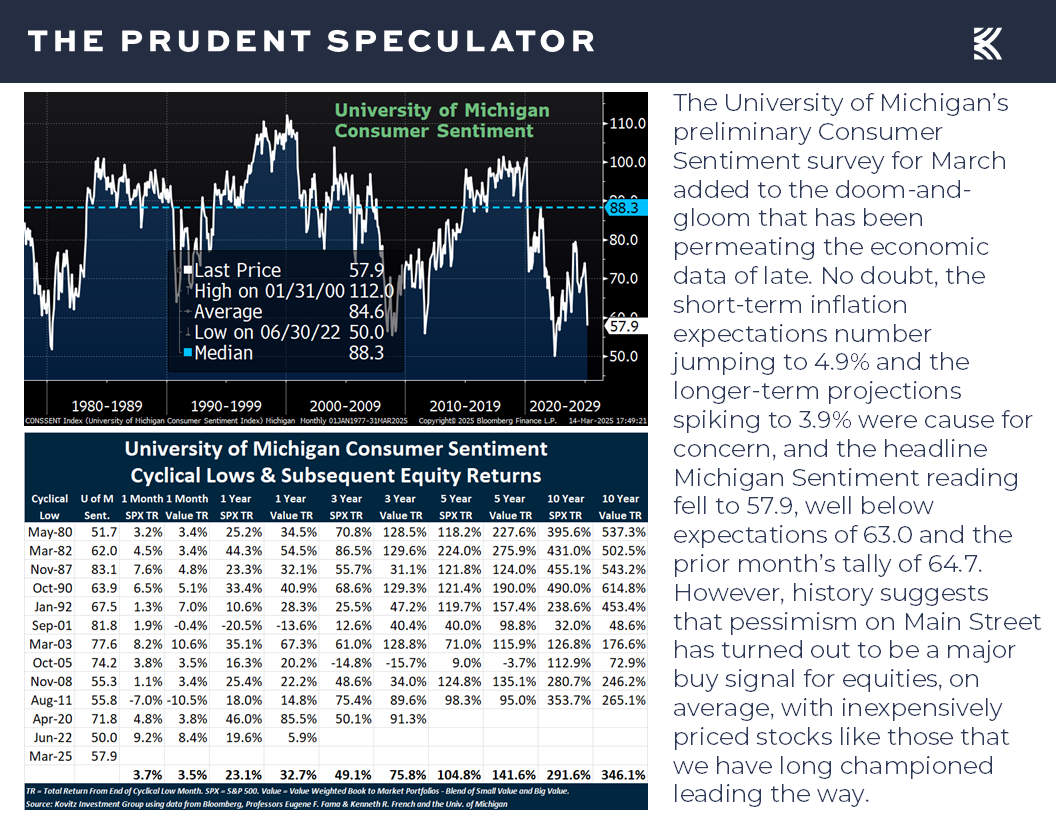
while we learned last week from the University of Michigan that Consumer Sentiment plunged this month to the lowest level since 2022, which, believe it or not, might be another contrarian buy signal, at least based on prior cyclical lows for the gauge.
To be sure, anything can happen as we move forward, and this (and every time) is different, but we keep ourselves on an even emotional keel by evaluating what has occurred previously when various events have occurred.
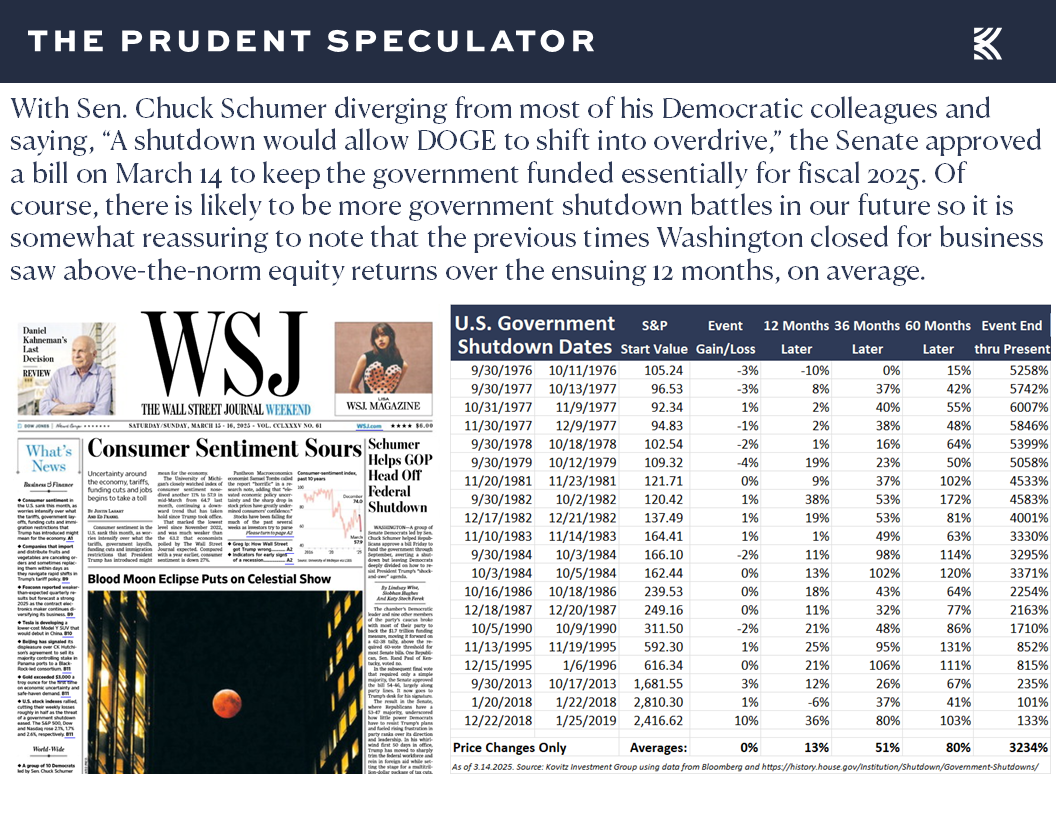
For example, some of the angst last week was due to concerns about a looming government shutdown, but Washington closing its doors has happened 20 times previously, and stocks have performed fine, on average during the closure and even better than usual 12 months, three years and five years later.
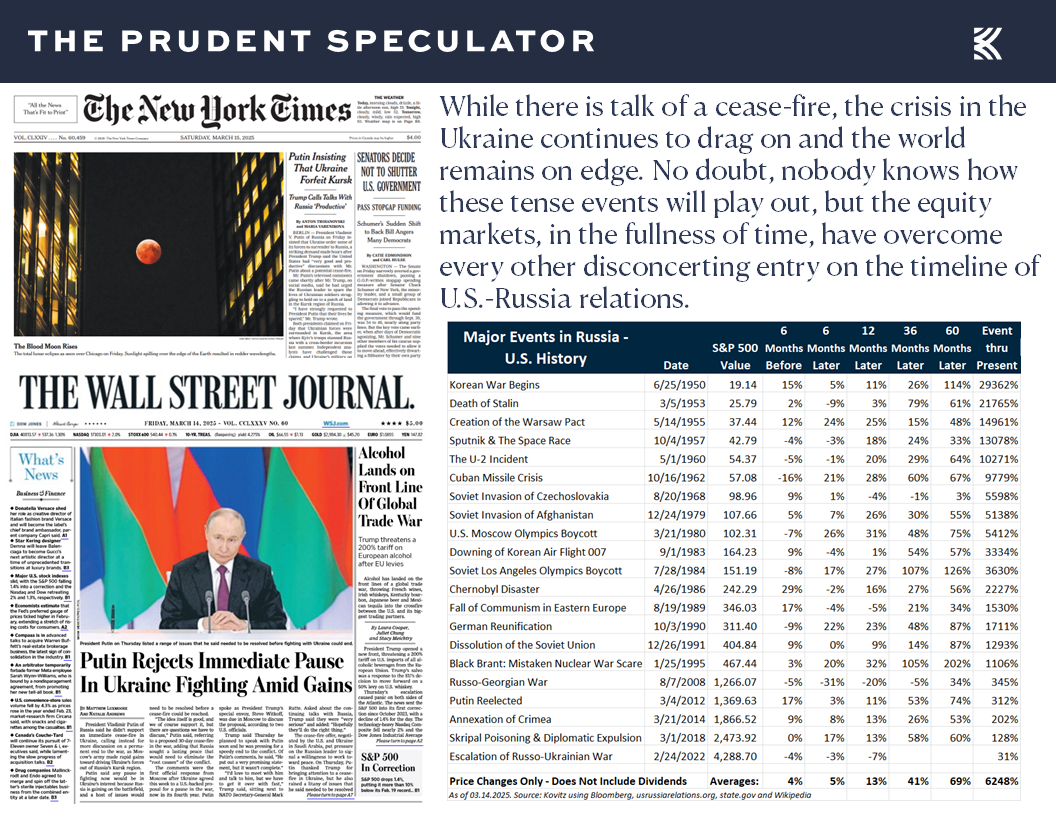
Vladimir Putin is also on the minds of investors, and it has been the same favorable performance story, on average, following major events on the Russia-U.S. timeline.
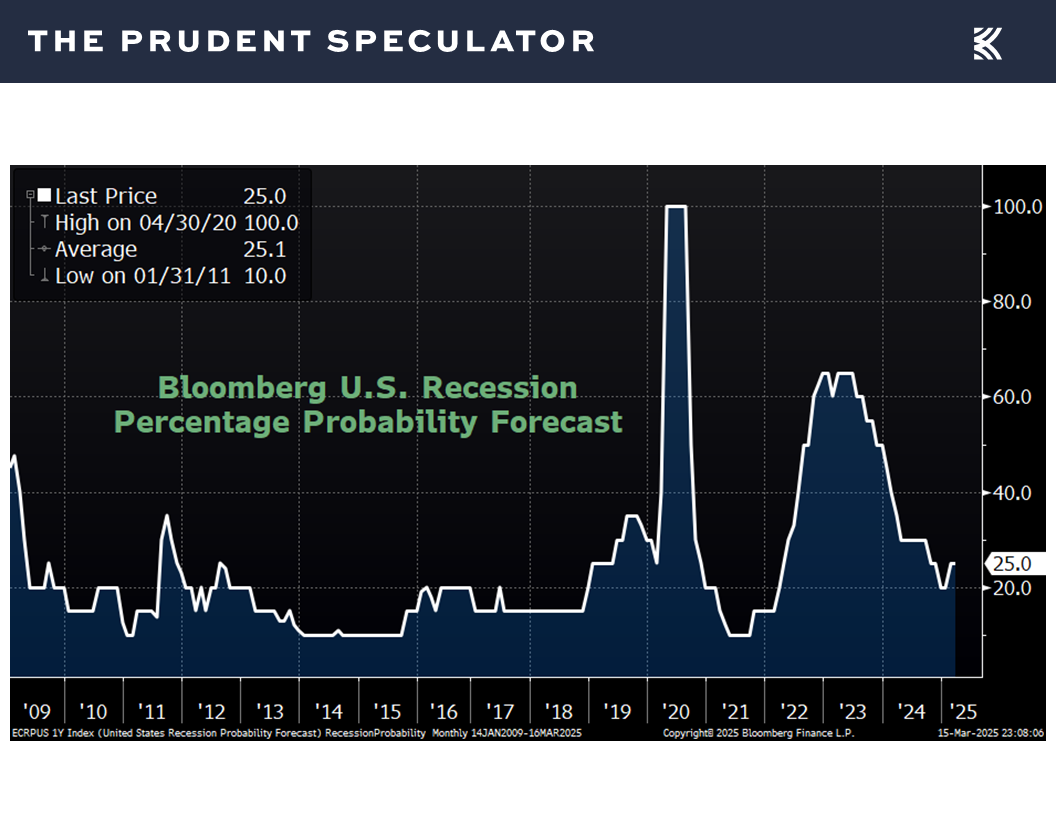
The odds of a U.S. recession, as tabulated by Bloomberg, have also risen of late,
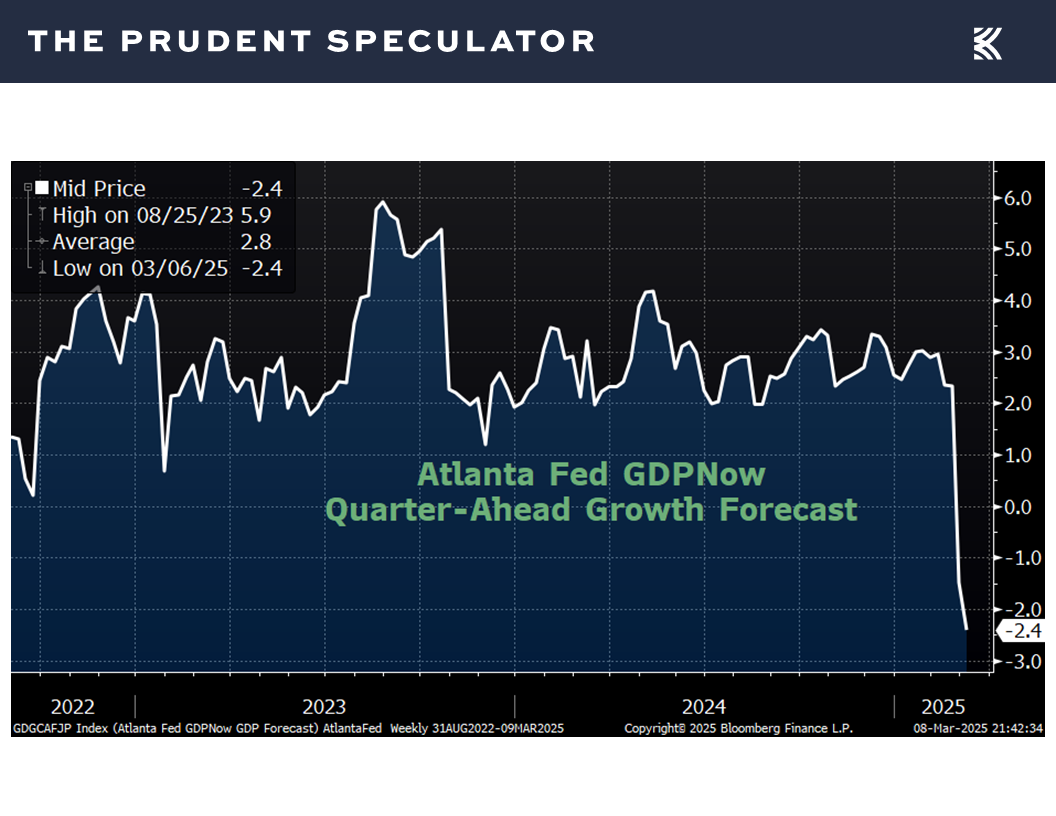
…as there was a sizable dip in the most recent projection for real (inflation-adjusted) Q1 GDP growth from the Atlanta Fed,
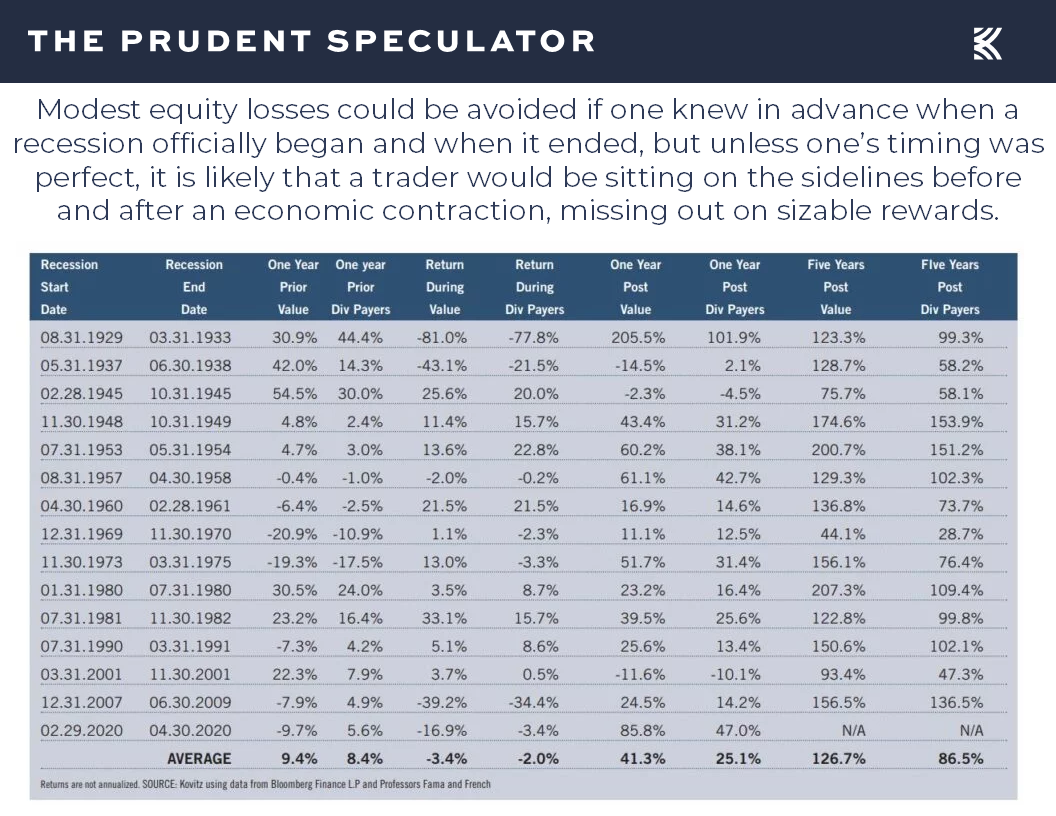
but even if we could predict when an economic contraction started and ended, long-term investors would want to stay the course, lest they miss out on solid returns, on average, in the year prior and massive average gains in the year after a recession.
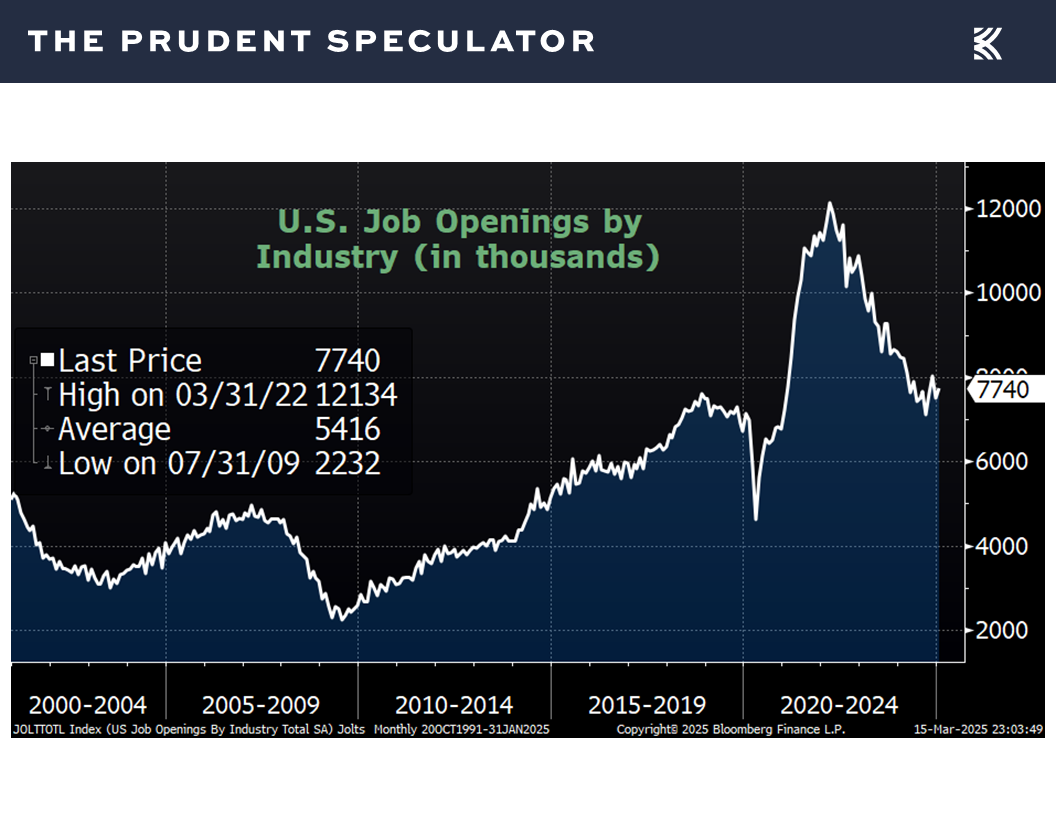
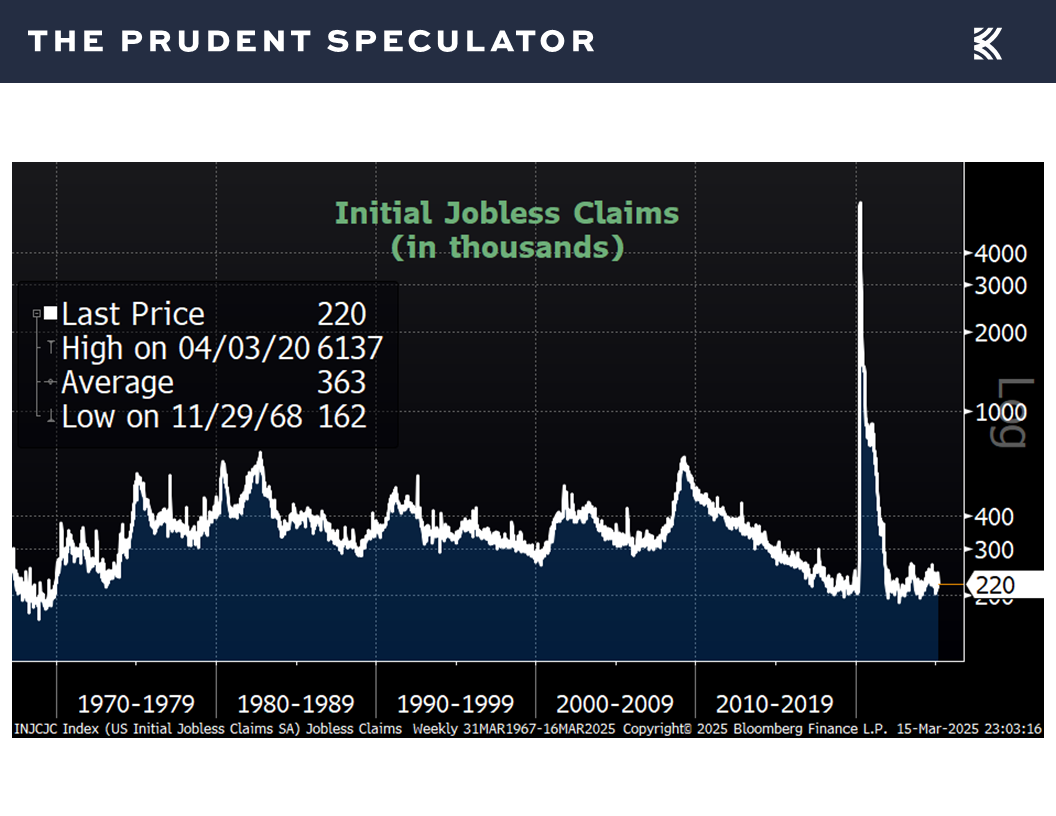
Of course, we might argue that other economic data out last week suggest the chance of recession is low, as both job openings rising to 7.74 million in January,
and first-time filings for unemployment benefits in the latest week inching down to 220,000 were both better than estimated.
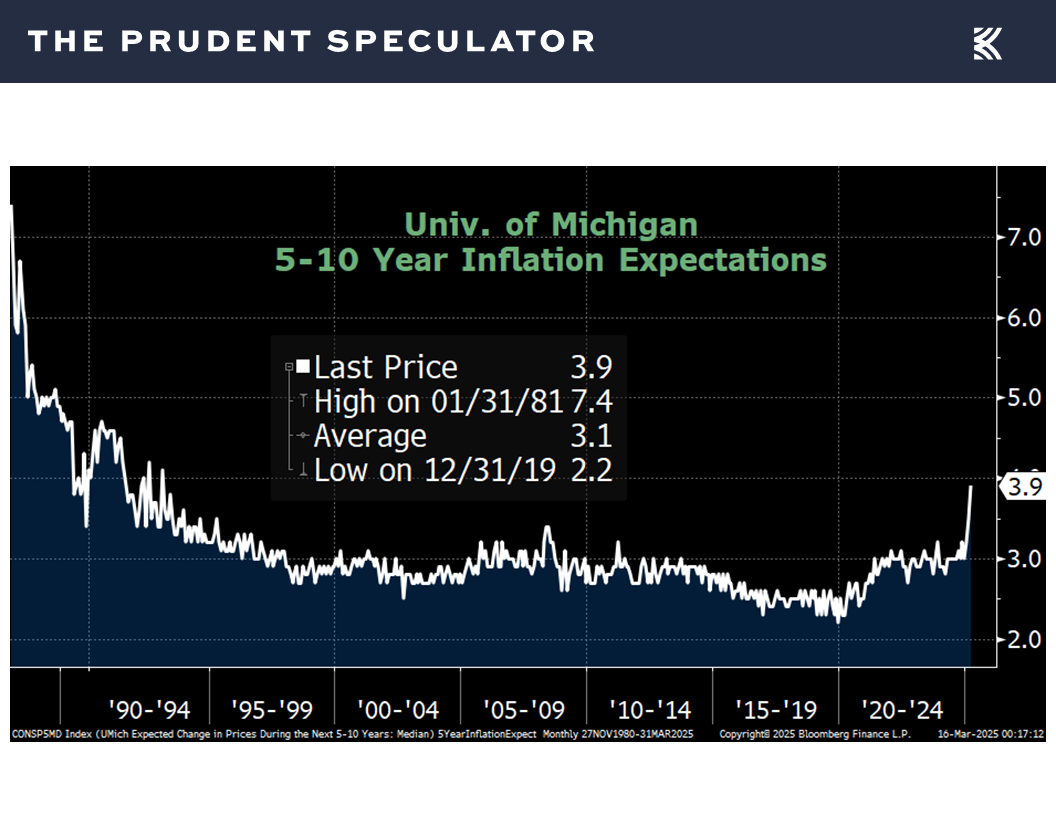
Obviously, there was consternation about long-term inflation expectations in the Univ. of Michigan survey soaring to 3.9%, the highest in 32 years,
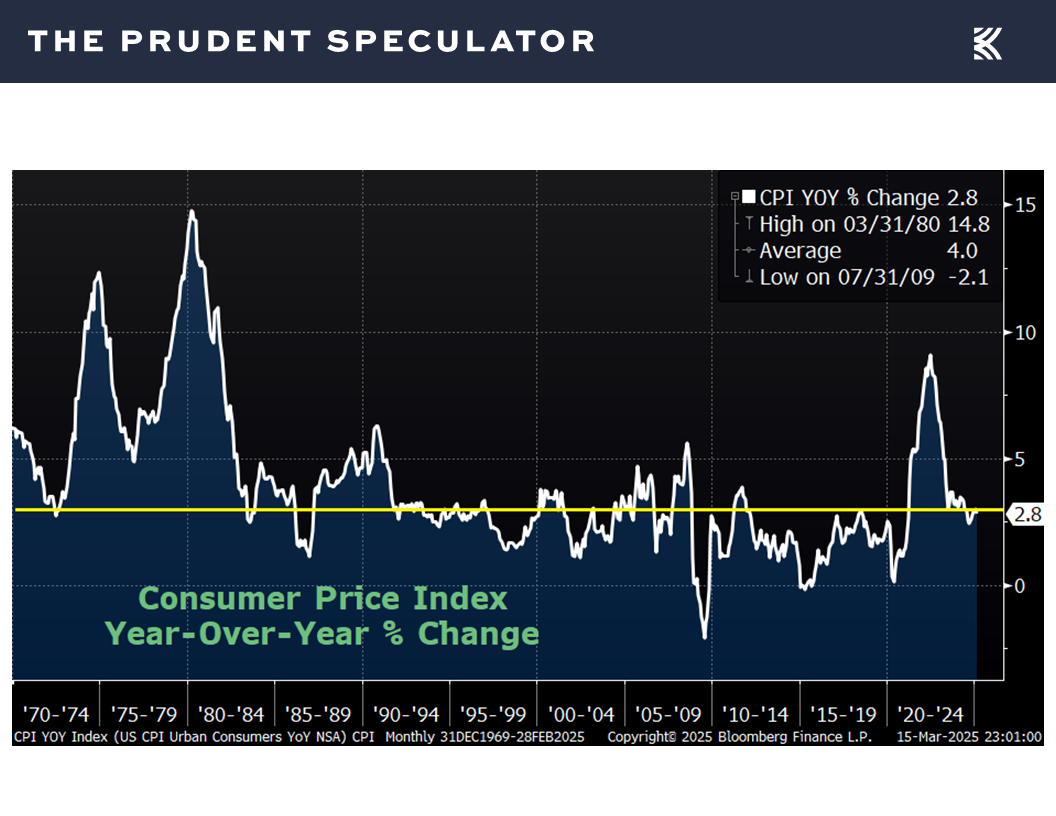
but the increase of 2.8% in the Consumer Price Index (CPI) for February,
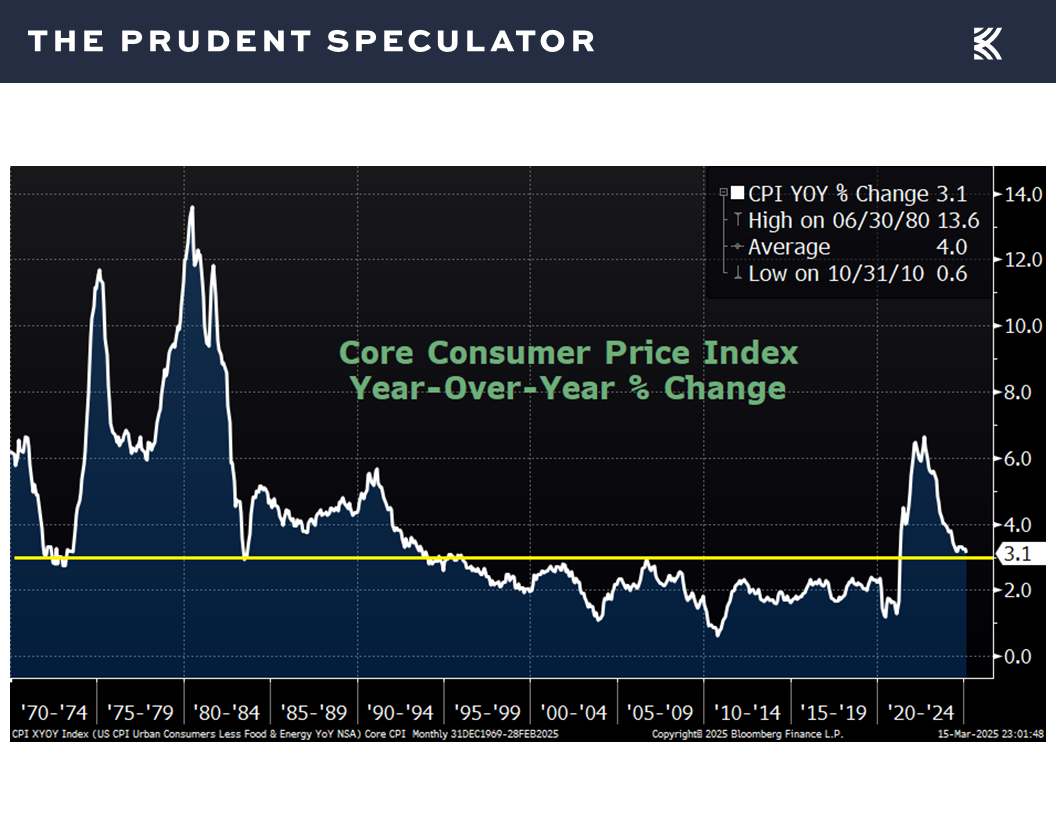
the rise of 3.1% in the so-called Core CPI (excludes volatile food and energy prices).
and the 3.2% year-over-year advance in the Producer Price Index (PPI) were all lower than forecast.
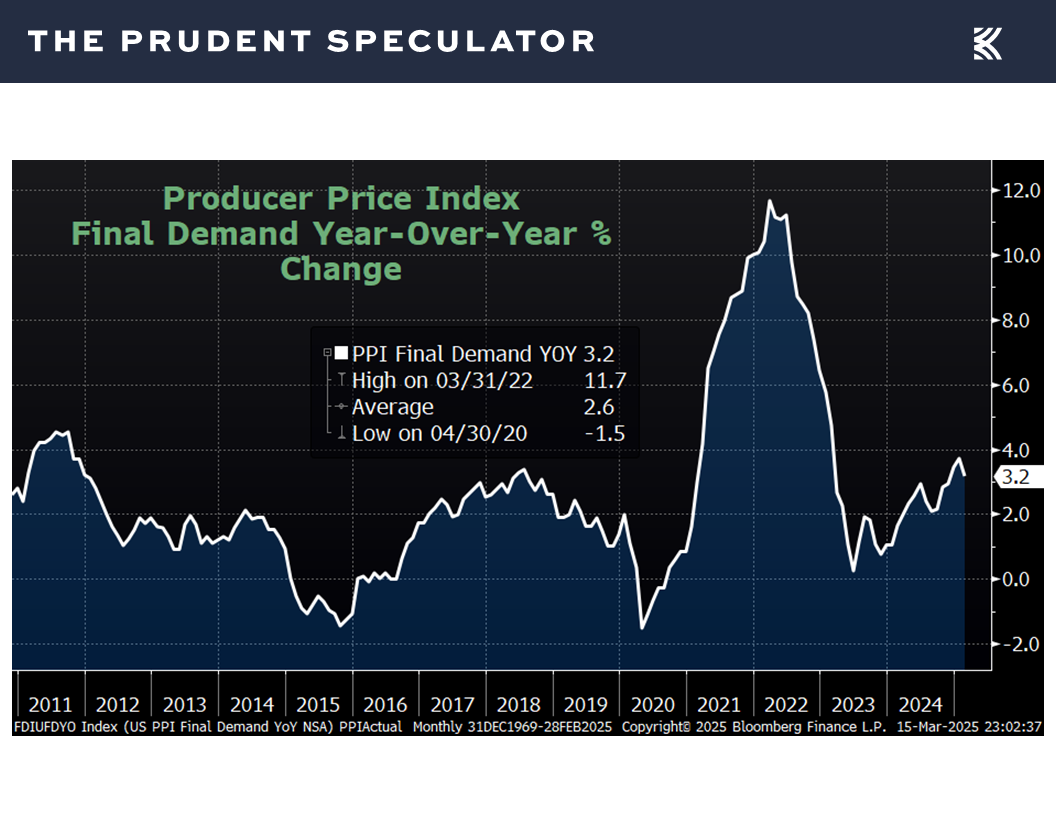
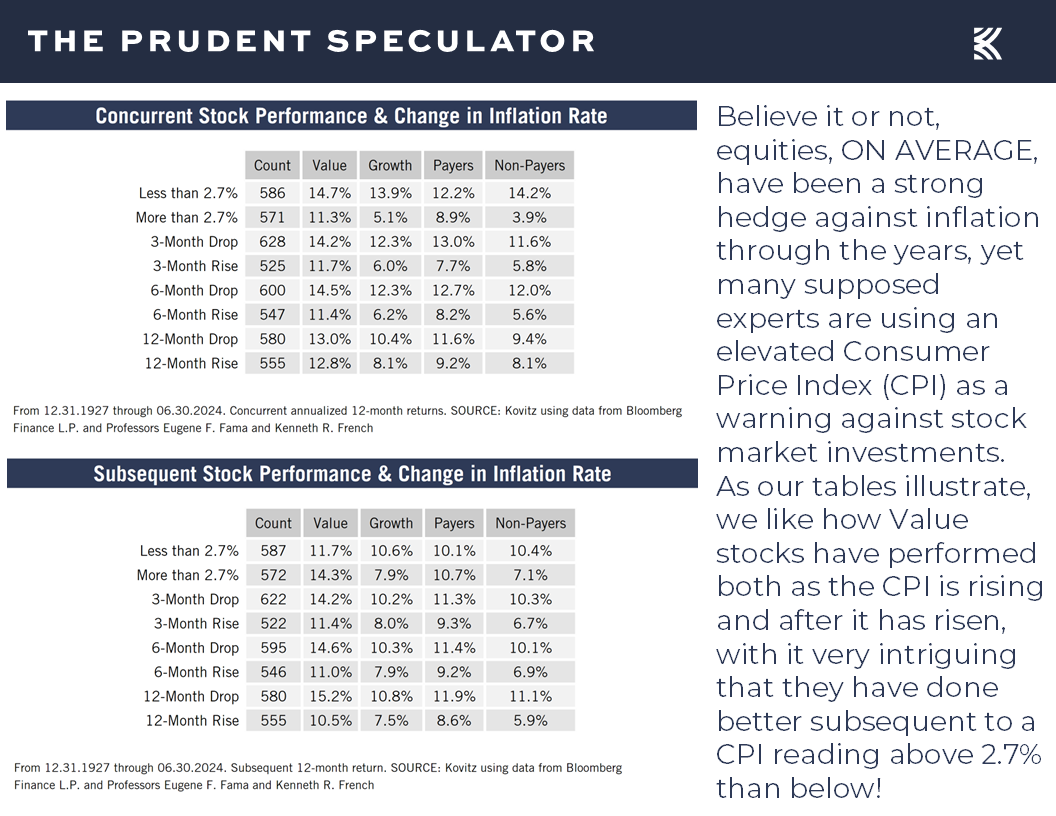
Meanwhile, decades of market history show that equities have been a terrific hedge against rising inflation…and falling inflation, for that matter.
Yes, some are questioning how aggressive the Federal Reserve can be in additional cuts in the Federal Funds rate, but the Fed Funds futures market is currently betting on at least two 25-basis-point reductions this year,
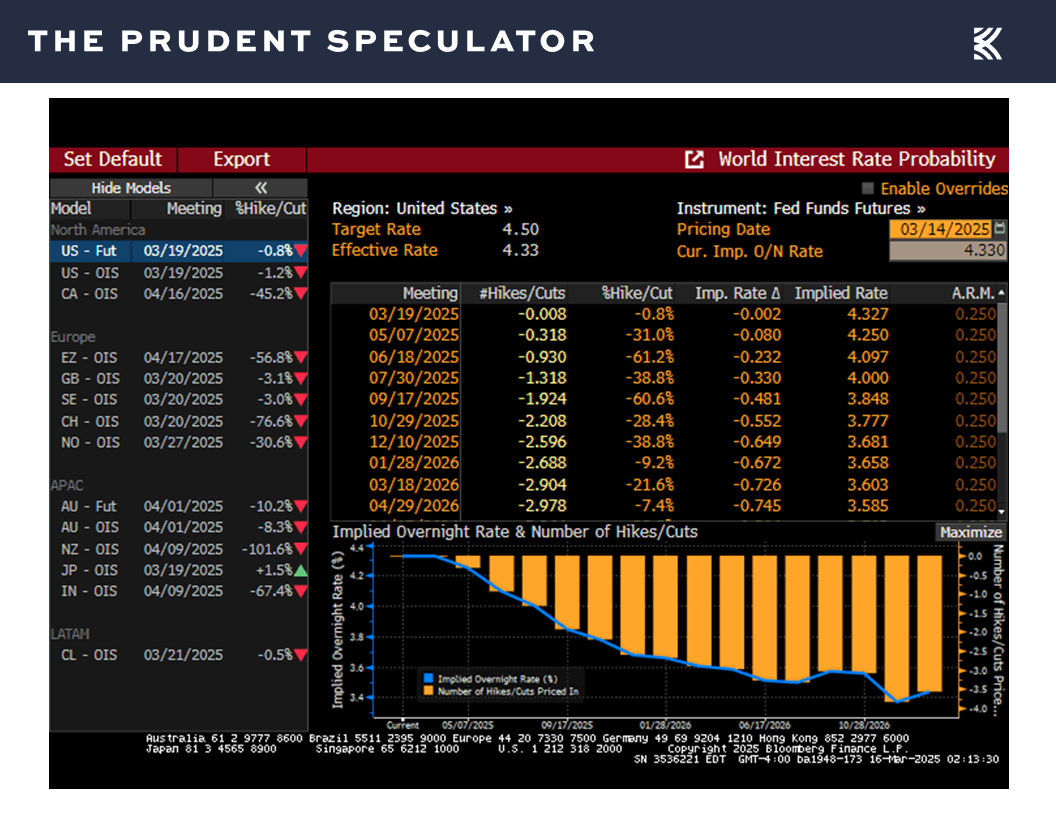
even as the historical evidence suggests stocks have performed well, no matter the short-term direction of the central bank’s key lending rate.

Perspective – In the Fullness of Time, Stocks Have Overcome Tariffs, Government Shutdowns, Russian Events, Recessions, Inflation & Fed Actions
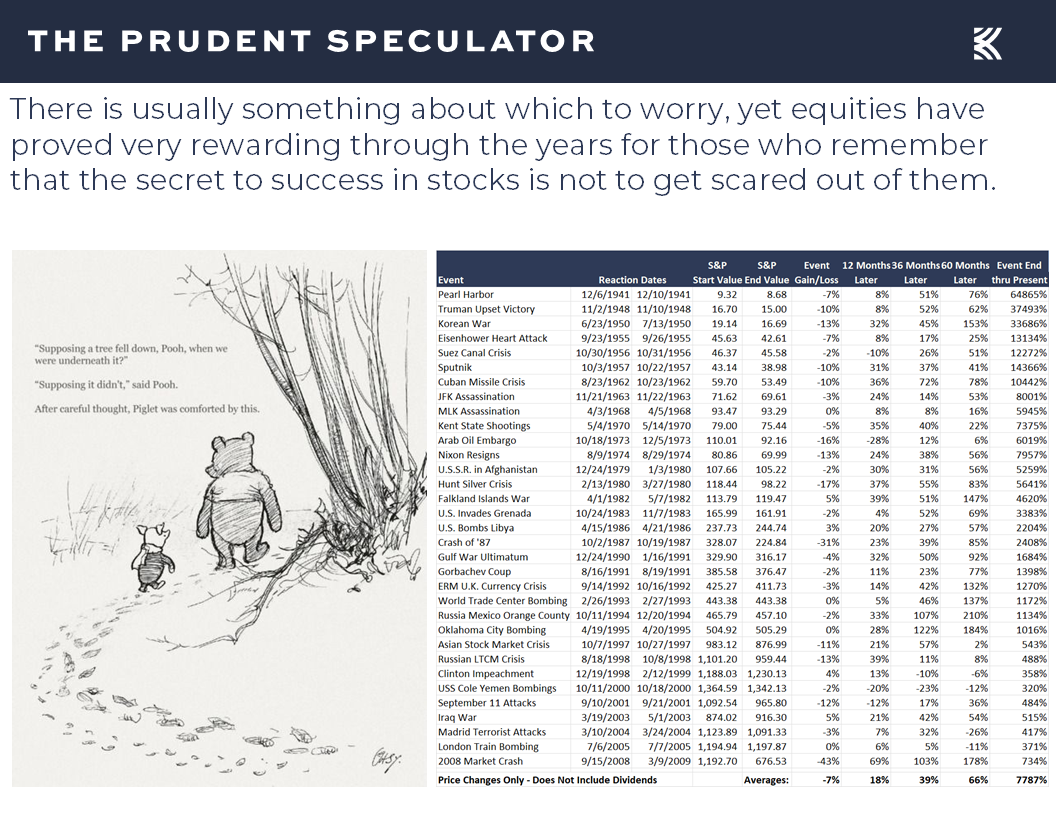
And we can’t forget that every prior scary period, including many that would have to be defined as more frightening than what we are going through today, has been overcome in the fullness of time, with stocks going on to post fantastic returns over the long haul.
Valuations – Liking the Metrics on our Portfolios
So, while we are always braced for additional downside volatility, and the equity futures are suggesting a poor open to trading in the new week, we continue to sleep well at night, given the inexpensive valuation metrics and generous dividend yields for our broadly diversified portfolios of undervalued stocks,
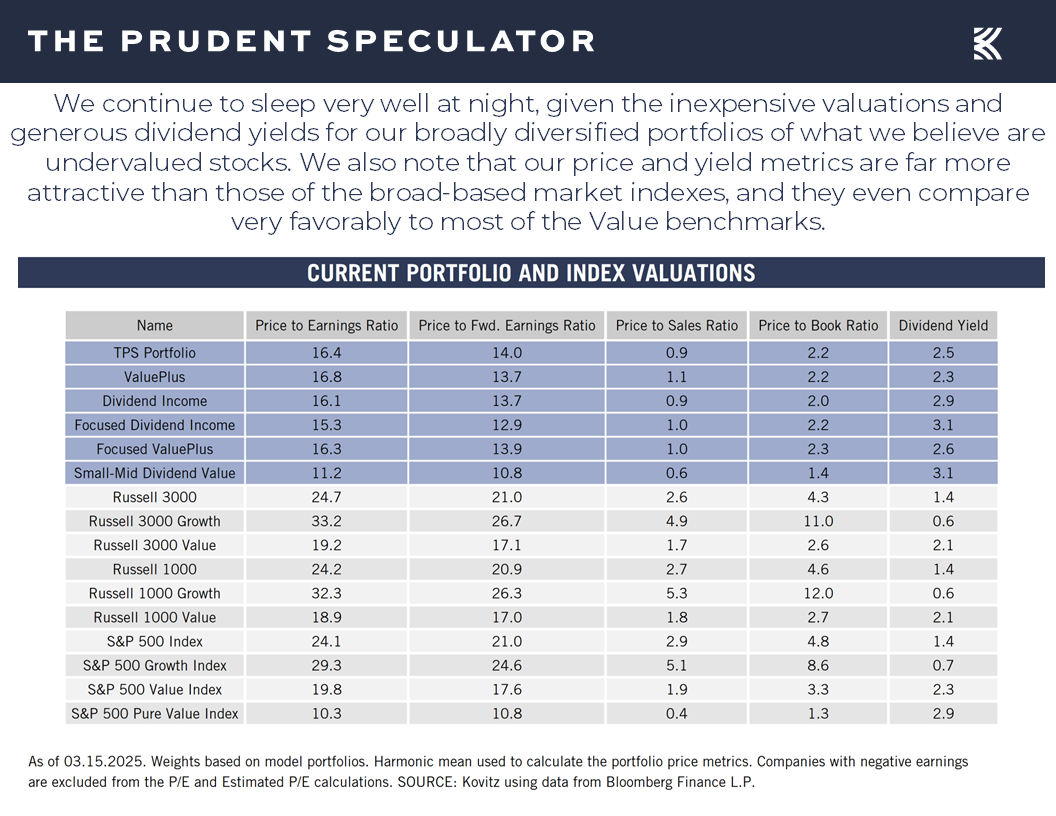
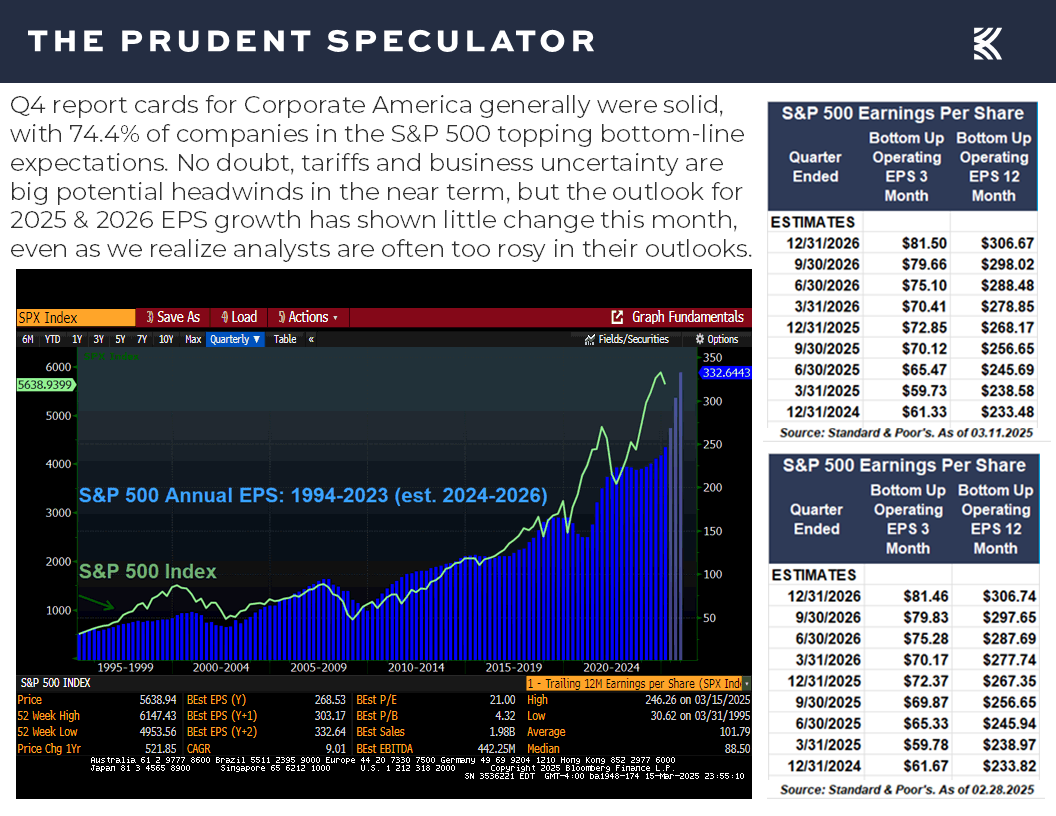
…while we note that analysts (we concede that they are often overly optimistic) are still expecting solid corporate earnings growth this year and next, even as we heard from airlines and retailers last week that the near-term outlook is murky.
Stock News – Updates on eight stocks five different sectors
Keeping in mind that all stocks are rated as a “Buy” until such time as they are a “Sell,” a listing of all current recommendations is available for download via the following link:
https://theprudentspeculator.com/dashboard/. We also offer the reminder that any sales we make for our newsletter strategies are announced via our
Sales Alerts. Jason Clark, Chris Quigley and Zack Tart take a look at earnings reports and other market-moving news of note out last week for more than a few of our recommendations.

Kovitz Investment Group Partners, LLC (“Kovitz”) is an investment adviser registered with the Securities and Exchange Commission. This report should only be considered as a tool in any investment decision and should not be used by itself to make investment decisions. Opinions expressed are only our current opinions or our opinions on the posting date. Any graphs, data, or information in this publication are considered reliably sourced, but no representation is made that it is accurate or complete and should not be relied upon as such. This information is subject to change without notice at any time, based on market and other conditions. Past performance is not indicative of future results, which may vary.
Volatility, AAII Sentiment, Historical Perspective and more
The Prudent Speculator Weekly Commentary is expertly curated every week as a valuable resource for stock market news, investing tips, business insights, and economic trends as it relates to value stock investing. In this week’s market commentary, we discuss Volatility, AAII Sentiment, Historic Perspective and more. We also include a short preview of our specific stock picks for the week, the entire list is available only to our community of loyal subscribers.
Executive Summary
Week – Big Rally on Friday, But 601st Worst Five-Day Period Ever; S&P Hits Correction Territory
Volatility – Stocks Go Up and Down in the Short Term, But Have Provided Handsome Rewards in the Long-Term
Sentiment – Major AAII…and Univ. of Michigan Contrarian Buy Signal
Perspective – In the Fullness of Time, Stocks Have Overcome Tariffs, Government Shutdowns, Russian Events, Recessions, Inflation & Fed Actions
Valuations – Liking the Metrics on our Portfolios
Stock News – Updates on INTC, ORCL, VWAPY, DKS, AEO, VZ, ABT & ETN
Week – Big Rally on Friday, But 601st Worst Five-Day Period Ever; S&P Hits Correction Territory
While we will always believe that uncertainty is the friend of the buyer of long-term value, the equity market sailing was again very rough last week. Indeed, despite a big rally on Friday, stocks endured a second straight week of sizable losses, turning in the 601st worst weekly period since 1928.
Volatility – Stocks Go Up and Down in the Short Term, But Have Provided Handsome Rewards in the Long-Term
Of course, there have been 683 weeks over the last 96+ years with gains of even greater magnitude than the latest downturn and long-term returns have been terrific for those able to cope with the numerous bouts of downside volatility. Value Stocks and Dividend Payers have posted double-digit percentage average long-term returns, despite the markets suffering 5% setbacks 3 times per year, on average, 10% corrections every 11 months and even 20% Bear Markets every 3.4 years.
Time will tell if the current trip south extends further, but the S&P 500 pierced the 10% correction threshold on Thursday, marking the 39th decline of that level or greater since the launch of our newsletter 48 years ago this month. Happily, there have also been 39 advances of 10% or greater over the same nearly half century, with an average gain of 40.69% during those periods dwarfing the average drop during corrections of 17.83%.
Sentiment – Major AAII…and Univ. of Michigan Contrarian Buy Signal
No doubt, fear levels are running high, with the latest weekly Sentiment Survey from the American Association of Individual Investors (AAII) showing only 19.1% of those polled saying they were Bullish on the prospects for stocks over the next six months, versus 59.2% who said they were Bearish.
There are no guarantees that past is prologue, but such a lopsided level of pessimism warms our contrarian hearts, especially given the AAII one-month, three-month and six-month forward return numbers for equities in the chart below. It historically has paid handsomely in the long run to be greedy when others are fearful.
Certainly, we realize there is plenty about which to worry these days, starting with the on-again, off-again tariff uncertainty,
while we learned last week from the University of Michigan that Consumer Sentiment plunged this month to the lowest level since 2022, which, believe it or not, might be another contrarian buy signal, at least based on prior cyclical lows for the gauge.
To be sure, anything can happen as we move forward, and this (and every time) is different, but we keep ourselves on an even emotional keel by evaluating what has occurred previously when various events have occurred.
For example, some of the angst last week was due to concerns about a looming government shutdown, but Washington closing its doors has happened 20 times previously, and stocks have performed fine, on average during the closure and even better than usual 12 months, three years and five years later.
Vladimir Putin is also on the minds of investors, and it has been the same favorable performance story, on average, following major events on the Russia-U.S. timeline.
The odds of a U.S. recession, as tabulated by Bloomberg, have also risen of late,
…as there was a sizable dip in the most recent projection for real (inflation-adjusted) Q1 GDP growth from the Atlanta Fed,
but even if we could predict when an economic contraction started and ended, long-term investors would want to stay the course, lest they miss out on solid returns, on average, in the year prior and massive average gains in the year after a recession.
Of course, we might argue that other economic data out last week suggest the chance of recession is low, as both job openings rising to 7.74 million in January,
and first-time filings for unemployment benefits in the latest week inching down to 220,000 were both better than estimated.
Obviously, there was consternation about long-term inflation expectations in the Univ. of Michigan survey soaring to 3.9%, the highest in 32 years,
but the increase of 2.8% in the Consumer Price Index (CPI) for February,
the rise of 3.1% in the so-called Core CPI (excludes volatile food and energy prices).
and the 3.2% year-over-year advance in the Producer Price Index (PPI) were all lower than forecast.
Meanwhile, decades of market history show that equities have been a terrific hedge against rising inflation…and falling inflation, for that matter.
Yes, some are questioning how aggressive the Federal Reserve can be in additional cuts in the Federal Funds rate, but the Fed Funds futures market is currently betting on at least two 25-basis-point reductions this year,
even as the historical evidence suggests stocks have performed well, no matter the short-term direction of the central bank’s key lending rate.
Perspective – In the Fullness of Time, Stocks Have Overcome Tariffs, Government Shutdowns, Russian Events, Recessions, Inflation & Fed Actions
And we can’t forget that every prior scary period, including many that would have to be defined as more frightening than what we are going through today, has been overcome in the fullness of time, with stocks going on to post fantastic returns over the long haul.
Valuations – Liking the Metrics on our Portfolios
So, while we are always braced for additional downside volatility, and the equity futures are suggesting a poor open to trading in the new week, we continue to sleep well at night, given the inexpensive valuation metrics and generous dividend yields for our broadly diversified portfolios of undervalued stocks,
…while we note that analysts (we concede that they are often overly optimistic) are still expecting solid corporate earnings growth this year and next, even as we heard from airlines and retailers last week that the near-term outlook is murky.
Stock News – Updates on eight stocks five different sectors
About the Author
Phil Edwards
Explore
Popular Posts
Connect
Subscribe For Free Stock Picks
Get expert investing tips and market insights delivered straight to your inbox.