The Prudent Speculator Weekly Commentary is expertly curated every week as a valuable resource for stock market news, investing tips, business insights, and economic trends as it relates to value stock investing. In this week’s Market Commentary, we discuss Volatility, Tariffs, AAII Sentiment and more Stock News. We also include a short preview of our specific stock picks for the week, the entire list is available only to our community of loyal subscribers.
Executive Summary
Volatility – Corrections…and Even Bear Markets…are Part of the Investment Process
Emotional Roller Coaster – Jim Cramer is Exhibit A
Patience – Time is the Friend of the Long-Term Investor
Tariffs – Levies Throughout History; Stocks (on a Total Return Basis) Overcame the Great Depression & Smoot-Hawley Much Faster than Many Think
Recessions – Risk Has Spiked, But History Shows Staying the Course the Right Move Even if a Contraction Were to Occur
Sentiment – Headlines Super Negative at Market Bottoms; AAII and Univ. of Michigan Flashing Contrarian Buy Signals
Valuations – Liking the Metrics and Dividends for our Portfolios
Stock News – Updates on Eight Pharma Stocks and other Sectors
Volatility – Corrections…and Even Bear Markets…are Part of the Investment Process
We often state that investing is an emotional roller-coaster and the ride thus far in April has been about as wild as we’ve ever seen, with the opening week’s massive plunge in stocks,
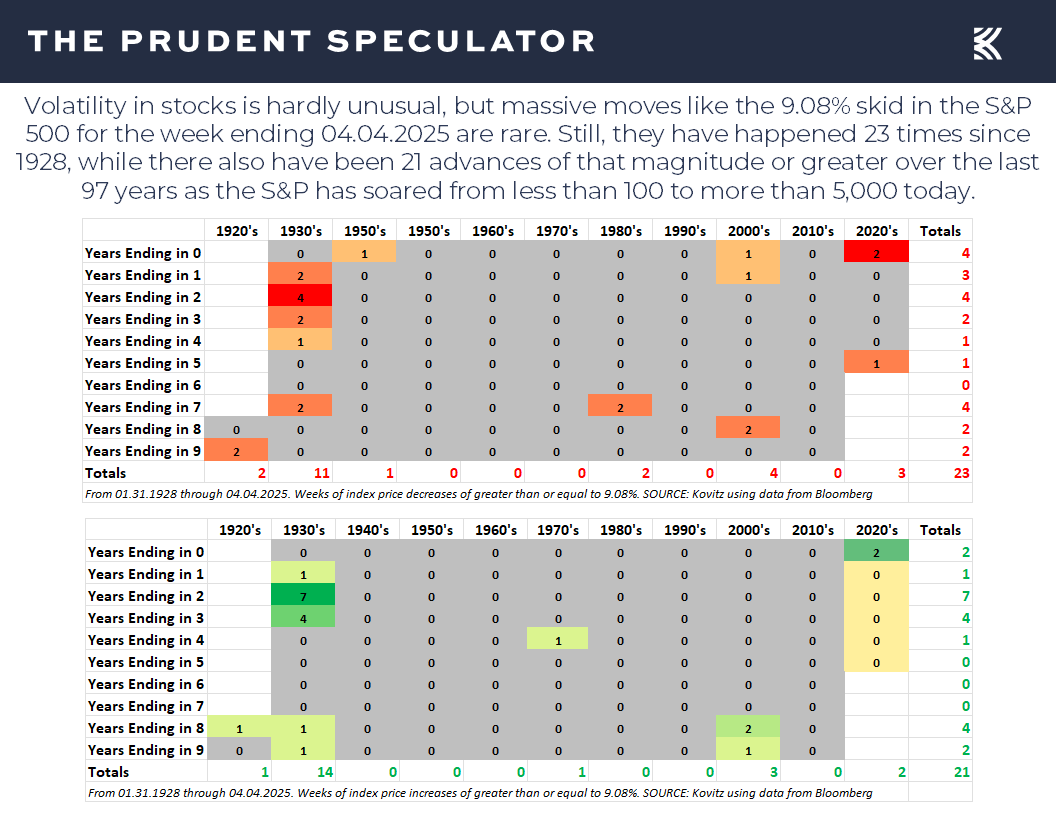
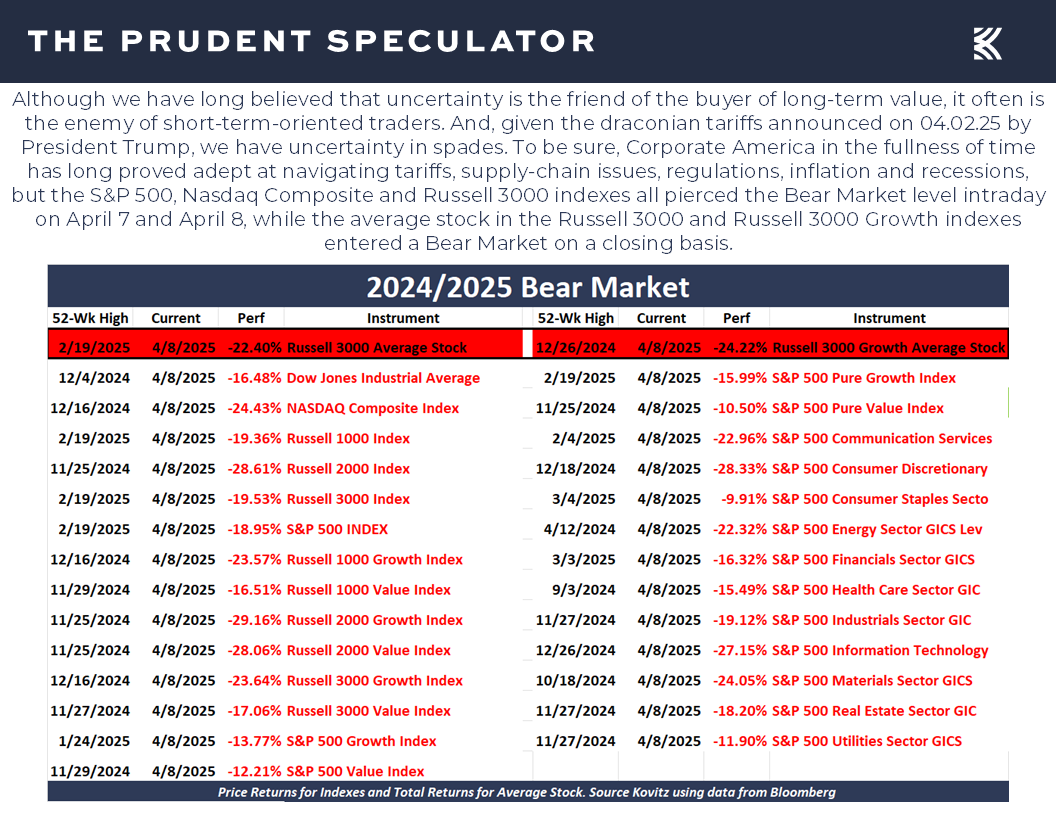
followed by more selling early in the latest week that briefly took the S&P 500 into Bear Market territory on an intraday basis on April 7 and again on April 8,
Emotional Roller Coaster – Jim Cramer is Exhibit A
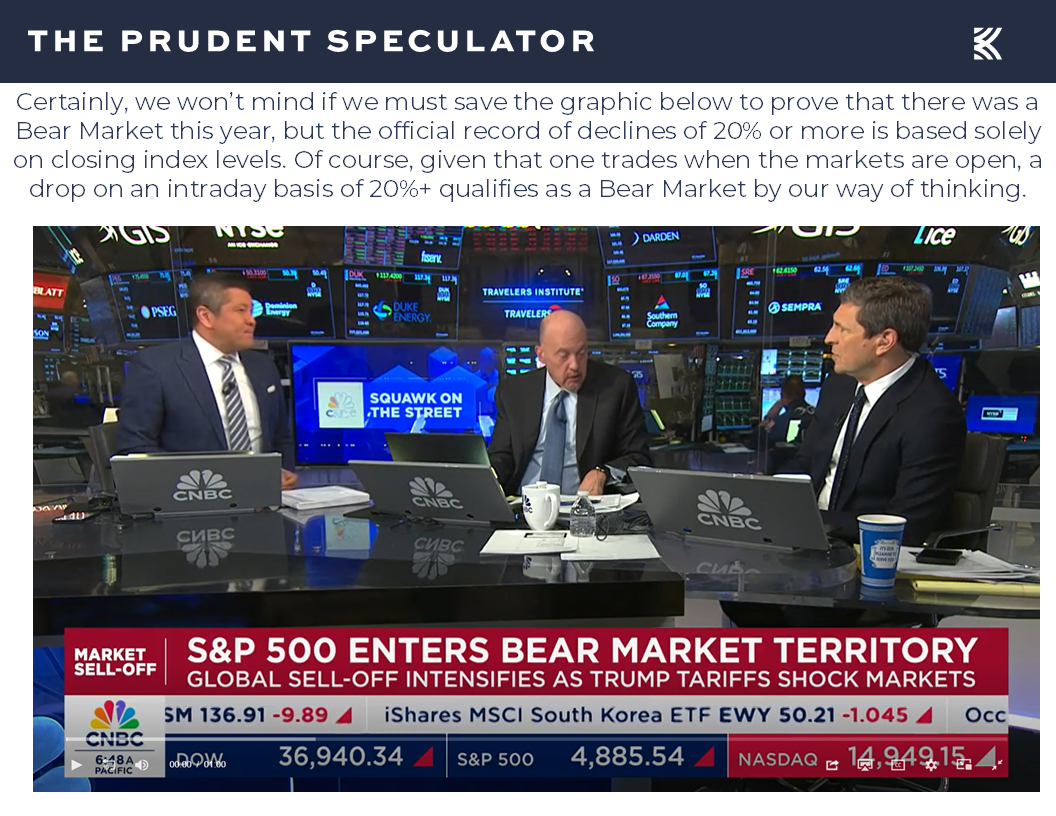
and sent the average stock and many market gauges to losses of more than 20% as of the close of trading on April 8, 2025.
To be sure, downside volatility has always been part of the investment equation, with downturns, pullbacks and selloffs taking place every year,
but we realize it isn’t easy for folks to navigate the intense gyrations. And that seemingly goes double for some Wall Street professionals, including one who has gone on to become a financial television celebrity by providing viewers over the last two decades with “the knowledge and tools that will empower you to be a better investor.”
Certainly, those of us who live in a glass house should not throw stones, but the Mad Money host has lately provided a vivid illustration of why many forget the Paul Samuelson admonition, “Investing should be more like watching paint dry or watching grass grow. If you want excitement, take $800 and go to Las Vegas.”
Anything is possible, of course, but Mr. Cramer a week ago was suggesting that following the back-to-back ugly skids of April 3 and April 4, a 1987-type Black Monday market crash was possible when trading resumed on Monday, April 7. He posted on X about 1987 on the evening of April 4, “We knew when to sell…and we were proud that we did,” even as “we were late to sell,” the week before Black Monday.
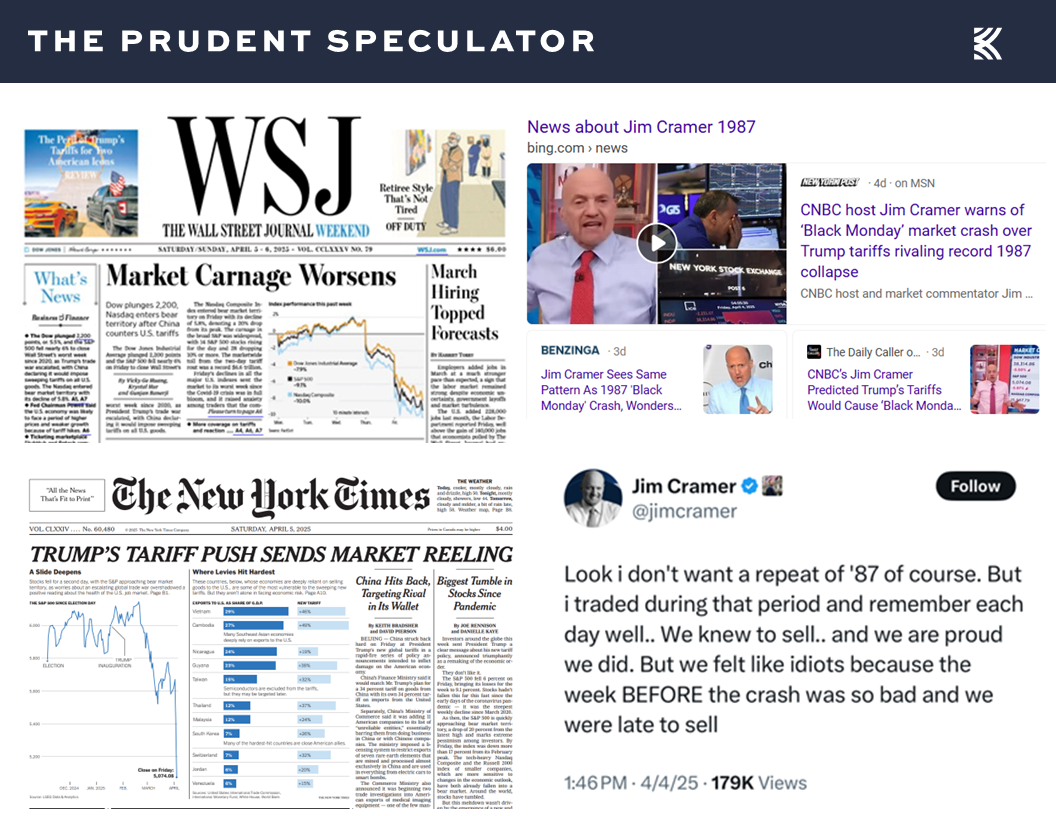
There is nothing wrong with having a cautious, albeit highly alarmist take, and selling early on the morning of October 19, 1987, would have proved beneficial in the short run, given that the Dow Jones Industrial Average closed at 1738 that day after plummeting more than 500 points, or 22.6%. However, given that the Dow ended 1987 at a reading of 1939, and stood at 2169 at the end of 1988 and at 2753 at the end of 1989, the latter above the 1987 peak, we think that time in the market trumps market timing, especially as your Editor had his baptism by fire, going through the ’87 Crash with our founder Al Frank.
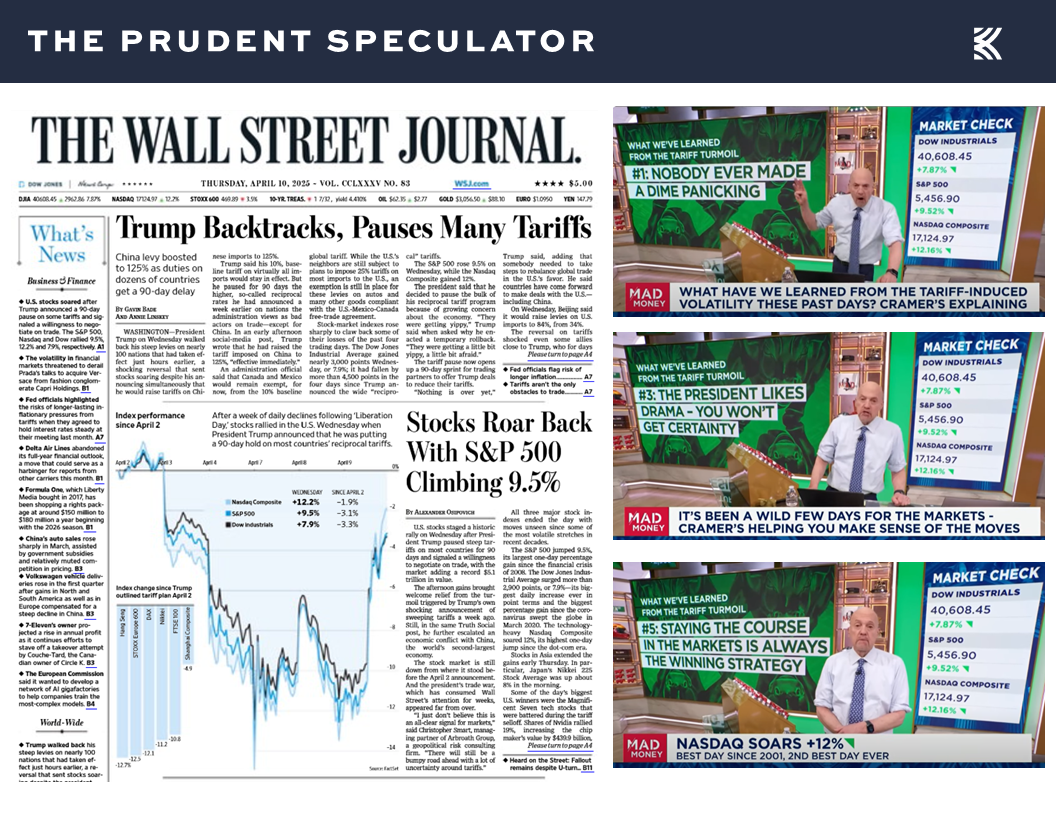
Believe it or not, Mr. Cramer evidently shares our optimistic view, given his reaction to the massive equity-market rebound on Wednesday, April 9, following the announcement of a 90-day pause in the tariffs. The near-3000 point rebound in the Dow (7.87%) was the 22nd best single-day advance in history dating back to 1928, with the giant rally prompting Mr. Cramer to joyously proclaim, “NOBODY EVER MADE A DIME PANICKING,” and “STAYING THE COURSE IN THE MARKETS IS ALWAYS THE WINNING STRATEGY.”
Patience – Time is the Friend of the Long-Term Investor
Certainly, Mr. Cramer is a lot more excitable than yours truly, and he is paid to attract eyeballs, but my faith in the long-term prospects of stocks and my firm belief that the only problem with market timing is getting the timing right, is based on 38 years of experience, not to mention the study of a century of market data.
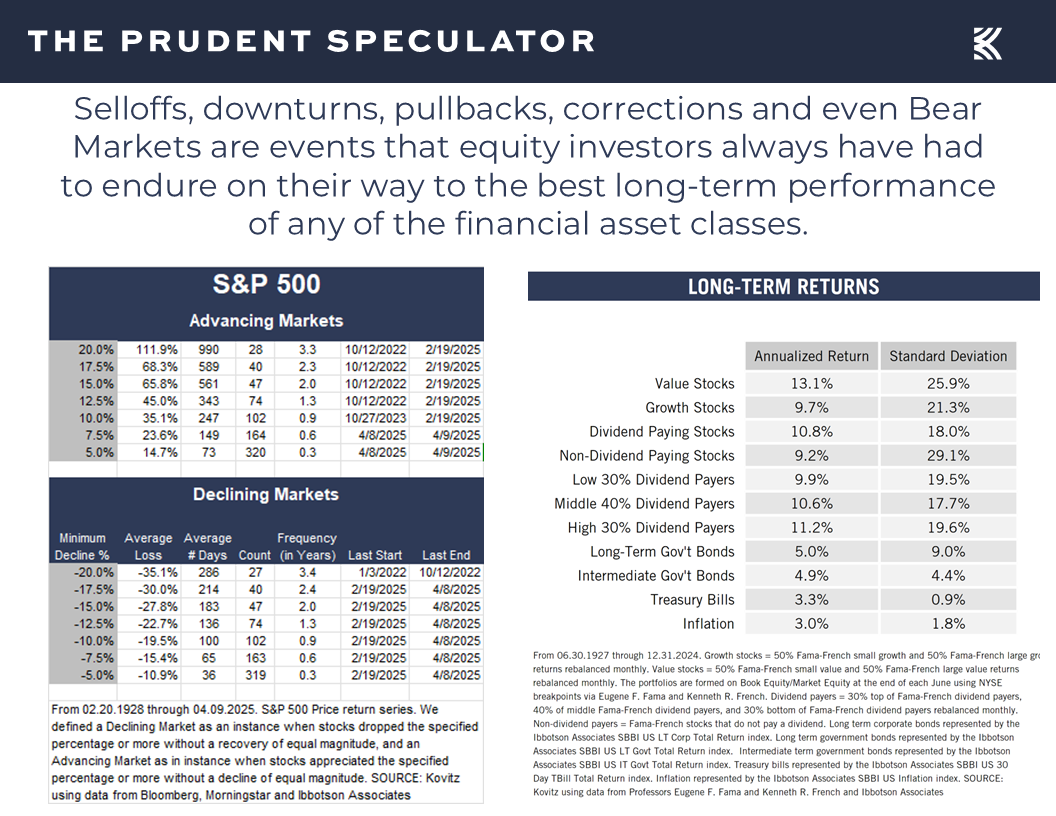
Equities have provided handsome long-term rewards with returns in the 9% to 13% range over the last 97+ years, despite many significant trips to the downside along the way.
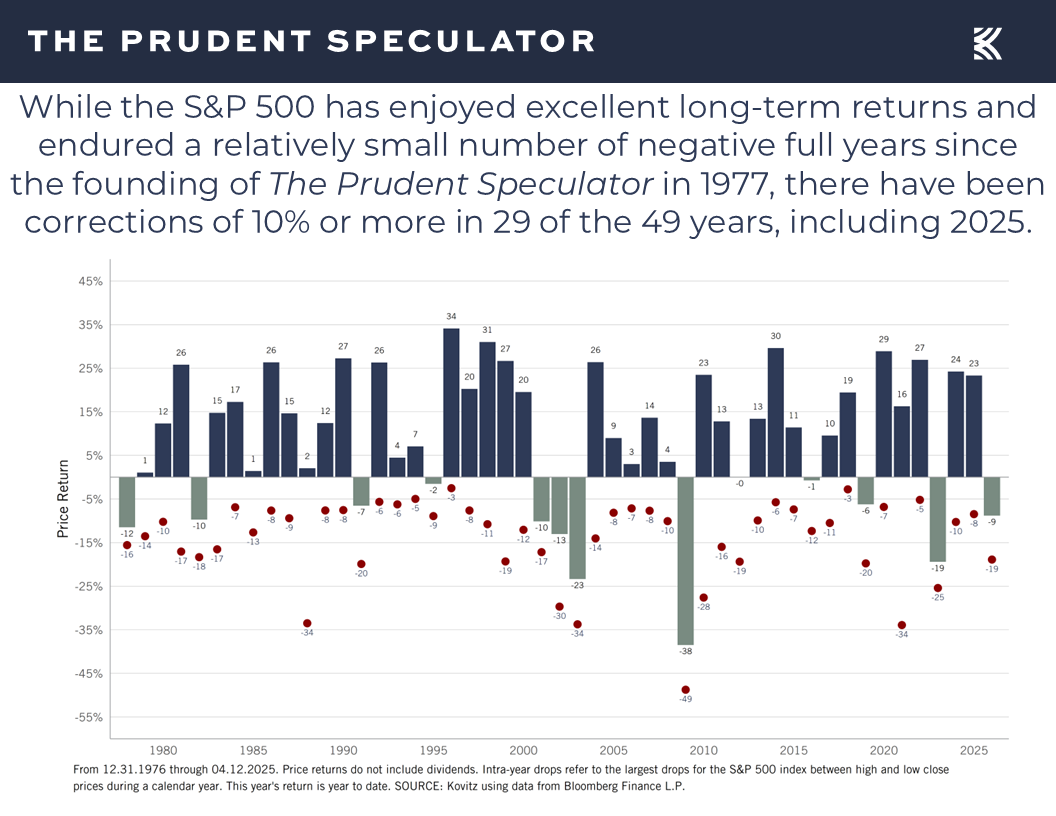
Indeed, though we came very close on Wednesday to exiting correction territory, we are now in the 39nd correction of 10% or more since the launch of The Prudent Speculator in 1977. We have not managed to avoid any of the times in the red…but we also haven’t missed any of the periods in the green,
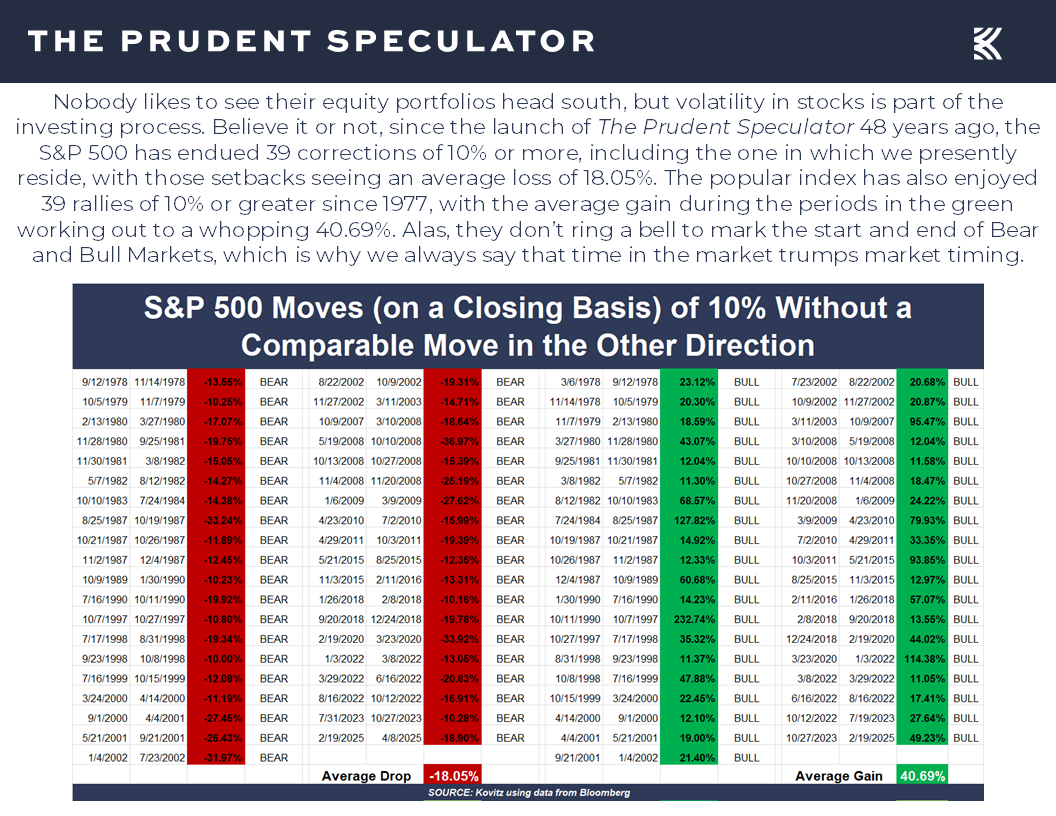
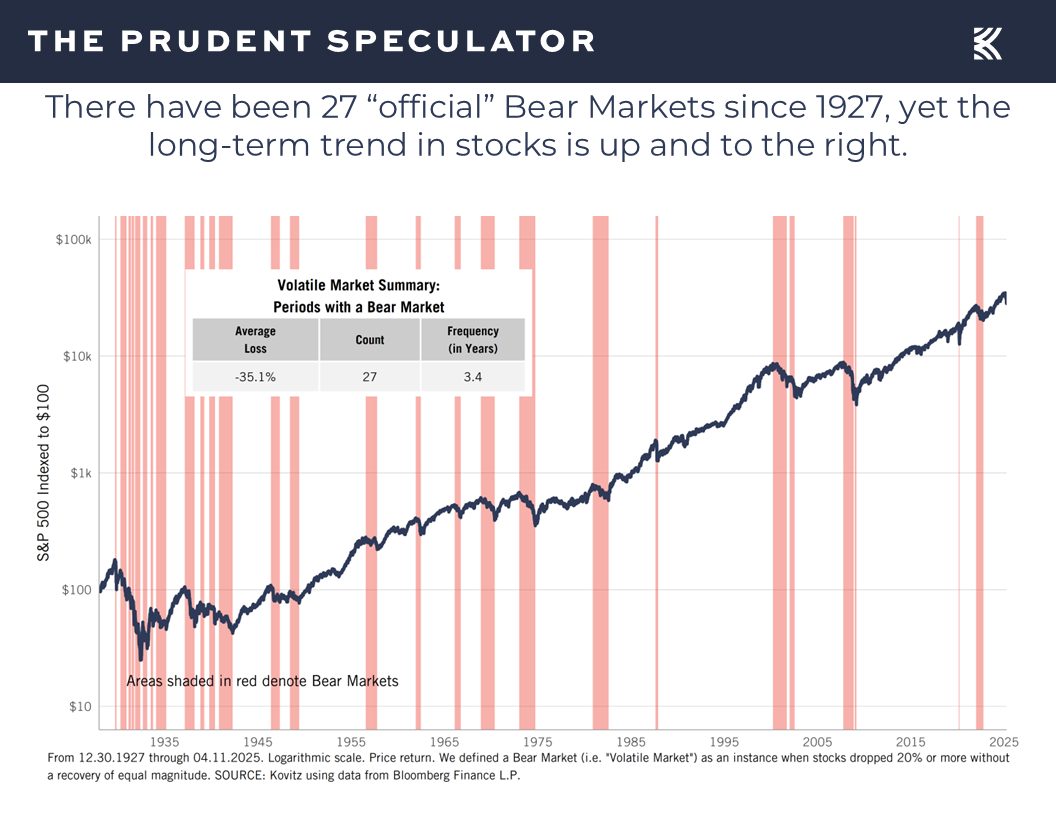
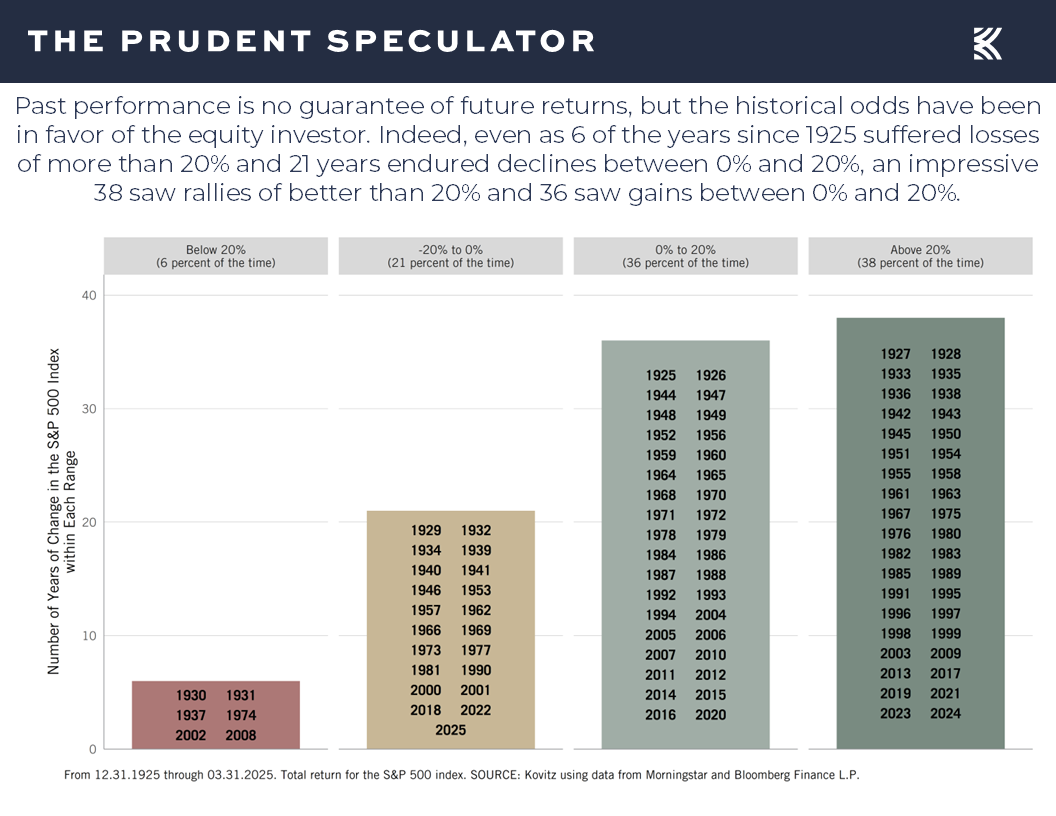
while a long-term chart of equity returns shows that even Bear Markets have been overcome in the fullness of time,
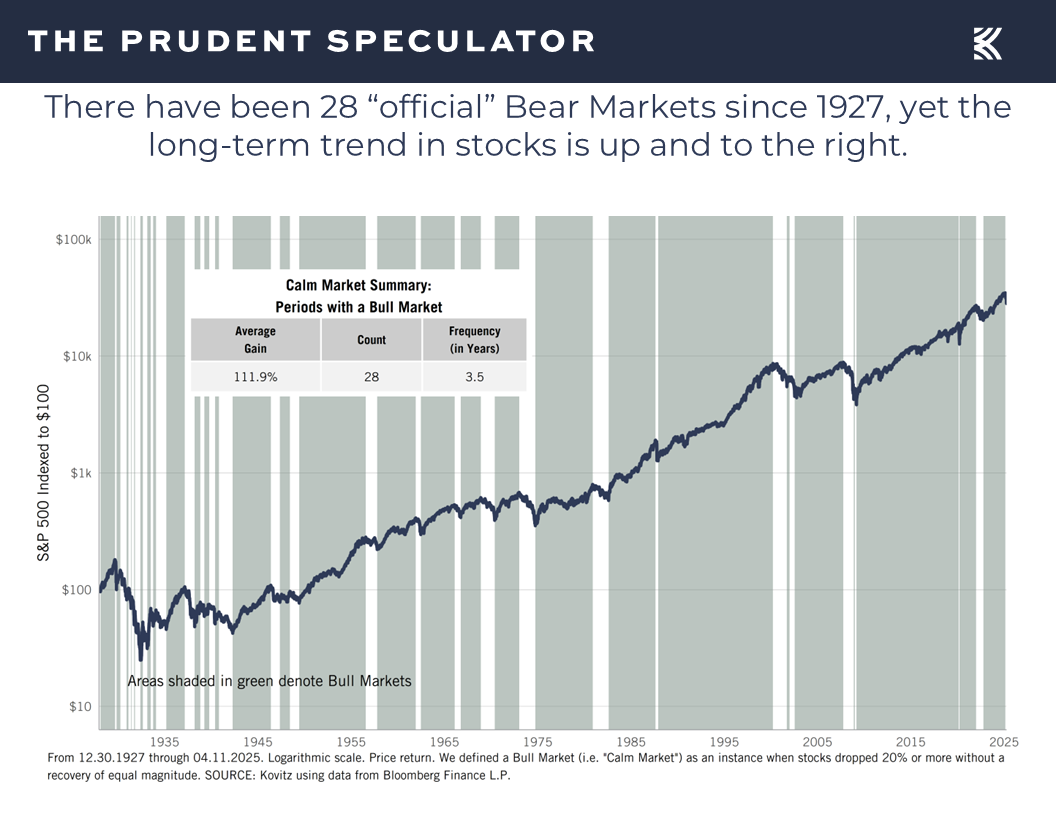
with far more time spent in Bull Markets over the years.
Certainly, we respect the argument that this time is different, but we are not convinced that the current Trade War, troubled geopolitical environment and polarized domestic political climate is more frightening than some of the other events on the long-term chart below,
while we know the odds have long been in favor of the patient, long-term-oriented equity investor. After all, looking at returns on calendar basis shows that the S&P 500 and its predecessor index have lost ground in 27 of the years since 1925, including this one, and gained ground in an impressive 74 of those years,
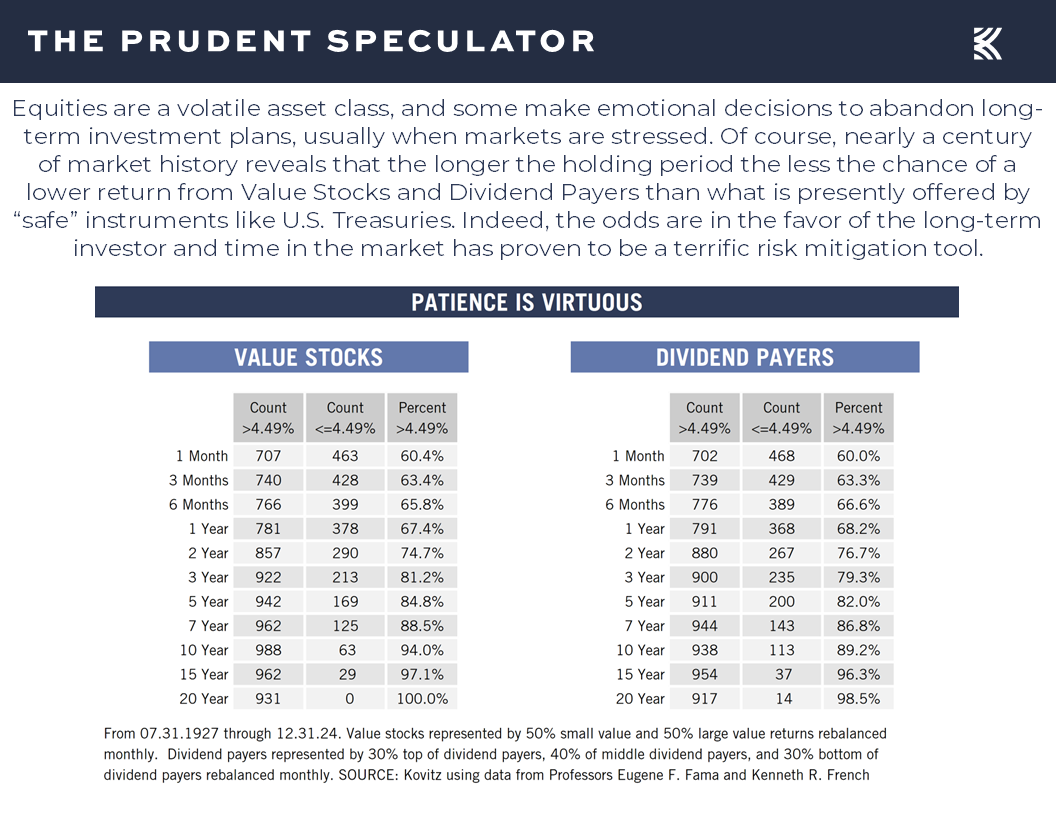
while the evidence shows that Value Stocks and Dividend Payers have had returns in excess of today’s annualized risk-free rate 60% of the time on a monthly basis, 67%+ of the time on a one-year basis and 82%+ on a five-year basis.
Tariffs – Levies Throughout History; Stocks (on a Total Return Basis) Overcame the Great Depression & Smoot-Hawley Much Faster than Many Think
No doubt, though the equity markets successfully managed through Trump 45’s Trade War, despite enduring a Bear Market (on an intraday basis) in 2018 and the COVID-19 Crash in 2020,
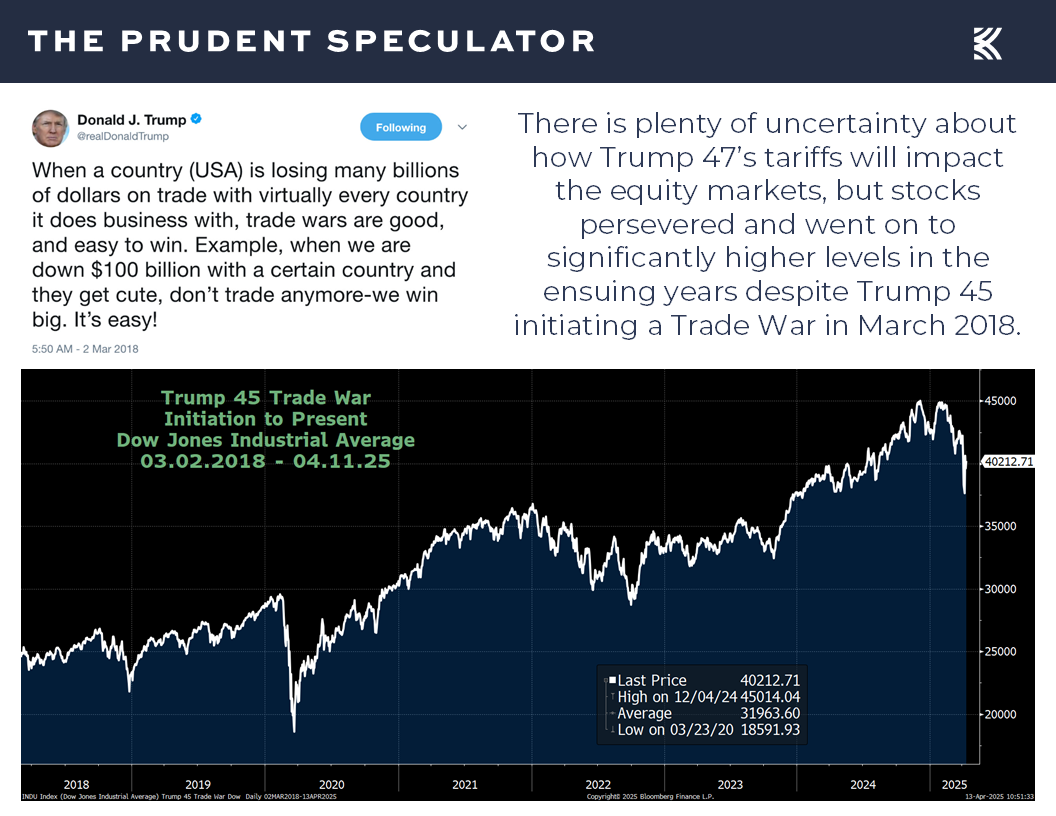
we understand that the initial level of tariffs proposed was on par with what was seen in the 1930s, prompting some pundits to argue a Great Depression II could be in the offing, even as levies have long been part of the trade landscape.

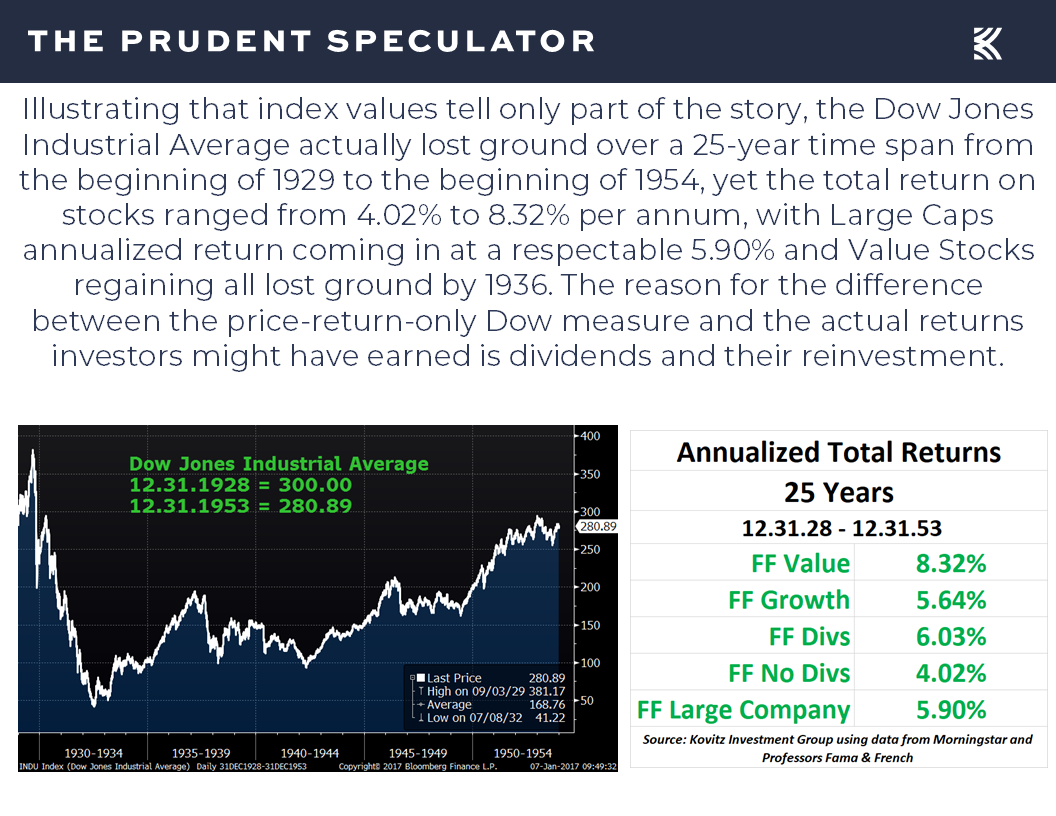
Of course, the Smoot-Hawley Tariff Act in the chart above was signed into law in June 1930, 8 months after the 1929 stock market crash, while poor banking practices exacerbated the malaise. Still, we suspect some will point to a chart of the Dow Jones Industrial Average from 1928 to 1953 to warn against sticking with stocks. True, the index went nowhere for 25 years, but this ignores the fact that on a total return basis, Value stocks gained 8.32%…per year…during that supposedly abysmal time period…and the losses of the Crash were fully recovered, again on a total return basis, by 1936.
Obviously, we do not want a repeat of the Great Depression, and the avoidance of such an event was cited last week in President Trump’s decision to ratchet back reciprocal tariffs for 90 days on all but China and to subsequently grant exemptions, albeit temporary, for electronics over the weekend.
Still, the President does not seem overly concerned about a recession and the odds of an economic contraction have been on the rise, with Blackrock CEO Larry Fink stating on Friday, April 11, “I think we’re very close, if not in, a recession now. I think you’re going to see, across the board, just a slowdown until there’s more certainty. And we now have a 90-day pause on the reciprocal tariffs — that means longer, more elevated uncertainty.”
For his part JPMorgan Chase CEO Jamie Dimon said the same day, “The economy is facing considerable turbulence (including geopolitics), with the potential positives of tax reform and deregulation and the potential negatives of tariffs and ‘trade wars,’ ongoing sticky inflation, high fiscal deficits and still rather high asset prices and volatility.”
Goldman Sachs on April 6 raised its probability of a U.S. economic contraction in the next 12 months to 45%, up from 35%, as its economists cited policy uncertainty, foreign consumer boycotts and tighter financial conditions.
Goldman’s odds surged to 65% on the morning of April 9, but the investment bank quickly revised that estimate back down to 45% after President Trump shocked the market with the tariff pause, posting on Truth Social, “Based on the fact that more than 75 Countries have called Representatives of the United States, including the Departments of Commerce, Treasury, and the USTR, to negotiate a solution to the subjects being discussed relative to Trade, Trade Barriers, Tariffs, Currency Manipulation, and Non Monetary Tariffs, and that these Countries have not, at my strong suggestion, retaliated in any way, shape, or form against the United States, I have authorized a 90 day PAUSE, and a substantially lowered Reciprocal Tariff during this period, of 10%, also effective immediately.”
Clearly, economic forecasting is fraught with peril. However, given that the tariff battle is far from over and President Trump also amped the levies on China, the odds of recession remain elevated. As a result, we continue to expect a steady stream of headlines warning that a slowdown in economic activity will drag down corporate profits and, in turn, stock prices.
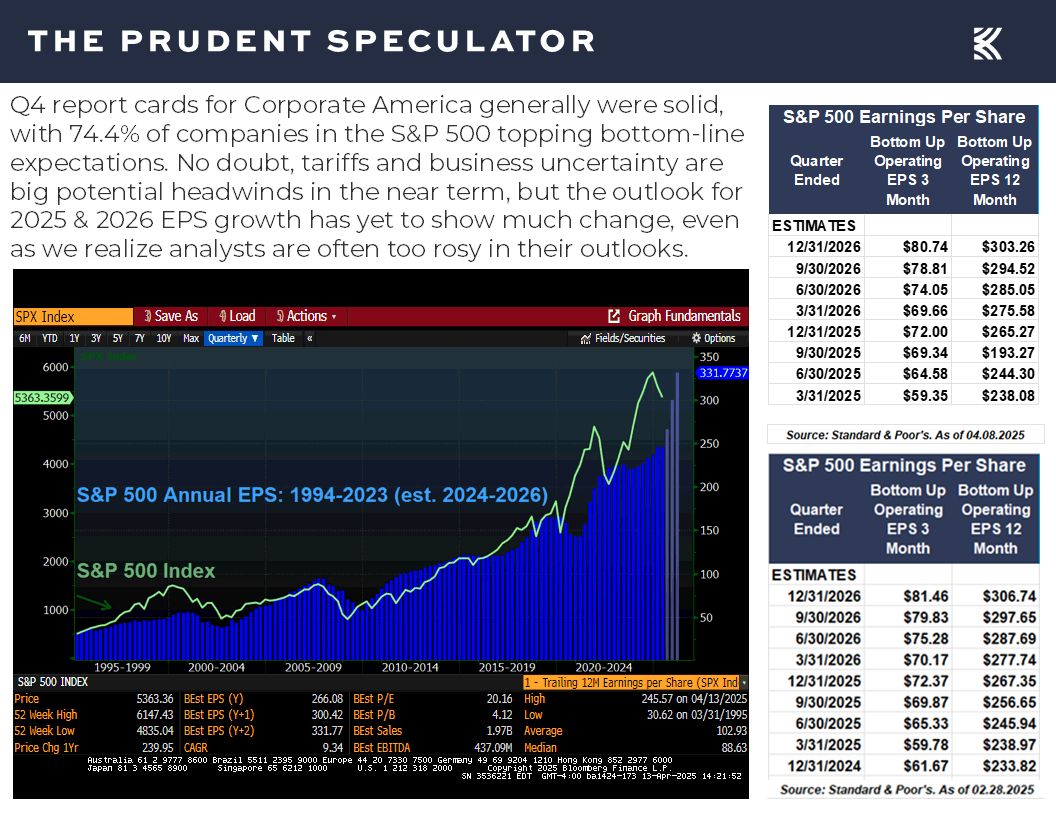
Though the current EPS estimates from Standard & Poor’s as of April 8, do not yet reflect a downturn in EPS,
Recessions – Risk Has Spiked, But History Shows Staying the Course the Right Move Even if a Contraction Were to Occur
it seems logical that an economic contraction could be in the cards, so we think it important to investigate what has happened when such an event has taken place in the past. There have “only” been 15 economic recessions in the United States since 1927, which is how far back freely available equity return data exists. While the 16th may be imminent, the start and end dates are never known in advance. And contrary to current media proclamations, stocks have suffered only modest pullbacks, on average, during contractions and decent gains, again on average, in the year leading up to them.
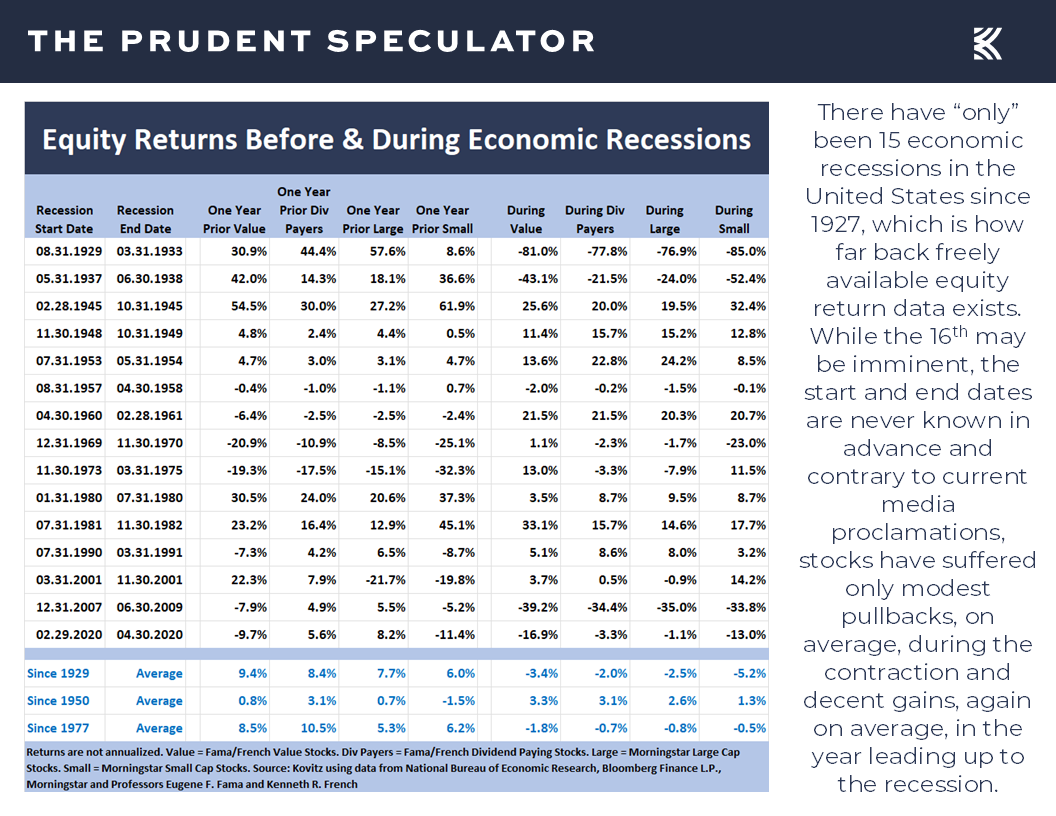
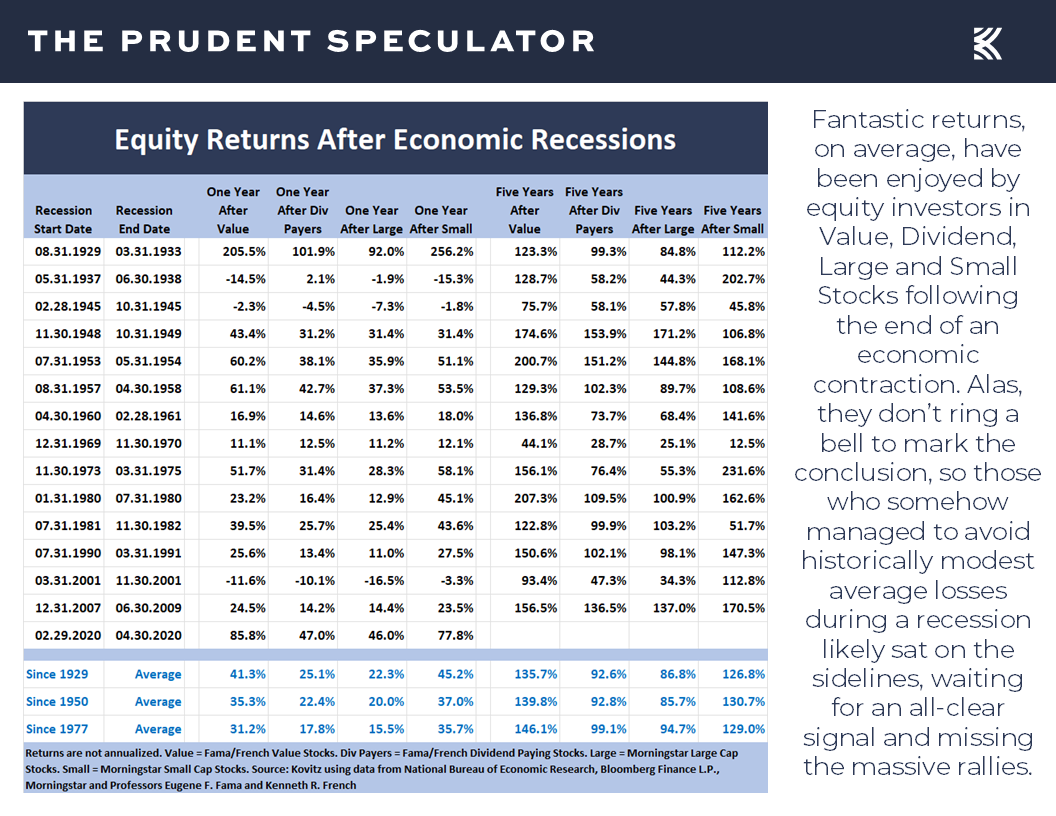
More importantly, investors in Value, Dividend, Large and Small Stocks have enjoyed fantastic average returns following the end of an economic contraction. Alas, they don’t ring a bell to mark the conclusion. As a result, those who somehow managed to avoid historically modest average losses during a recession likely sat on the sidelines waiting for an all-clear signal and missing a large part of the massive rallies.
Irrespective of the giant near-3000-point rebound in the Dow Jones Industrial Average on April 9, we continue to think trying to outguess the economy is hardly a recipe for success. Yes, it would be nice to be find a reliable indicator that tells an investor when to get in and out of stocks, but economists don’t even determine the beginning and ending dates for recessions until well after the fact.
While we crunch our own numbers to present our findings, there is nothing wrong with turning to others for corroboration of our conclusions. Russell Investments has done its own study of recessions and stocks going back further in time than our study.
They have found: “The 15 recessions with negative returns lasted 17 months on average, with an annualized cumulative return of -14.8% and average GDP decline of -4.6%. The Great Depression from August 1929 through March 1933, a duration of 43 months, had a total U.S. stock return of -73.6% and was the worst economic downturn on record.”
Of course, they have also learned: “There have been 16 recessions which had positive stock market returns—as measured from the start to the end of each recession. These positive-market recessions lasted on average 16 months, with stock returns ranging from 38.1% to 0.02%, with an annualized cumulative return of +9.8% and an average GDP decline of -2.7%.”
Now all we need to know is if the next recession will see stocks have negative or positive returns and we will be set, though if a contraction began at the start of this month as Mr. Fink suggested a week ago, we have already endured a significant chunk of the average decline suffered during those 15 negative return periods.
*****
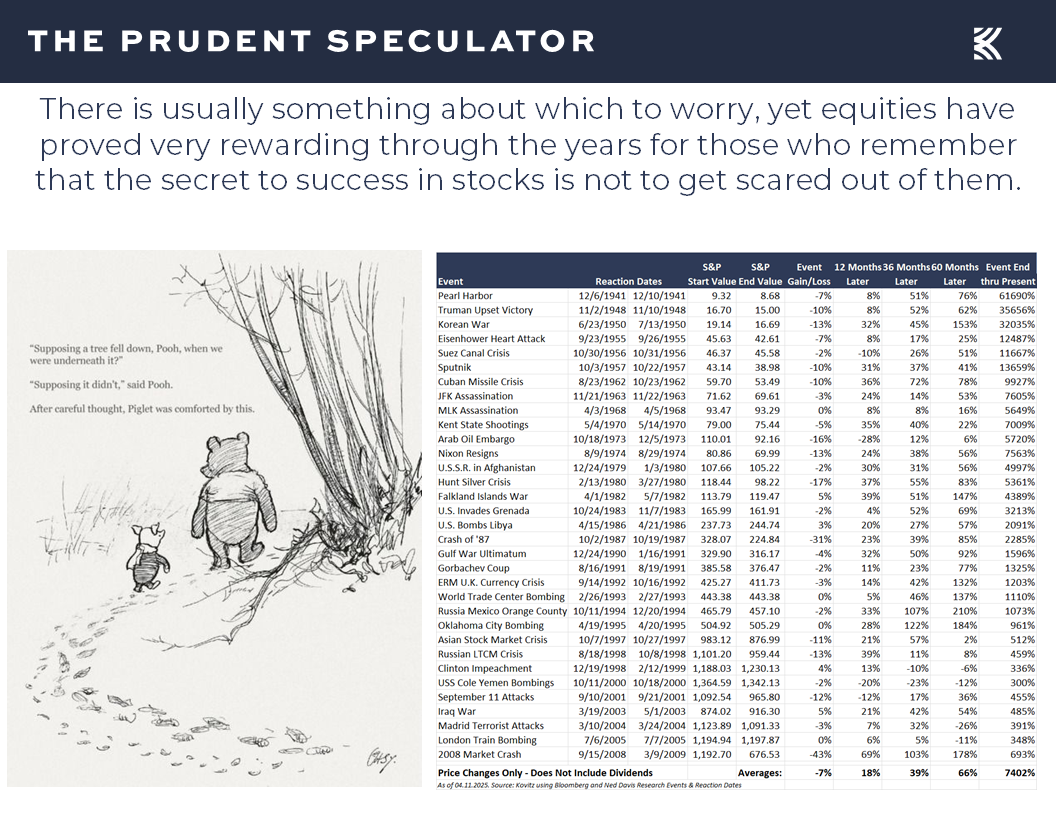
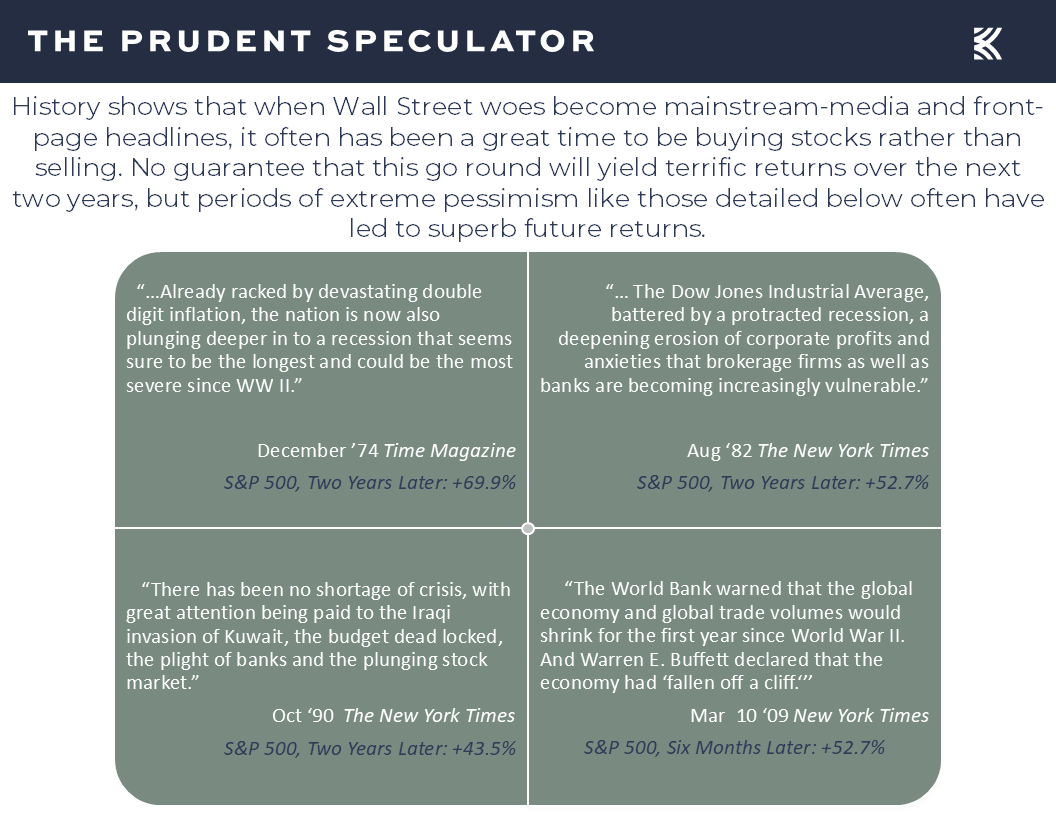
None of the above is meant to suggest that the bottom has bene put in or that the days and weeks ahead won’t be rocky, so we are braced for greater-than-usual volatility. Still, we offer the observation that if we went back in time to choose some of the best moments in history in which to invest, they would look a lot like what we are seeing today in terms of sensational headlines,
Sentiment – Headlines Super Negative at Market Bottoms; AAII and Univ. of Michigan Flashing Contrarian Buy Signals
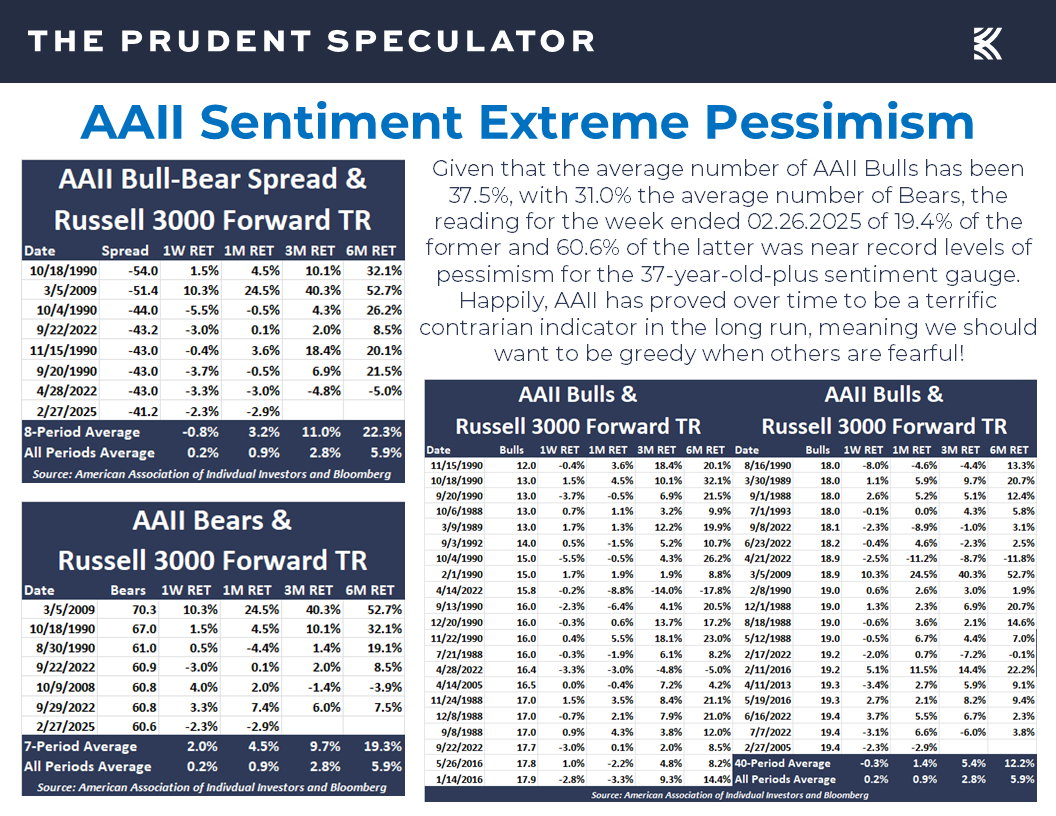
and pessimistic investor sentiment. As Warren Buffett states, “We should be greedy when others are fearful, and fearful when others are greedy,” so our contrarian nature also can’t help but be excited by the extremely Bearish readings of late on the weekly sentiment survey from the American Association of Individual Investors.
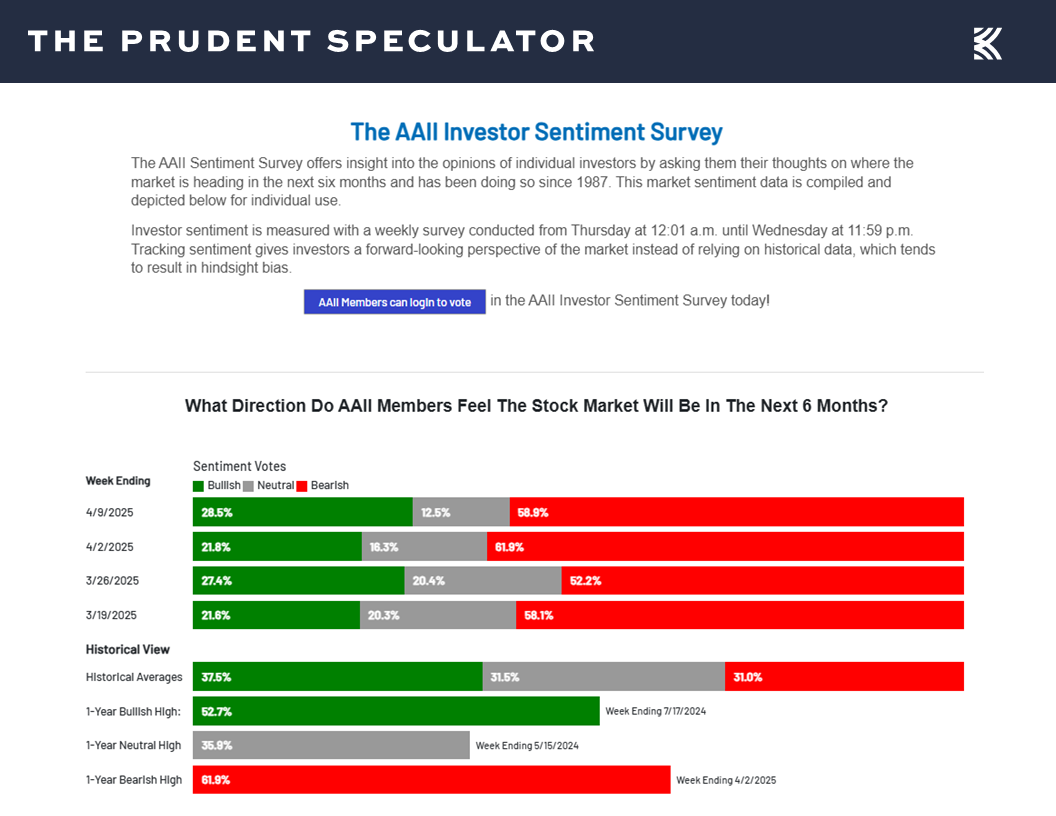
Since 1987, there have been only two other weekly tallies that were more Bearish than that of April 2, 2025. The first of these was on Oct. 18, 1990, during the first Gulf War, and the second was Mar. 5, 2009, four days before stocks bottomed during the Great Financial Crisis. There are never any guarantees that history repeats, but the six-month forward returns for the broad-based Russell 3000 Index back then were 32.1% and 52.7%, respectively.
Incredibly, folks seem more scared today than they were during the Great Financial Crisis, not to mention the COVID-19 pandemic,

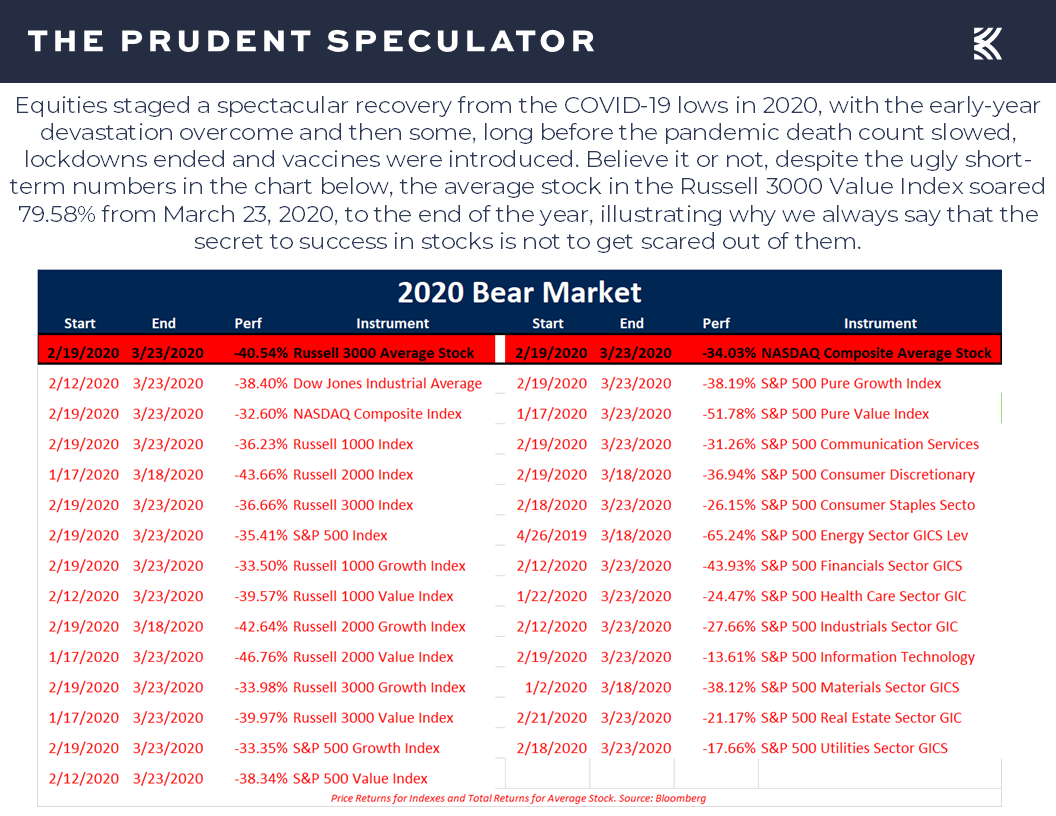
which was the last time stocks endured daily moves to the downside like we have been seeing of late. Let’s hope the short-term paper losses don’t approach those in 2020 that are detailed in the chart below, but those who kept the faith five years ago were rewarded with a full recovery by the end of that tumultuous year and significant appreciation in the years since, even accounting for the latest pullback.
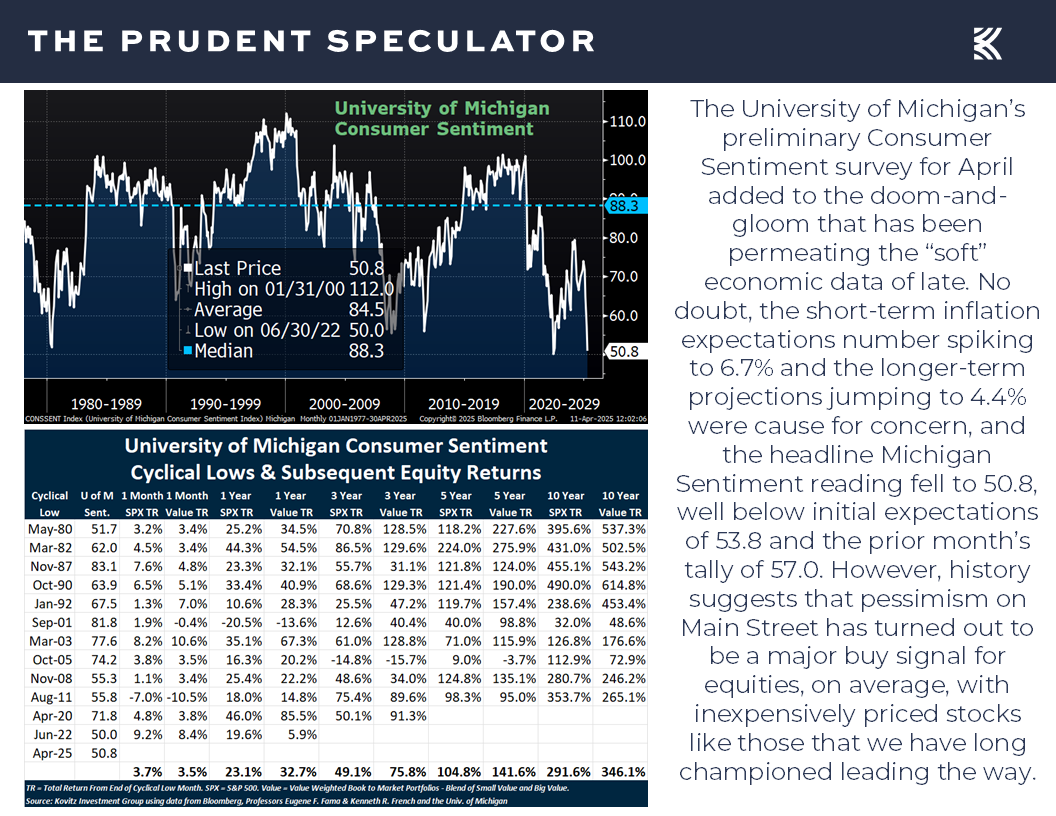
And for good measure on the contrarian front, Friday saw the Univ. of Michigan’s preliminary read on Consumer Sentiment for April drop to 50.8, well below expectations and the lowest level since 2022. That doesn’t sound like it would be encouraging, but previous cyclical lows on this gauge have led to excellent forward equity returns, on average.
Valuations – Liking the Metrics and Dividends for our Portfolios
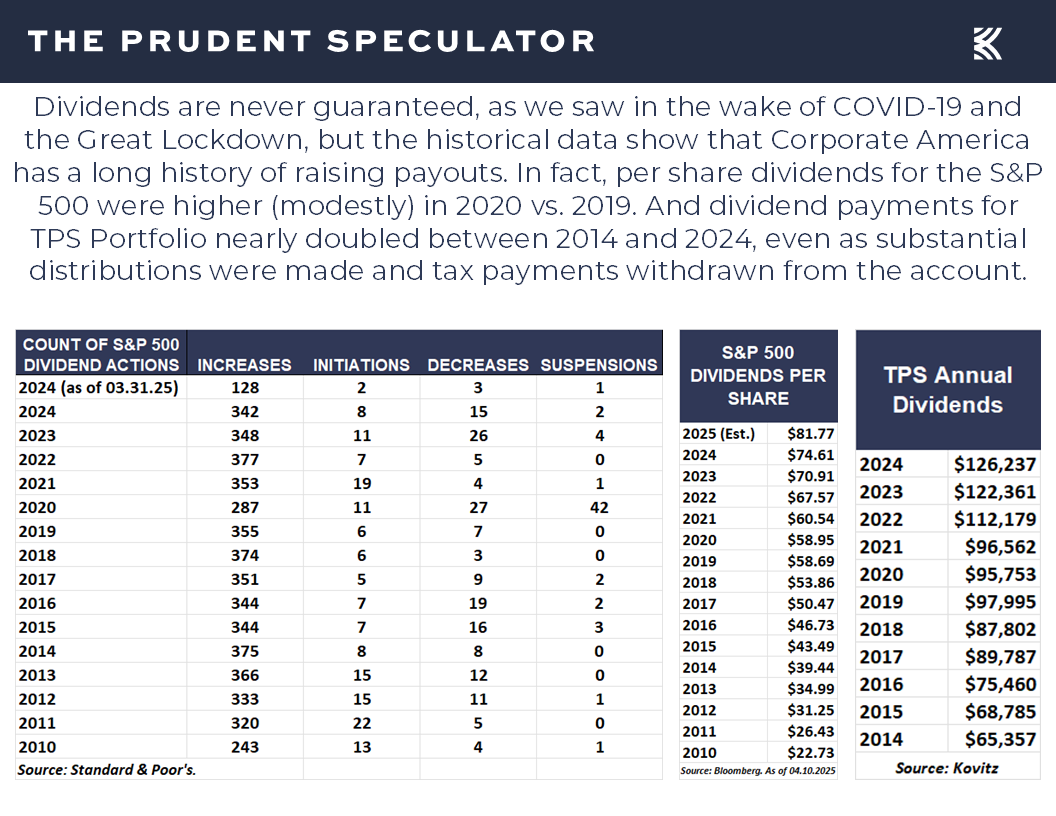
Come what may, we remain comfortable with the inexpensive valuation metrics and generous dividend yields on our broadly diversified portfolios of what we believe are undervalued stocks,
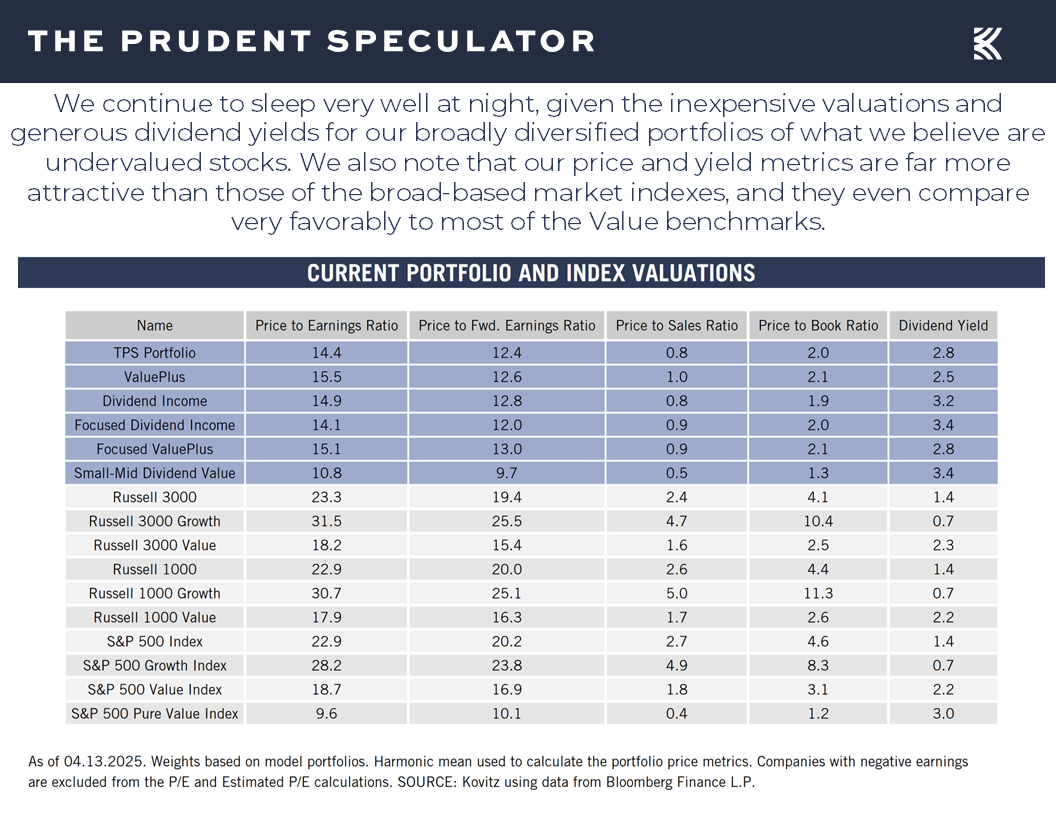
especially as the income streams provided to us generally have risen over time.
Stock News – Updates on Eight Pharma Stocks and other Sectors
Keeping in mind that all stocks are rated as a “Buy” until such time as they are a “Sell,” a listing of all current recommendations is available for download via the following link:
https://theprudentspeculator.com/dashboard/. We also offer the reminder that any sales we make for our newsletter strategies are announced via our
Sales Alerts. Jason Clark, Chris Quigley and Zack Tart take a look at earnings reports and other market-moving news of note out last week for more than a few of our recommendations.

Kovitz Investment Group Partners, LLC (“Kovitz”) is an investment adviser registered with the Securities and Exchange Commission. This report should only be considered as a tool in any investment decision and should not be used by itself to make investment decisions. Opinions expressed are only our current opinions or our opinions on the posting date. Any graphs, data, or information in this publication are considered reliably sourced, but no representation is made that it is accurate or complete and should not be relied upon as such. This information is subject to change without notice at any time, based on market and other conditions. Past performance is not indicative of future results, which may vary.
Volatility, Tariffs, AAII Sentiment and more Stock News
The Prudent Speculator Weekly Commentary is expertly curated every week as a valuable resource for stock market news, investing tips, business insights, and economic trends as it relates to value stock investing. In this week’s Market Commentary, we discuss Volatility, Tariffs, AAII Sentiment and more Stock News. We also include a short preview of our specific stock picks for the week, the entire list is available only to our community of loyal subscribers.
Executive Summary
Volatility – Corrections…and Even Bear Markets…are Part of the Investment Process
Emotional Roller Coaster – Jim Cramer is Exhibit A
Patience – Time is the Friend of the Long-Term Investor
Tariffs – Levies Throughout History; Stocks (on a Total Return Basis) Overcame the Great Depression & Smoot-Hawley Much Faster than Many Think
Recessions – Risk Has Spiked, But History Shows Staying the Course the Right Move Even if a Contraction Were to Occur
Sentiment – Headlines Super Negative at Market Bottoms; AAII and Univ. of Michigan Flashing Contrarian Buy Signals
Valuations – Liking the Metrics and Dividends for our Portfolios
Stock News – Updates on Eight Pharma Stocks and other Sectors
Volatility – Corrections…and Even Bear Markets…are Part of the Investment Process
We often state that investing is an emotional roller-coaster and the ride thus far in April has been about as wild as we’ve ever seen, with the opening week’s massive plunge in stocks,
followed by more selling early in the latest week that briefly took the S&P 500 into Bear Market territory on an intraday basis on April 7 and again on April 8,
Emotional Roller Coaster – Jim Cramer is Exhibit A
and sent the average stock and many market gauges to losses of more than 20% as of the close of trading on April 8, 2025.
To be sure, downside volatility has always been part of the investment equation, with downturns, pullbacks and selloffs taking place every year,
but we realize it isn’t easy for folks to navigate the intense gyrations. And that seemingly goes double for some Wall Street professionals, including one who has gone on to become a financial television celebrity by providing viewers over the last two decades with “the knowledge and tools that will empower you to be a better investor.”
Certainly, those of us who live in a glass house should not throw stones, but the Mad Money host has lately provided a vivid illustration of why many forget the Paul Samuelson admonition, “Investing should be more like watching paint dry or watching grass grow. If you want excitement, take $800 and go to Las Vegas.”
Anything is possible, of course, but Mr. Cramer a week ago was suggesting that following the back-to-back ugly skids of April 3 and April 4, a 1987-type Black Monday market crash was possible when trading resumed on Monday, April 7. He posted on X about 1987 on the evening of April 4, “We knew when to sell…and we were proud that we did,” even as “we were late to sell,” the week before Black Monday.
There is nothing wrong with having a cautious, albeit highly alarmist take, and selling early on the morning of October 19, 1987, would have proved beneficial in the short run, given that the Dow Jones Industrial Average closed at 1738 that day after plummeting more than 500 points, or 22.6%. However, given that the Dow ended 1987 at a reading of 1939, and stood at 2169 at the end of 1988 and at 2753 at the end of 1989, the latter above the 1987 peak, we think that time in the market trumps market timing, especially as your Editor had his baptism by fire, going through the ’87 Crash with our founder Al Frank.
Believe it or not, Mr. Cramer evidently shares our optimistic view, given his reaction to the massive equity-market rebound on Wednesday, April 9, following the announcement of a 90-day pause in the tariffs. The near-3000 point rebound in the Dow (7.87%) was the 22nd best single-day advance in history dating back to 1928, with the giant rally prompting Mr. Cramer to joyously proclaim, “NOBODY EVER MADE A DIME PANICKING,” and “STAYING THE COURSE IN THE MARKETS IS ALWAYS THE WINNING STRATEGY.”
Patience – Time is the Friend of the Long-Term Investor
Certainly, Mr. Cramer is a lot more excitable than yours truly, and he is paid to attract eyeballs, but my faith in the long-term prospects of stocks and my firm belief that the only problem with market timing is getting the timing right, is based on 38 years of experience, not to mention the study of a century of market data.
Equities have provided handsome long-term rewards with returns in the 9% to 13% range over the last 97+ years, despite many significant trips to the downside along the way.
Indeed, though we came very close on Wednesday to exiting correction territory, we are now in the 39nd correction of 10% or more since the launch of The Prudent Speculator in 1977. We have not managed to avoid any of the times in the red…but we also haven’t missed any of the periods in the green,
while a long-term chart of equity returns shows that even Bear Markets have been overcome in the fullness of time,
with far more time spent in Bull Markets over the years.
Certainly, we respect the argument that this time is different, but we are not convinced that the current Trade War, troubled geopolitical environment and polarized domestic political climate is more frightening than some of the other events on the long-term chart below,
while we know the odds have long been in favor of the patient, long-term-oriented equity investor. After all, looking at returns on calendar basis shows that the S&P 500 and its predecessor index have lost ground in 27 of the years since 1925, including this one, and gained ground in an impressive 74 of those years,
while the evidence shows that Value Stocks and Dividend Payers have had returns in excess of today’s annualized risk-free rate 60% of the time on a monthly basis, 67%+ of the time on a one-year basis and 82%+ on a five-year basis.
Tariffs – Levies Throughout History; Stocks (on a Total Return Basis) Overcame the Great Depression & Smoot-Hawley Much Faster than Many Think
No doubt, though the equity markets successfully managed through Trump 45’s Trade War, despite enduring a Bear Market (on an intraday basis) in 2018 and the COVID-19 Crash in 2020,
we understand that the initial level of tariffs proposed was on par with what was seen in the 1930s, prompting some pundits to argue a Great Depression II could be in the offing, even as levies have long been part of the trade landscape.
Of course, the Smoot-Hawley Tariff Act in the chart above was signed into law in June 1930, 8 months after the 1929 stock market crash, while poor banking practices exacerbated the malaise. Still, we suspect some will point to a chart of the Dow Jones Industrial Average from 1928 to 1953 to warn against sticking with stocks. True, the index went nowhere for 25 years, but this ignores the fact that on a total return basis, Value stocks gained 8.32%…per year…during that supposedly abysmal time period…and the losses of the Crash were fully recovered, again on a total return basis, by 1936.
Obviously, we do not want a repeat of the Great Depression, and the avoidance of such an event was cited last week in President Trump’s decision to ratchet back reciprocal tariffs for 90 days on all but China and to subsequently grant exemptions, albeit temporary, for electronics over the weekend.
Still, the President does not seem overly concerned about a recession and the odds of an economic contraction have been on the rise, with Blackrock CEO Larry Fink stating on Friday, April 11, “I think we’re very close, if not in, a recession now. I think you’re going to see, across the board, just a slowdown until there’s more certainty. And we now have a 90-day pause on the reciprocal tariffs — that means longer, more elevated uncertainty.”
For his part JPMorgan Chase CEO Jamie Dimon said the same day, “The economy is facing considerable turbulence (including geopolitics), with the potential positives of tax reform and deregulation and the potential negatives of tariffs and ‘trade wars,’ ongoing sticky inflation, high fiscal deficits and still rather high asset prices and volatility.”
Goldman Sachs on April 6 raised its probability of a U.S. economic contraction in the next 12 months to 45%, up from 35%, as its economists cited policy uncertainty, foreign consumer boycotts and tighter financial conditions.
Goldman’s odds surged to 65% on the morning of April 9, but the investment bank quickly revised that estimate back down to 45% after President Trump shocked the market with the tariff pause, posting on Truth Social, “Based on the fact that more than 75 Countries have called Representatives of the United States, including the Departments of Commerce, Treasury, and the USTR, to negotiate a solution to the subjects being discussed relative to Trade, Trade Barriers, Tariffs, Currency Manipulation, and Non Monetary Tariffs, and that these Countries have not, at my strong suggestion, retaliated in any way, shape, or form against the United States, I have authorized a 90 day PAUSE, and a substantially lowered Reciprocal Tariff during this period, of 10%, also effective immediately.”
Clearly, economic forecasting is fraught with peril. However, given that the tariff battle is far from over and President Trump also amped the levies on China, the odds of recession remain elevated. As a result, we continue to expect a steady stream of headlines warning that a slowdown in economic activity will drag down corporate profits and, in turn, stock prices.
Though the current EPS estimates from Standard & Poor’s as of April 8, do not yet reflect a downturn in EPS,
Recessions – Risk Has Spiked, But History Shows Staying the Course the Right Move Even if a Contraction Were to Occur
it seems logical that an economic contraction could be in the cards, so we think it important to investigate what has happened when such an event has taken place in the past. There have “only” been 15 economic recessions in the United States since 1927, which is how far back freely available equity return data exists. While the 16th may be imminent, the start and end dates are never known in advance. And contrary to current media proclamations, stocks have suffered only modest pullbacks, on average, during contractions and decent gains, again on average, in the year leading up to them.
More importantly, investors in Value, Dividend, Large and Small Stocks have enjoyed fantastic average returns following the end of an economic contraction. Alas, they don’t ring a bell to mark the conclusion. As a result, those who somehow managed to avoid historically modest average losses during a recession likely sat on the sidelines waiting for an all-clear signal and missing a large part of the massive rallies.
Irrespective of the giant near-3000-point rebound in the Dow Jones Industrial Average on April 9, we continue to think trying to outguess the economy is hardly a recipe for success. Yes, it would be nice to be find a reliable indicator that tells an investor when to get in and out of stocks, but economists don’t even determine the beginning and ending dates for recessions until well after the fact.
While we crunch our own numbers to present our findings, there is nothing wrong with turning to others for corroboration of our conclusions. Russell Investments has done its own study of recessions and stocks going back further in time than our study.
They have found: “The 15 recessions with negative returns lasted 17 months on average, with an annualized cumulative return of -14.8% and average GDP decline of -4.6%. The Great Depression from August 1929 through March 1933, a duration of 43 months, had a total U.S. stock return of -73.6% and was the worst economic downturn on record.”
Of course, they have also learned: “There have been 16 recessions which had positive stock market returns—as measured from the start to the end of each recession. These positive-market recessions lasted on average 16 months, with stock returns ranging from 38.1% to 0.02%, with an annualized cumulative return of +9.8% and an average GDP decline of -2.7%.”
Now all we need to know is if the next recession will see stocks have negative or positive returns and we will be set, though if a contraction began at the start of this month as Mr. Fink suggested a week ago, we have already endured a significant chunk of the average decline suffered during those 15 negative return periods.
*****
None of the above is meant to suggest that the bottom has bene put in or that the days and weeks ahead won’t be rocky, so we are braced for greater-than-usual volatility. Still, we offer the observation that if we went back in time to choose some of the best moments in history in which to invest, they would look a lot like what we are seeing today in terms of sensational headlines,
Sentiment – Headlines Super Negative at Market Bottoms; AAII and Univ. of Michigan Flashing Contrarian Buy Signals
and pessimistic investor sentiment. As Warren Buffett states, “We should be greedy when others are fearful, and fearful when others are greedy,” so our contrarian nature also can’t help but be excited by the extremely Bearish readings of late on the weekly sentiment survey from the American Association of Individual Investors.
Since 1987, there have been only two other weekly tallies that were more Bearish than that of April 2, 2025. The first of these was on Oct. 18, 1990, during the first Gulf War, and the second was Mar. 5, 2009, four days before stocks bottomed during the Great Financial Crisis. There are never any guarantees that history repeats, but the six-month forward returns for the broad-based Russell 3000 Index back then were 32.1% and 52.7%, respectively.
Incredibly, folks seem more scared today than they were during the Great Financial Crisis, not to mention the COVID-19 pandemic,
which was the last time stocks endured daily moves to the downside like we have been seeing of late. Let’s hope the short-term paper losses don’t approach those in 2020 that are detailed in the chart below, but those who kept the faith five years ago were rewarded with a full recovery by the end of that tumultuous year and significant appreciation in the years since, even accounting for the latest pullback.
And for good measure on the contrarian front, Friday saw the Univ. of Michigan’s preliminary read on Consumer Sentiment for April drop to 50.8, well below expectations and the lowest level since 2022. That doesn’t sound like it would be encouraging, but previous cyclical lows on this gauge have led to excellent forward equity returns, on average.
Valuations – Liking the Metrics and Dividends for our Portfolios
Come what may, we remain comfortable with the inexpensive valuation metrics and generous dividend yields on our broadly diversified portfolios of what we believe are undervalued stocks,
especially as the income streams provided to us generally have risen over time.
Stock News – Updates on Eight Pharma Stocks and other Sectors
About the Author
The Prudent Speculator
Explore
Popular Posts
Connect
Subscribe For Free Stock Picks
Get expert investing tips and market insights delivered straight to your inbox.