Every month, The Prudent Speculator produces a newsletter that includes a market summary, helpful charts and graphs, recent equity market news, economic outlook and specific stock investment strategies focused on value stock investing. In this month’s Newsletter, we discuss the equity market rebound, value stocks, federal reserve board, fed funds rate, equity returns, interest and inflation rates and more. We also include a preview of our current Recommended Stock List and Portfolio Builder section with ten highlighted stocks. Note that the entire list is available to our community of loyal subscribers only.

Editor’s Note: Equity Market Rebound, Value Stocks, Federal Reserve Board and more Economic News
“The future is never clear; you pay a very high price in the stock market for a cheery consensus.” — Warren Buffett
Given that it took a big rebound over the final week of the month to cut the average loss for stocks in the broad-based Russell 3000 index to 5.7% during March, we were again reminded that equity prices move in both directions. The long-term trend has been higher, of course, with Value Stocks like those that we have long favored enjoying average annualized returns of 13.2% since 1927, but ups and downs have always been part of the investment process.
In fact, history shows that Value Stocks have lost ground on a one-month basis 36.8% of the time, but that also means that 63.2% of months have been positive. Hold for 12 months and the chance of losing money drops to 26.9%, with red ink shrinking to 12.5% for three-year, 3.4% for seven-year and 0% for 15-year periods, so risk has been mitigated simply by lengthening one’s time horizon.
For example, the Russell 3000 Value index eked out a modest gain of less than 1% for the first quarter of 2023, with volatility appearing to be almost non-existent if utilizing a three-month measuring stick. Of course, those who pay attention to the short-term fluctuations know that the equity markets have had plenty of gyrations this year, with the drama really heating up on March 9 after an exodus of deposits via a modern-day electronic bank run at Silicon Valley Bank led to the lightening-quick collapse of that institution.
Next to fall were Signature Bank, which was had high levels of uninsured depositors and heavy exposure to crypto assets, and long-struggling Credit Suisse, which was forced by Swiss authorities into a shotgun marriage with rival UBS. Needless to say, central bankers around the world needed to work overtime to ensure that contagion did not spread to other banks.
In the U.S., the Federal Reserve Board announced on March 12 that it would offer additional funding to eligible depository institutions to assure banks have the ability to meet the needs of all their depositors, while Treasury Secretary Janet Yellen on March 16 orchestrated a $30 billion deposit infusion from 11 of America’s leading banks into West Coast regional bank First Republic.
While Washington appears to have been successful in stemming depositor panic as net outflows from regional banks have slowed to a trickle, we respect that comparisons have been made to the collapse of Lehman Brothers and Washington Mutual during the Great Financial Crisis. We think today is far different as banks are far better capitalized and the three banks that failed had unique profiles not present at other institutions. As such, we are taking advantage of the big plunges in shares of banks and insurance companies by adding to our financial holdings in TPS Portfolio.
The banking issues add to the ever-present uncertainty with comments from Jerome H. Powell illustrating the point. The Federal Reserve Chair said, “Since our previous FOMC meeting, economic indicators have generally come in stronger than expected, demonstrating greater momentum in economic activity and inflation.” He added, “We believe, however, that events in the banking system over the past two weeks are likely to result in tighter credit conditions for households and businesses, which would in turn affect economic outcomes.”
The health of the economy is a conundrum as Bloomberg calculates a 65% chance of recession in the next 12 months, but the Atlanta Fed estimates that Q1 GDP growth was 2.5% and the FOMC projects GDP growth of 0.4% this year and 1.2% in 2024. Those GDP figures are inflation-adjusted and it is likely that nominal growth will be solid, especially as actual growth in Q4 2022 rose 7.3%, versus a 2.6% increase on a real basis, so we think the backdrop for corporate profits will remain supportive.
We are always braced for downside volatility, but with valuations reasonable for stocks in our portfolios and the Fed likely near the end of its tightening cycle, we expect to be rewarded for being greedy while others are fearful.
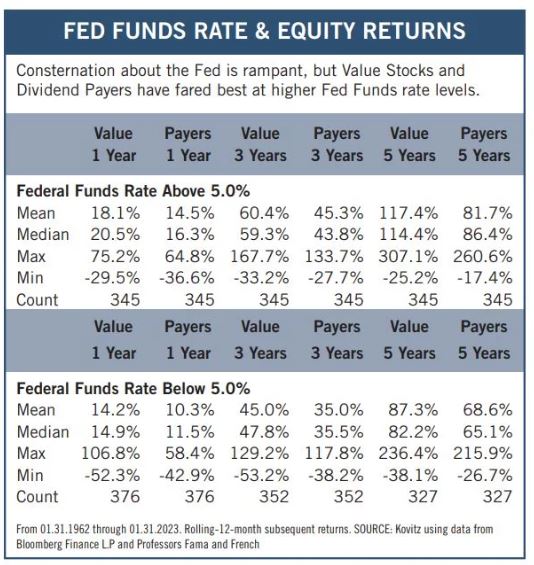
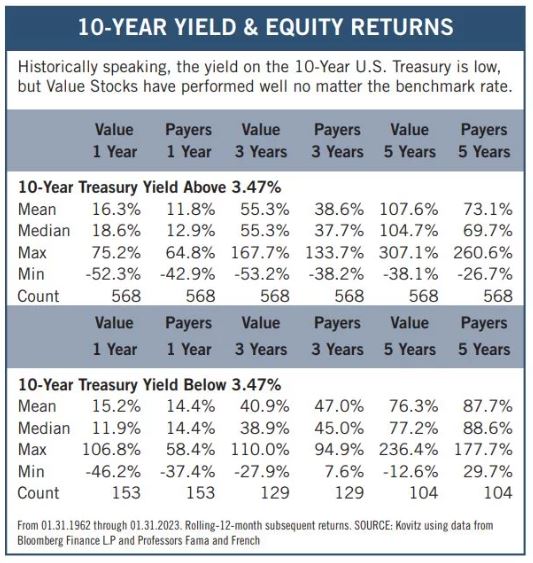
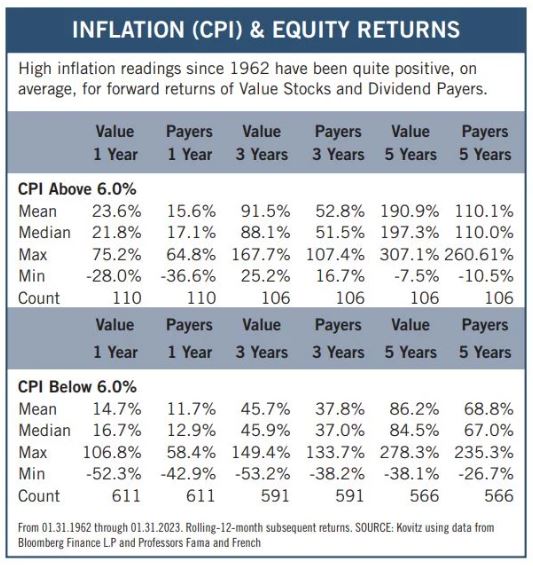
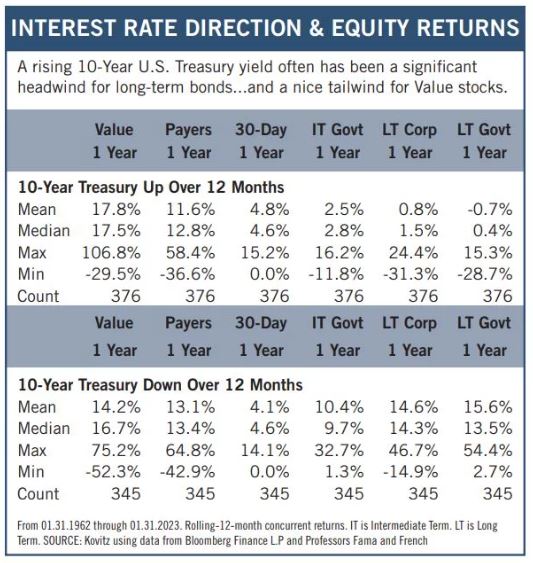
Graphic Detail: Fed Funds, Interest & Inflation Rates
There are numerous issues for equity investors to fret about these days, with elevated Fed Funds, 10-Year U.S. Treasury and Inflation rates high on the list of worries. Happily, and helping to support our oft-stated admonition that the secret to success in stocks is not to get scared out of them, students of market history should take heart in the long-term return figures below. Past performance is no guarantee of future performance, but Value Stocks and Dividend Payers have enjoyed excellent returns, on average, in environments like the present.
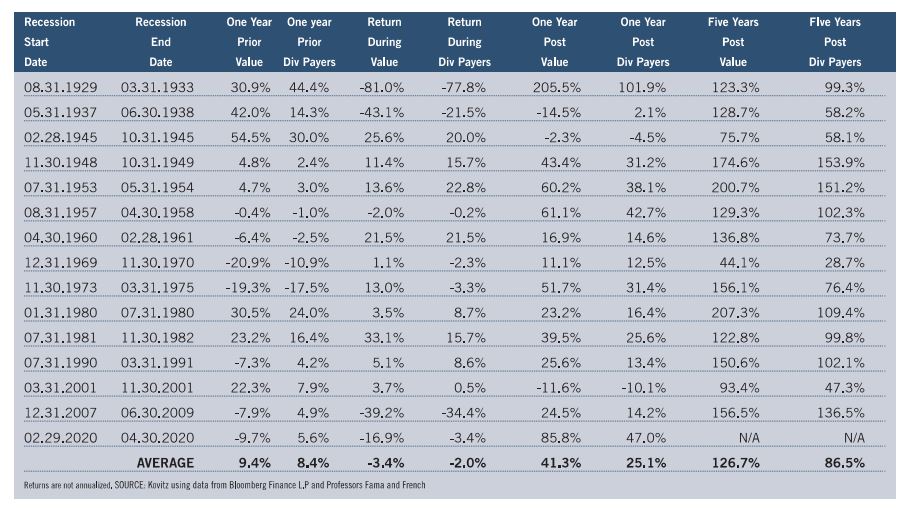
Graphic Detail: Recessions
Famed American Economist Paul Samuelson years ago joked, “Economists have predicted nine of the last five recessions,” and forecasting today remains as fraught with peril as ever. After all, calculations from Bloomberg have shown a 50% or greater chance of recession over the ensuing 12 months since last August, yet real GDP growth for Q4 2022 came in at an impressive 2.6%, the Atlanta Fed’s current estimate for Q1 2023 growth is 2.5% and the latest projections from the Federal Reserve call for GDP to grow 0.4% this year and 1.2% in 2024.
To be sure, the Bloomberg recession estimate just ticked up to 65% from 60%, and the forward-looking Leading Economic Index (LEI) fell by 0.3% in February. The keeper of that gauge, The Conference Board, asserted, “While the rate of month-over-month declines in the LEI have moderated in recent months, the leading economic index still points to risk of recession in the U.S. economy. The most recent financial turmoil in the U.S. banking sector is not reflected in the LEI data but could have a negative impact on the outlook if it persists. Overall, The Conference Board forecasts rising interest rates paired with declining consumer spending will most likely push the U.S. economy into recession in the near term.”
On the other hand, the employment situation remains remarkably robust and some of the underlying indicators used by the National Bureau of Economic Research (NBER) to determine the timing of a recession have actually improved this year. Still, few think the Federal Reserve will be able to achieved the intended ‘soft landing,’ but the economy has held up very well despite a jump in the Fed Funds rate to 5.0% from 0.25% at the end of 2021.
Obviously, the economic crystal ball is cloudy, so many investors are likely sitting on the sidelines, even as crunching nearly a century of data supports the view that the only problem with market timing is getting the timing right. We looked at all of the NBER’s declared recessions since 1929 and calculated returns for Value Stocks and Dividend Payers preceding, during and following each economic contraction. Equity returns in the lead-up to the recessions are generally good (averaging 9%) and we think one wouldn’t want to miss out on those gains. Not owning stocks during recessions would spare modest losses, but the NBER doesn’t determine recessions in real time, meaning the recording lag significantly complicates timing this type of trade. And, the performance numbers have been stellar, on average, coming out of recessions!
Recommended Stock List
In this space, we list all of the stocks we own across our multi-cap-value managed account strategies and in our four newsletter portfolios. See the last page for pertinent information on our flagship TPS strategy, which has been in existence since the launch of The Prudent Speculator in March 1977.
Readers are likely aware that TPS has long been monitored by The Hulbert Financial Digest (“Hulbert”). As industry watchdog Mark Hulbert states, “Hulbert was founded in 1980 with the goal of tracking investment advisory newsletters. Ever since it has been the premiere source of objective and independent performance ratings for the industry.” For info on the newsletters tracked by Hulbert, visit: http://hulbertratings.com/since-inception/.
Keeping in mind that all stocks are rated as “Buys” until such time as we issue an official Sales Alert, we believe that all of the companies in the tables on these pages trade for significant discounts to our determination of long-term fair value and/or offer favorable risk/reward profiles. Note that, while we always seek substantial capital gains, we require lower appreciation potential for stocks that we deem to have more stable earnings streams, more diversified businesses and stronger balance sheets. The natural corollary is that riskier companies must offer far greater upside to warrant a recommendation. Further, as total return is how performance is ultimately judged, we explicitly factor dividend payments into our analytical work.
While we always like to state that we like all of our children equally, meaning that we would be fine in purchasing any of the 100+ stocks, we remind subscribers that we very much advocate broad portfolio diversification with TPS Portfolio holding more than eighty of these companies. Of course, we respect that some folks may prefer a more concentrated portfolio, however our minimum comfort level in terms of number of overall holdings in a broadly diversified portfolio is at least thirty!
TPS rankings and performance are derived from hypothetical transactions “entered” by Hulbert based on recommendations provided within TPS, and according to Hulbert’s own procedures, irrespective of specific prices shown within TPS, where applicable. Such performance does not reflect the actual experience of any TPS subscriber. Hulbert applies a hypothetical commission to all “transactions” based on an average rate that is charged by the largest discount brokers in the U.S., and which rate is solely determined by Hulbert. Hulbert’s performance calculations do not incorporate the effects of taxes, fees, or other expenses. TPS pays an annual fee to be monitored and ranked by Hulbert. With respect to “since inception” performance, Hulbert has compared TPS to 19 other newsletters across 62 strategies (as of the date of this publication). Past performance is not an indication of future results. For additional information about Hulbert’s methodology, visit: http://hulbertratings.com/methodology/.

Portfolio Builder
Each month in this column, we highlight 10 stocks with which readers might populate their portfolios: Bank of America (BAC), CVS Health (CVS), Prudent Financials (PRU) and seven others.