Preview of January 2023 Newsletter
Editors Note
“Only when the tide goes out do you discover who has been swimming naked.” — Warren Buffett
Happy New Year! With stocks suffering a sizable decline in December, we suspect that few are sorry to see the calendar turn to 2023. After all, the broad-based S&P 500 and Russell 3000 equity indexes each retreated more than 5.7% last month, capping a terrible year in which the former ended with a total return of negative 18.1% and the latter minus 19.2%.
There were few places to hide in 2022 as the MSCI Emerging Market and Developed Market equity indexes posted respective losses on a total return basis of 17.7% and 19.9%, while even supposedly safer fixed income instruments stumbled badly. Believe it or not, the Bloomberg Barclays Global and U.S. Aggregate Bond indexes skidded 16.2% and 13.0%, respectively, on a total return basis.
Of course, all those dollops of red ink were not nearly as bad as the massive wallops inflicted on formerly high-flying meme stocks, SPACs, profitless companies and richly valued names, which endured plunges on par with the bursting of the Tech Bubble back in 2000. The New York Times proclaimed, “2022 Was the Year the Music Stopped on Wall Street.” Indeed, a spike in inflation led to a series of rate hikes from a newly hawkish Federal Reserve, despite many not-so-grand economic numbers, forcing a major reassessment of equity valuations.
Not surprisingly, the renewed emphasis on financial fundamentals favored reasonably priced stocks by a wide margin last year, with double-digit percentage return gaps between Growth and Value indexes, even as the latter simply lost less than the former. There are no awards for the declines on Value last year, but we were glad to see that inexpensive stocks held up far better, which is in keeping with the historical evidence when inflation is high, when the Fed is tightening, when interest rates are moving up and when the economy is not robust.
We had our share of winners last year, but many of our stocks were caught in the overall downtrend. As such, we are now up to 11 negative performance years (1981, 1984, 1987, 1990, 1994, 2002, 2008, 2011, 2015, 2018 & 2022) out of the 46 since the launch of The Prudent Speculator in 1977.
Happily, there have been 35 positive years in our history, with the gains in those green periods dwarfing the losses in the lean years. Certainly, it would be nice to somehow have sidestepped the corrections and Bear Markets along the way, but there is far too much evidence that confirms that the only problem with market timing is getting the timing right. Illustrating the point, Bloomberg noted that going into 2022, Wall Street strategists were predicting another good year, with an S&P 500 target near 4950. The index finished the year at 3840.
On the flip side, and keeping in mind that it is good to be greedy when others are fearful, there is little enthusiasm for stocks today. The current consensus prognostication from those same strategists is 4078, the 6% estimated gain for 2023 well below the usual upside target. Folks on Main Street are even less enchanted with the outlook as the latest Sentiment Survey from AAII showed a score of 26.5% to 47.6% in favor of the Bears, versus the usual seven-point Bull advantage.
We respect that stocks face headwinds as we head into 2023, with the Federal Reserve estimating real U.S. GDP growth of 0.5%, unemployment of 4.6%, core PCE inflation of 3.5% and a Fed Funds rate of 5.1%. However, given that the average stock ended 2022 in a Bear Market, we think a far more dismal set of economic numbers has been priced into many stocks. Further, we believe higher nominal GDP growth this year, along with generally healthy consumer balance sheets, will support modest corporate profit growth, while we do not think market interest rates will move significantly higher. Warren Buffett states that a pin lies in wait for every bubble, and some balloons are still likely to burst, but plenty of air has been let out of equities while we remain very comfortable with the NTM P/E ratio of 12 and dividend yield of 2.9% for TPS Portfolio.
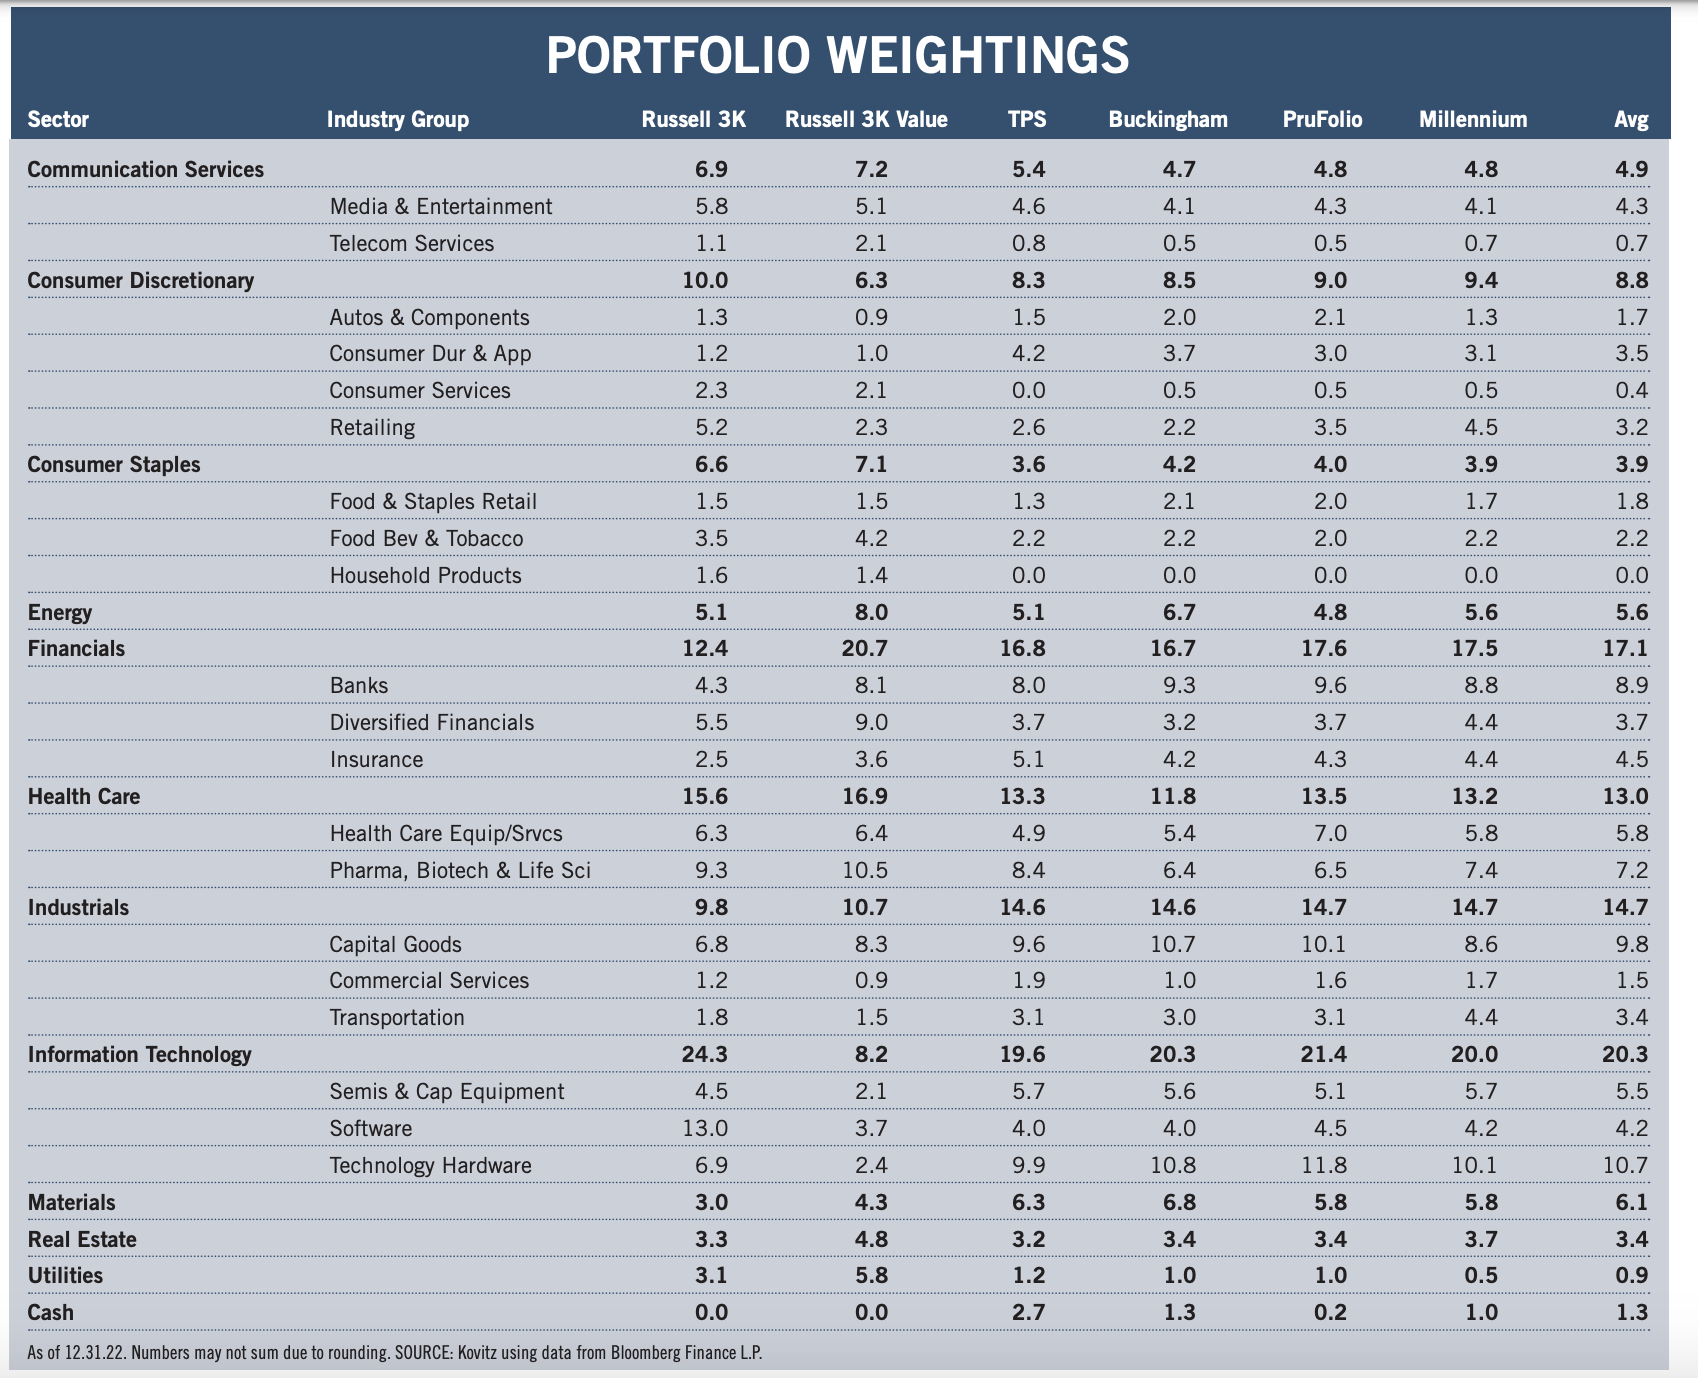
Graphic Detail: Sector and Industry Group Weightings
Time again to compare the current sector and industry group weightings of our four newsletter portfolios to those of the broad-based Russell 3000 and Russell 3000 Value indexes, noting that our valuation metrics more closely resemble those of Value-oriented gauges. While we very much remain bottom-up stock pickers focused on the merits of individual companies, we also keep an eye on the composition of the indexes in order to ensure that we are comfortable in the over- or under-weighting of a particular sector or industry group. As such, we are able to better focus our subjective reviews on the output of the objective new-idea generation screens that we run every day on areas in which we might desire additional exposure, be it to augment a sector with minimal ownership or to add to a particularly undervalued industry. Illustrative of this process were new recommendations in 2022 of stocks in the Health Care, Communication Services, Consumer Discretionary, Energy and Real Estate sectors. There is a great deal of art accompanying the science of portfolio construction and sector and industry group weightings are always used as a guide and not as the gospel. Over time, the gaps have narrowed, but inevitably there will be dispersion across the newsletter portfolios due to the timing of purchases and modest differences in the names held, even as the same desire for broad diversification has always been pervasive.
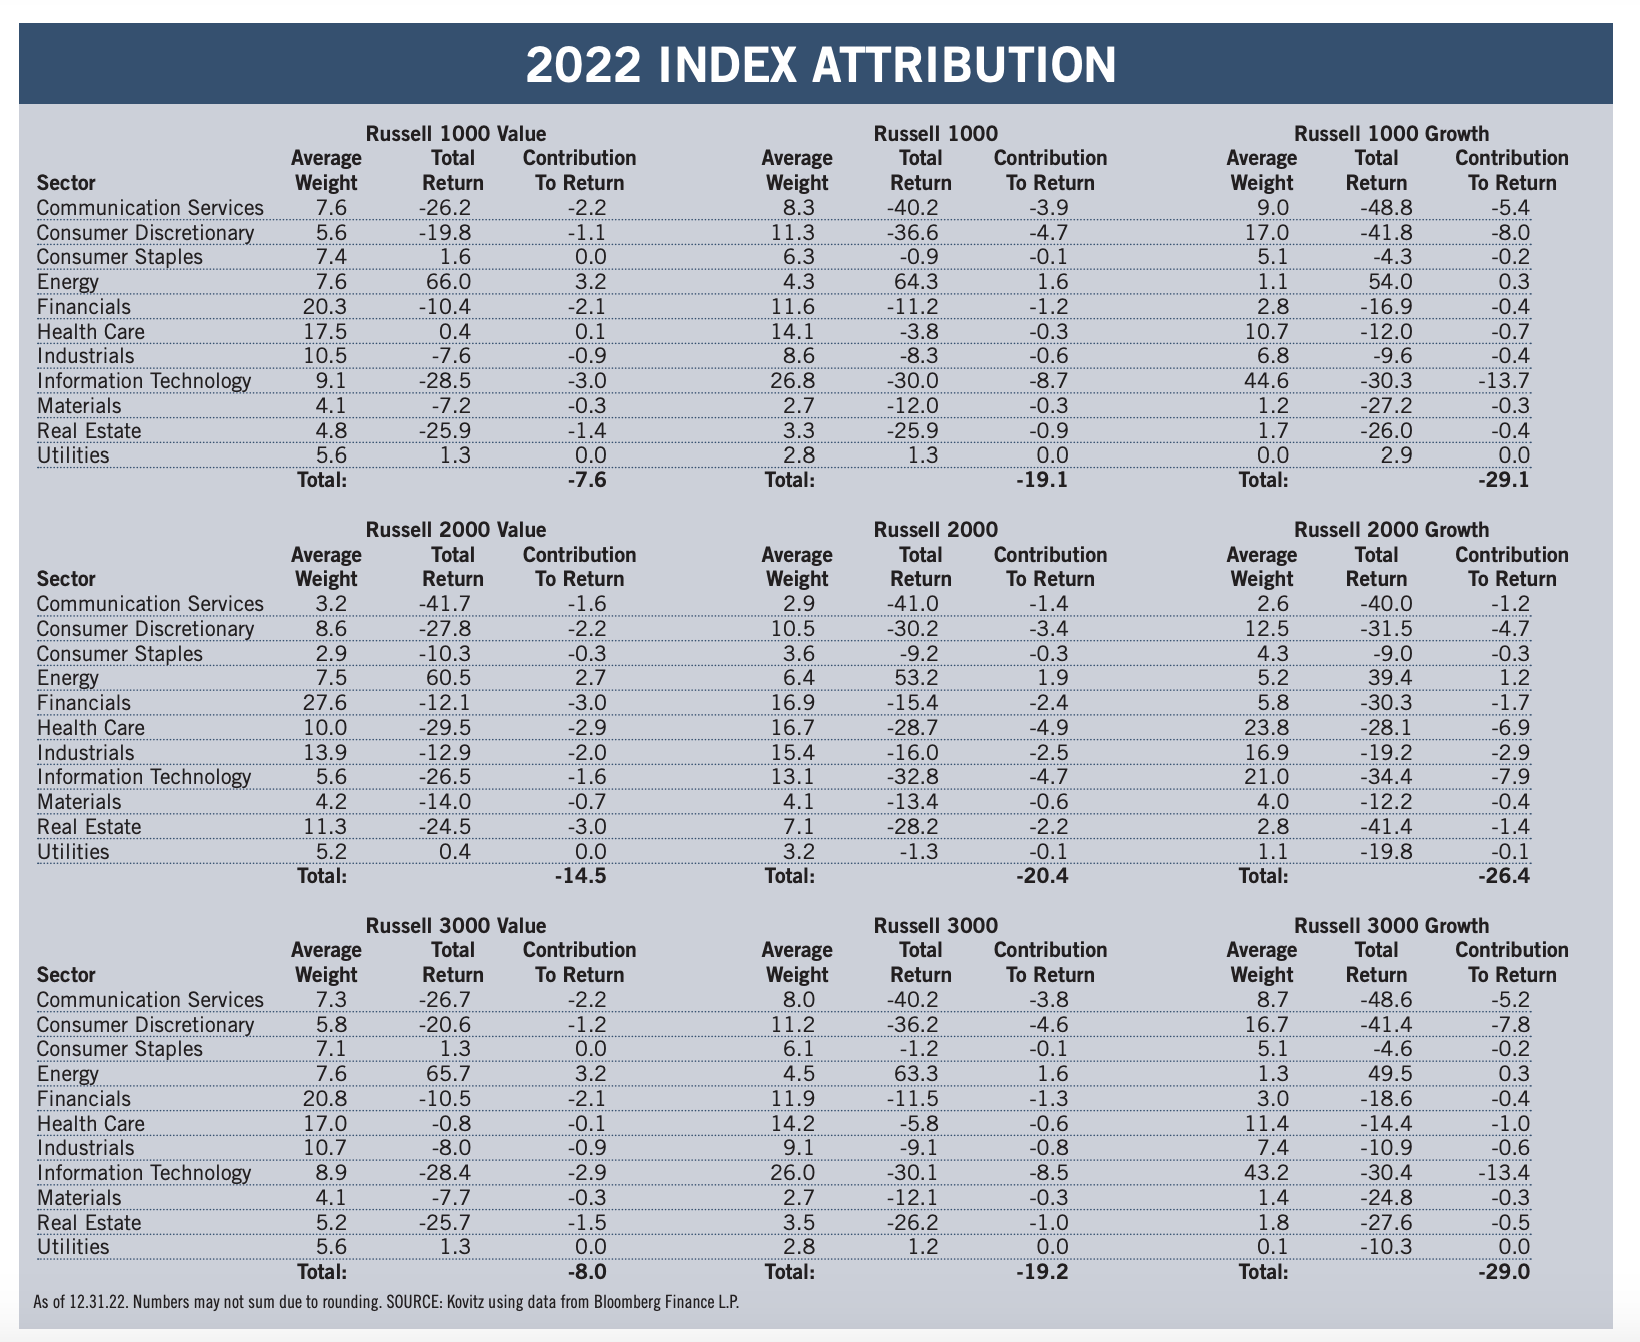
Graphic Detail: Value vs. Growth Sector Attribution
The following two paragraphs hardly do the subject justice, but the simple attribution displayed below helps to better understand which market sectors contributed the most (or least) to index returns. Given our willingness to buy stocks of any market capitalization, we look at the large-cap Russell 1000, the small-cap Russell 2000 and the all-cap Russell 3000 indexes, as well as the Value and Growth versions of each benchmark. We note that our portfolios, with what we believe to be their inexpensive valuations, have long resembled the Value indexes in terms of their financial metrics, even as our sector weightings have more often than not been lighter in Financials and heavier in Information Technology stocks.
It was one of the largest return chasms in history between Value and Growth for the Russell indexes, with the latter ending 2022 deep into a Bear Market and the former posting sizable losses as well. Returns for the Russell 2000 indexes had the smallest dispersion, even as the Value component beat the Growth, due almost entirely to smaller weightings in Health Care and Info Tech. The largercap Russell 1000 and 3000 Value benchmarks benefitted from lighter exposure to Consumer Discretionaries and Info Tech (both endured awful performance, large and small), while big gains and a greater weighting in Energy offset some of the losses, with near break-even returns in Health Care and Utilities helping the relative cause.
Recommended Stock List
In this space, we list all of the stocks we own across our multi-cap-value managed account strategies and in our four newsletter portfolios. See the last page for pertinent information on our flagship TPS strategy, which has been in existence since the launch of The Prudent Speculator in March 1977.
Readers are likely aware that TPS has long been monitored by The Hulbert Financial Digest (“Hulbert”). As industry watchdog Mark Hulbert states, “Hulbert was founded in 1980 with the goal of tracking investment advisory newsletters. Ever since it has been the premiere source of objective and independent performance ratings for the industry.” For info on the newsletters tracked by Hulbert, visit: http://hulbertratings.com/since-inception/.
Keeping in mind that all stocks are rated as “Buys” until such time as we issue an official Sales Alert, we believe that all of the companies in the tables on these pages trade for significant discounts to our determination of longterm fair value and/or offer favorable risk/reward profiles. Note that, while we always seek substantial capital gains, we require lower appreciation potential for stocks that we deem to have more stable earnings streams, more diversified businesses and stronger balance sheets. The natural corollary is that riskier companies must offer far greater upside to warrant a recommendation. Further, as total return is how performance is ultimately judged, we explicitly factor dividend payments into our analytical work.
While we always like to state that we like all of our children equally, meaning that we would be fine in purchasing any of the 100+ stocks, we remind subscribers that we very much advocate broad portfolio diversification with TPS Portfolio holding more than eighty of these companies. Of course, we respect that some folks may prefer a more concentrated portfolio, however our minimum comfort level in terms of number of overall holdings in a broadly diversified portfolio is at least thirty!
TPS rankings and performance are derived from hypothetical transactions “entered” by Hulbert based on recommendations provided within TPS, and according to Hulbert’s own procedures, irrespective of specific prices shown within TPS, where applicable. Such performance does not reflect the actual experience of any TPS subscriber. Hulbert applies a hypothetical commission to all “transactions” based on an average rate that is charged by the largest discount brokers in the U.S., and which rate is solely determined by Hulbert. Hulbert’s performance calculations do not incorporate the effects of taxes, fees, or other expenses. TPS pays an annual fee to be monitored and ranked by Hulbert. With respect to “since inception” performance, Hulbert has compared TPS to 19 other newsletters across 62 strategies (as of the date of this publication). Past performance is not an indication of future results. For additional information about Hulbert’s methodology, visit: http://hulbertratings.com/methodology/.

Portfolio Builder
Each month in this column, we highlight 10 stocks with which readers might populate their portfolios: Civitas Resources (CIVI), Norfolk Southern (NSC), Zimmer Biomet (ZBH) and seven others.