Preview of May 2022 Newsletter
Editor’s Note
“We depend on mis-priced businesses through a mechanism where we’re not responsible for the mispricing.” — Warren Buffett
With even the mainstream media shouting that the 12.9% loss on the S&P 500 index through the first four months of 2022 was the worst start to a year since 1939 and the Nasdaq Composite Index plunging 13.3% in April, its biggest monthly loss since 2008, it is little wonder that investor pessimism has spiked. Incredibly, the latest weekly Sentiment Survey from the American Association of Individual Investors (AAII) saw the number of Bears skyrocket to 59.4%, the fifth-highest count in the history of the 35-year-old gauge, with the Bull-Bear Spread coming in at -43.0%, tied for the fourth-lowest tally ever.
Believe it or not, the current AAII numbers are worse than those following the Crash of ‘87, the Terrorist Attacks of 9/11 and the declaration of the COVID-19 Pandemic two years ago. In fact, they trail only the figures leading up to the first Gulf War in 1990, the aftermath of the Collapse of Lehman Brothers in 2008 and the Bottom of the Great Financial Crisis in March 2009.
Certainly, we do not want to make light of the worries today about the war in Ukraine, sky-high inflation, rising interest rates and a much-less accommodative Federal Reserve, but there is a statistical reason why AAII Sentiment is viewed as a terrific contra-indicator—subsequent equity market gains, on average, following the nine prior extremely Bearish readings were sensational.
The sample size is obviously very small (four for Bears and five for Bull-Bear Spread) and the period following Lehman suffered a 3.9% decline, but the average sixmonth return going-forward for the Russell 3000 index was 28%! That is not to say that stocks will quickly rebound as those who added to their equity exposure in October 2008 endured much bigger short-term losses. However, long-term-oriented investors who remembered that the secret to success with stocks is not to get scared out of them were very happy with what transpired over the ensuing one, three, five, ten and 14+ years.
To be sure, this time is different, but every period, disconcerting or otherwise, is different, even as Charlie Munger said at the Berkshire Hathaway confab in Omaha this past weekend: “I don’t think we ever had anything quite like we have had now in terms of the volumes of pure gambling activity going on daily.” Of course, Mr. Munger and Warren Buffett put money to work during the first quarter, reducing the conglomerate’s cash hoard by $40 billion, with the Oracle of Omaha quipping, “Sometimes markets do crazy things. That’s good for Berkshire, not because we’re smart…but because we’re sane.”
And speaking of sanity, we are not unhappy to see the recent carnage in “meme” stocks, SPACs and more than a few profitless companies, even as the indiscriminate selling in the Nasdaq has bled over to our reasonably priced Info Tech and Communication Services holdings like Apple, Alphabet, Microsoft and Meta Platforms. Still, inexpensive stocks as a group have held up much better during the two market corrections this year, with the Russell 3000 Value index (R3KV) losing less year-to-date than even the Global and U.S. Aggregate Bond benchmarks.
Volatility is always part of the investment process, so nothing witnessed this year is unusual, and we can’t forget the outsized equity returns in 2021, but we realize that there are no prizes for the recent red ink in our portfolios. However, we see no reason to alter our long-term enthusiasm, especially as TPS Portfolio sports respective trailing and NTM P/E ratios of 13 and 12, compared to 18 and 15 for the R3KV and 22 and 19 for the S&P, while the dividend yield of 2.4% is generous versus 2.1% for the R3KV and 1.4% for the S&P. We also like that the historical evidence shows that Value stocks have enjoyed double-digit returns, on average, when inflation is elevated or when the Fed is tightening or when government bond yields are rising. True, recession risks are higher, but even such an event, historically, has been no reason to sell Value stocks.
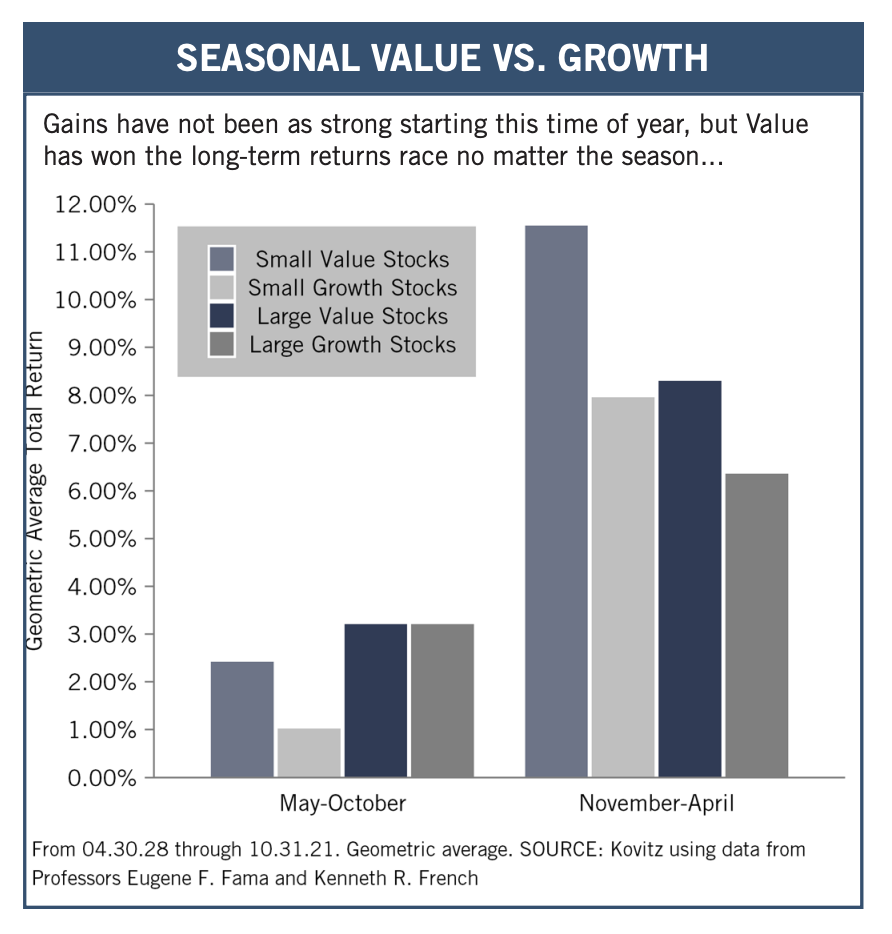
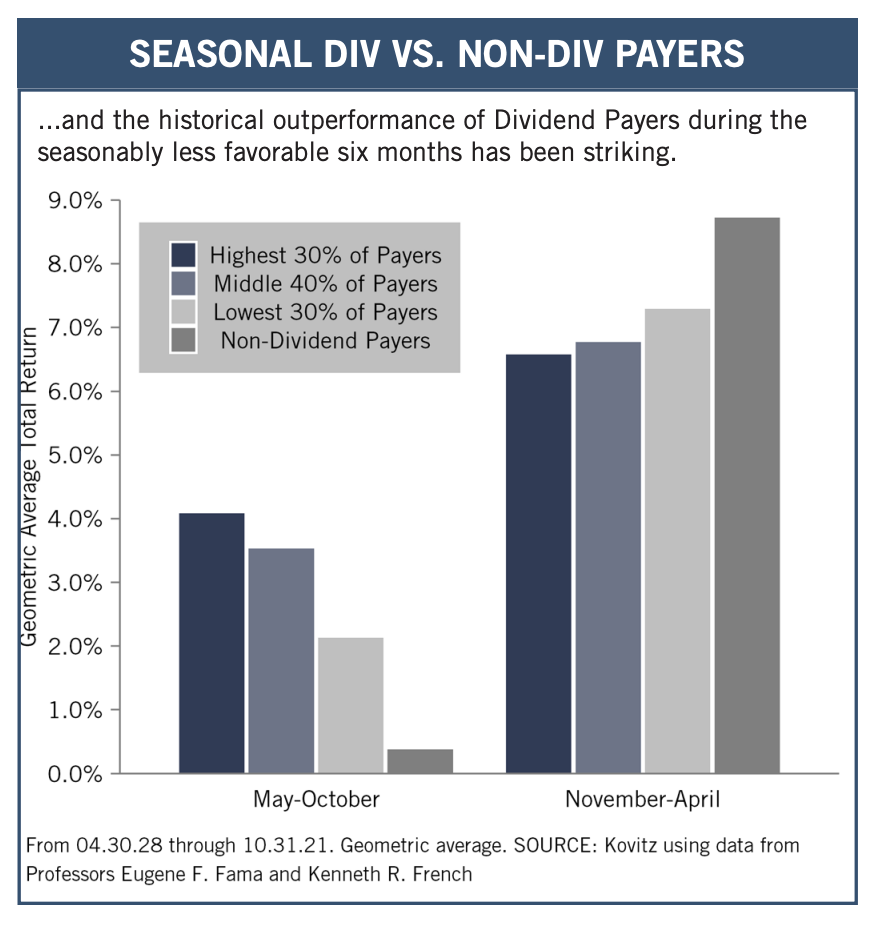
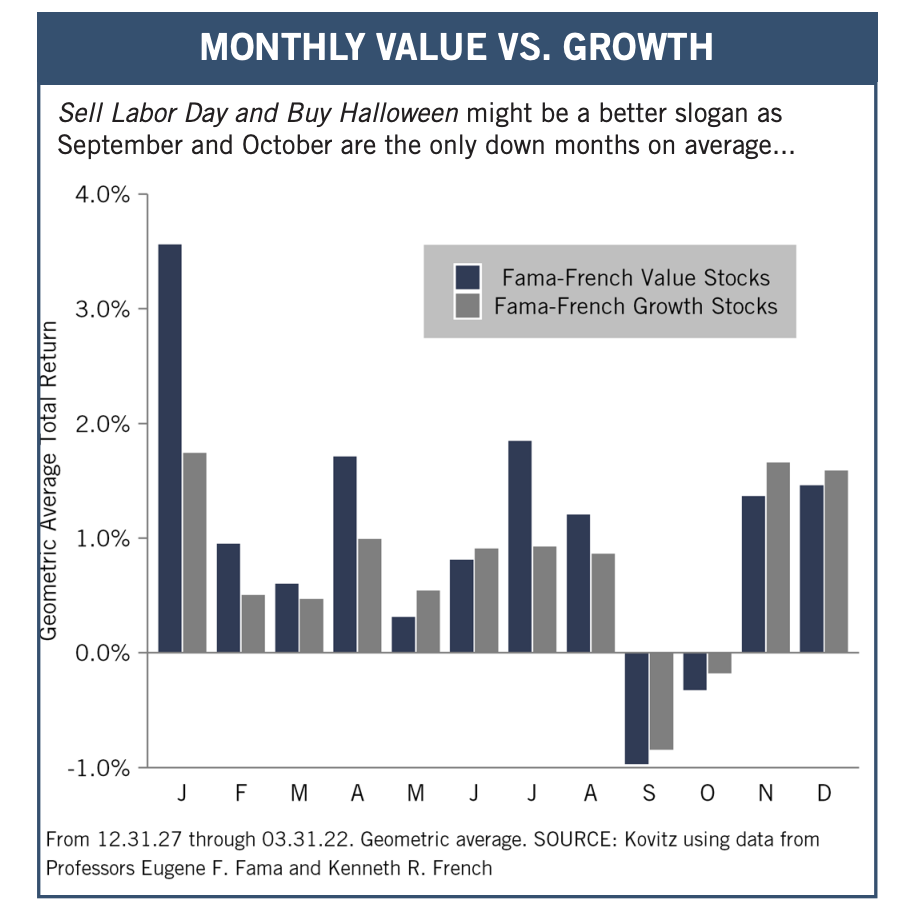
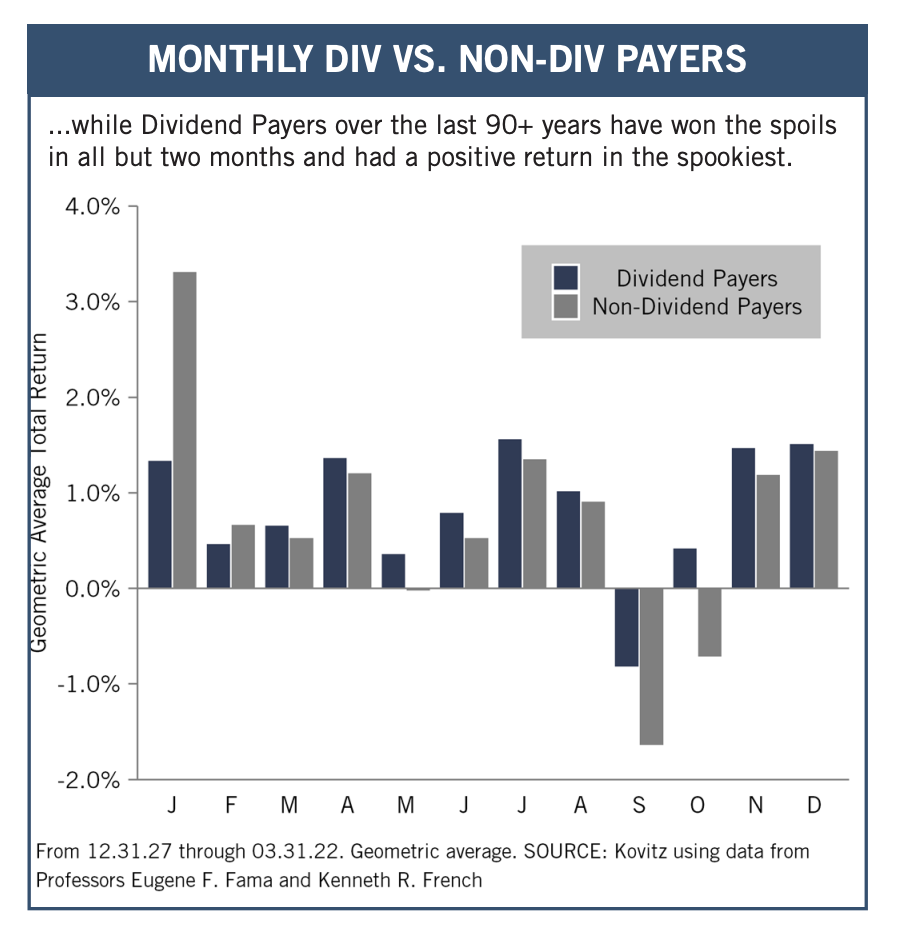
Graphic Detail: Seasonality
Given that stocks went south in the Nov. 2021 – Apr. 2022 seasonally favorable period, but generally moved higher in the May 2021 – Oct. 2021 seasonally less favorable time span, we would never want to make major allocation decisions based on the calendar. Of course, that does not stop pundits from warning that folks should Sell in May and Go Away, but the historical data show that Dividend Payers and Value Stocks have enjoyed positive absolute and relative returns, on average, during the May to October period.
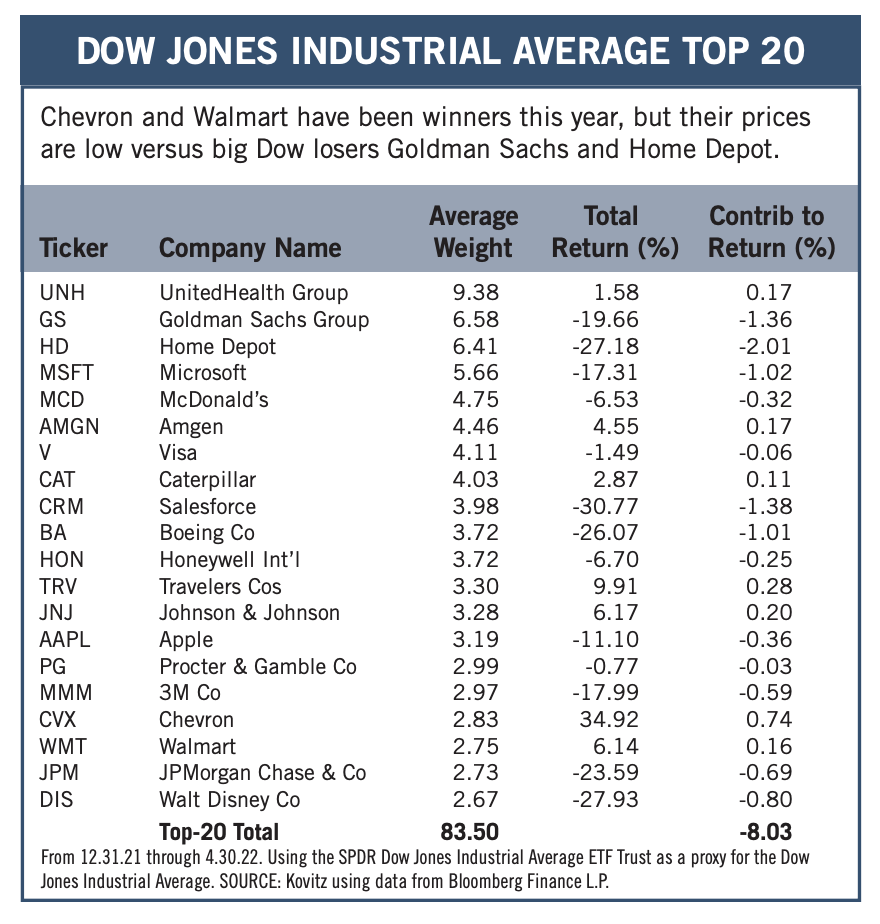
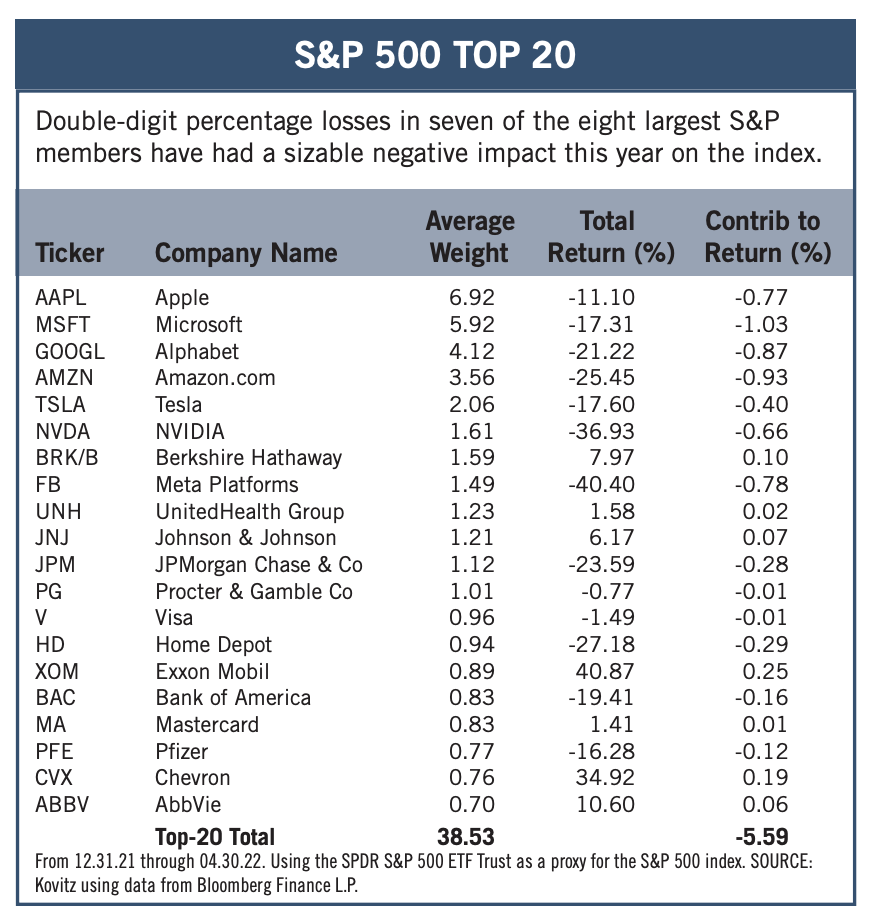
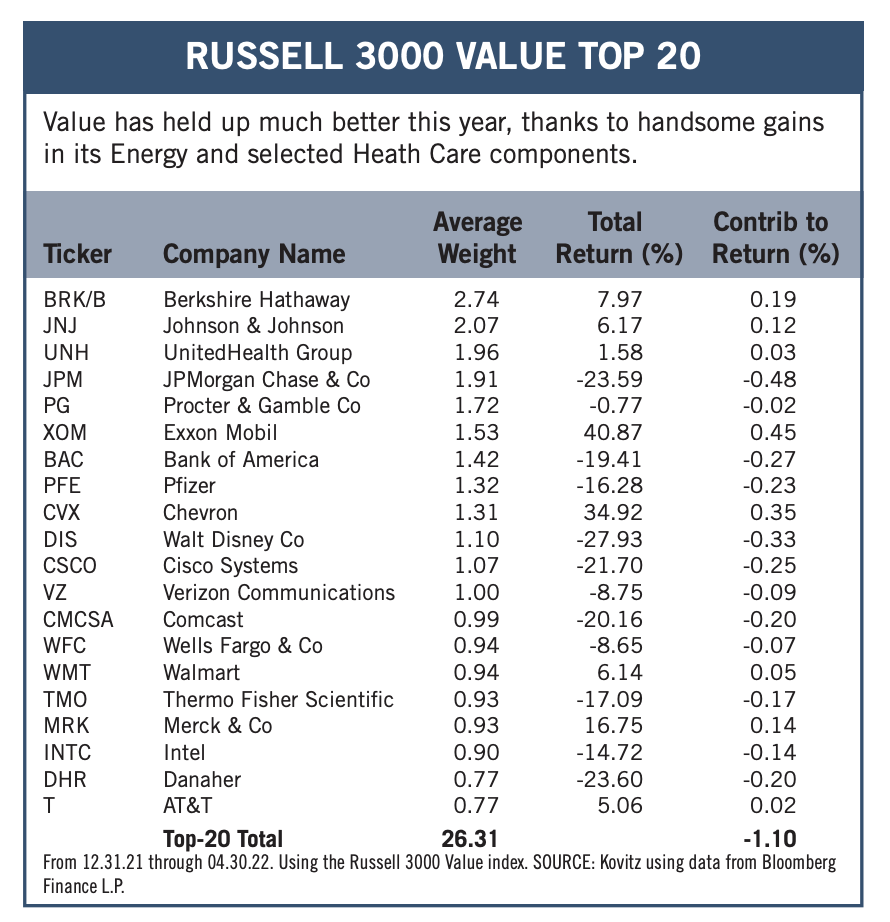
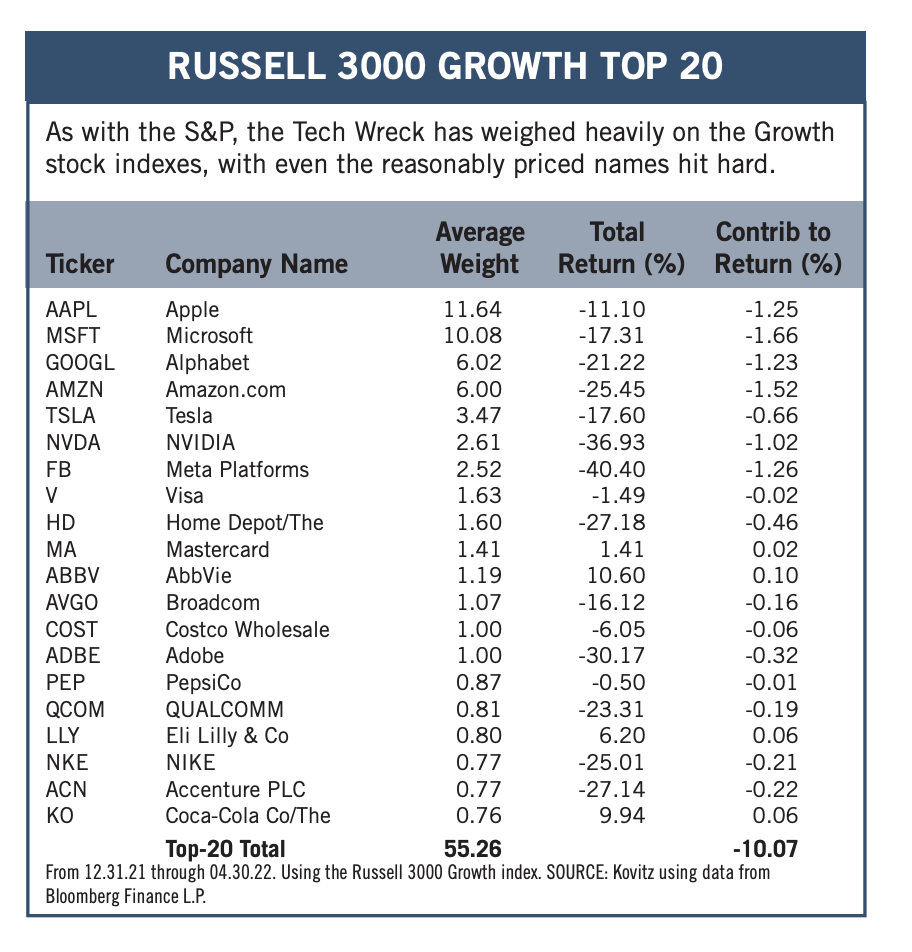
Graphic Detail: Market of Stocks – Index Composition
After outperforming by a modest amount in 2021, the equal-weighted S&P 500 had a much smaller negative total return (-8.95%) than the capitalization-weighted S&P 500 (-12.92%) over the last four months. Illustrating a risk of indexing, a handful of stocks in the major market averages drive performance, as the five highest-priced Dow Jones Industrials members accounted for 32.8% and the five largest S&P stocks represented 22.6% of those benchmarks. The Russell 3000 Value index is much less top-heavy, with a 10.4% weighting for its top five.
Recommended Stock List
In this space, we list all of the stocks we own across our multi-cap-value managed account strategies and in our four newsletter portfolios. See the last page for pertinent information on our flagship TPS strategy, which has been in existence since the launch of The Prudent Speculator in March 1977.
Readers are likely aware that TPS has long been monitored by The Hulbert Financial Digest (“Hulbert”). As industry watchdog Mark Hulbert states, “Hulbert was founded in 1980 with the goal of tracking investment advisory newsletters. Ever since it has been the premiere source of objective and independent performance ratings for the industry.” For info on the newsletters tracked by Hulbert, visit: http://hulbertratings.com/since-inception/
Keeping in mind that all stocks are rated as “Buys” until such time as we issue an official Sales Alert, we believe that all of the companies in the tables on these pages trade for significant discounts to our determination of longterm fair value and/or offer favorable risk/reward profiles. Note that, while we always seek substantial capital gains, we require lower appreciation potential for stocks that we deem to have more stable earnings streams, more diversified businesses and stronger balance sheets. The natural corollary is that riskier companies must offer far greater upside to warrant a recommendation. Further, as total return is how performance is ultimately judged, we explicitly factor dividend payments into our analytical work.
While we always like to state that we like all of our children equally, meaning that we would be fine in purchasing any of the 100+ stocks, we remind subscribers that we very much advocate broad portfolio diversification with TPS Portfolio holding more than eighty of these companies. Of course, we respect that some folks may prefer a more concentrated portfolio, however our minimum comfort level in terms of number of overall holdings in a broadly diversified portfolio is at least thirty!
TPS rankings and performance are derived from hypothetical transactions “entered” by Hulbert based on recommendations provided within TPS, and according to Hulbert’s own procedures, irrespective of specific prices shown within TPS, where applicable. Such performance does not reflect the actual experience of any TPS subscriber. Hulbert applies a hypothetical commission to all “transactions” based on an average rate that is charged by the largest discount brokers in the U.S., and which rate is solely determined by Hulbert. Hulbert’s performance calculations do not incorporate the effects of taxes, fees, or other expenses. TPS pays an annual fee to be monitored and ranked by Hulbert. With respect to “since inception” performance, Hulbert has compared TPS to 19 other newsletters across 62 strategies (as of the date of this publication). Past performance is not an indication of future results. For additional information about Hulbert’s methodology, visit: http://hulbertratings.com/methodology/.

Portfolio Builder
Each month in this column, we highlight 10 stocks with which readers might populate their portfolios: Apple (AAPL), Cohu (COHU), Google (GOOG) and seven others.