Preview of October 2022 Newsletter
Editor’s Note
“Patience is the best remedy for every trouble.” — Plautus
September lived down to its reputation as the worst month of the year this time around, with the S&P 500 tumbling 9.2% and the Nasdaq Composite Index skidding 10.4%, pushing the popular indexes well into Bear Market territory. Of course, downturns of 20% or more are not unusual, with the S&P seeing one every 3.4 years on average, but the 2022 plunge has been accompanied by a massive spike in interest rates that sent the Bloomberg Barclays Aggregate Bond Index to a loss of 14.6% over the first nine months of the year.
Not surprisingly, the red ink across most asset classes this year has soured equity investor confidence. In fact, the last two Bull-Bear Sentiment readings from the American Association of Individual Investors were among the most pessimistic in the history (35 years) of the measure, which we might argue is a major positive from a contrarian perspective.
Of course, it isn’t as if there is little about which to be concerned. After all, the war in Ukraine, supply-chain shortages and other geopolitical events have taken a back seat to the Federal Reserve’s fight against inflation. Indeed, Jerome H. Powell & Co. have hiked the target for the Fed Funds rate by 75 basis points at each of the last three FOMC Meetings, with the futures market currently projecting at least four more 0.25% increases this year.
Changes to monetary policy work with a lag, but thus far inflation has remained stubbornly high, with the Fed’s preferred gauge of inflation, the core Personal Consumption Expenditure (PCE), rising in August by 4.9%, up from 4.6% in July. As a result, Fed officials have continued to talk tough with Vice Chair Lael Brainard saying last week, “Monetary policy will need to be restrictive for some time to have confidence that inflation is moving back to target…We are committed to avoiding pulling back prematurely.”
Happily, given that surveys of longer-term inflation expectations have been declining, folks seem to be heeding the Fed’s message, though fears the tightening of monetary policy will tip the U.S. economy into recession continue to rise.
Obviously, time will tell whether the Fed can pull off a “soft landing,” but the latest estimate from the Organisation for Economic Co-operation and Development (OECD) calls for 1.5% real U.S. GDP growth this year and 0.5% growth next year. The labor market also remains remarkably robust, while consumer spending has held up well and consumer confidence has been climbing. And, the Atlanta Fed has boosted its outlook for real Q3 GDP growth to 2.3% as of October 3.
To be sure, the housing market has cooled considerably, the keepers of the Leading Economic Index are predicting a recession will hit next year and there have been some high-profile earnings shortfalls and disappointing outlooks. But, considering that stocks soared on October 3 & 4, due in part to a weaker-than-expected ISM manufacturing number and fewer job openings, traders now seem to be hoping the economy slows so that the Fed will pause its rate hikes and eventually pivot to rate reductions.
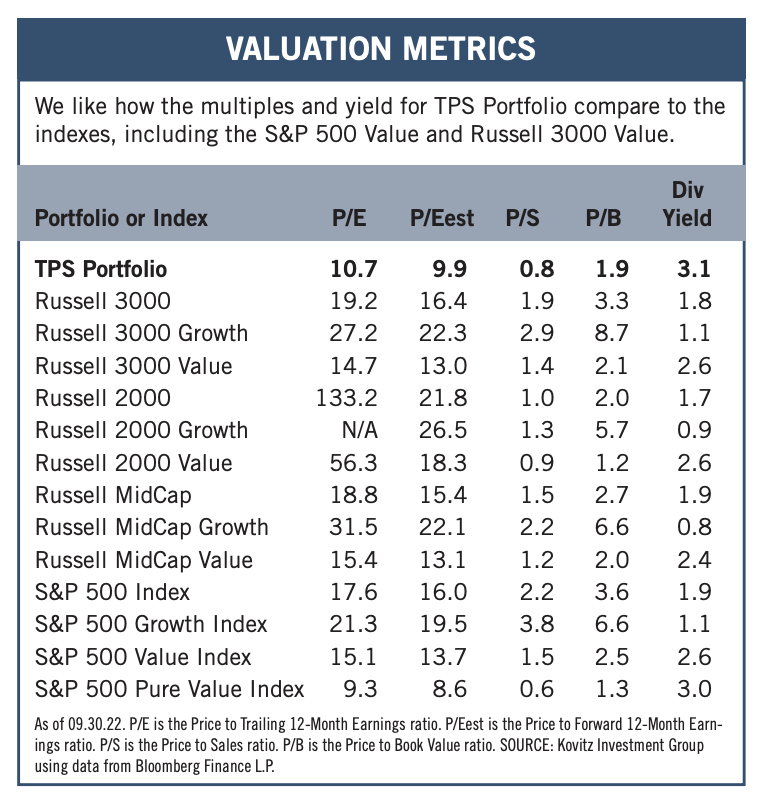
We understand that few were excited to hear Chair Powell state last month, “I wish there was a painless way to get [inflation] behind us. There isn’t.” Needless to say, we do not know what the near-term will bring, but we think that the equity markets have already discounted a significant amount of the Fed’s pain, given the substantial losses suffered this year. Even if a recession hits, we continue to take comfort in the reasonable valuation metrics and generous dividend yields of our broadly diversified portfolios of what we believe to be undervalued stocks.
History is a guide and never the gospel, but we cannot forget that equities have 9% to 13% per annum returns over the past 90+ years. There have been many scary selloffs along the way, but stocks have always overcome more difficult environments than what we are presently facing.
Graphic Detail: Long-Term Perspective
Bad news is plentiful these days. Just last week, Forbes.com shouted, “America’s Richest Tech Billionaires Have Lost $315 Billion In The Past Year.” And CNBC.com screamed, “Stock market losses wipe out $9 trillion from American’s wealth,” as data from the Federal Reserve showed that holdings of corporate equities and stock mutual funds fell to $33 trillion at the end of the second quarter, down from $42 trillion at the start of the year.
Throw in additional losses in the third quarter, and we suspect that some may be questioning their ownership of stocks. After all, the major market averages were off more than 20% from their highs, with the broad-based Russell 3000 index down 24.6% on the year. And the average stock was mired in its fourth Bear Market (2016, 2018, 2020 & 2022) in less than seven years.
No doubt, all of the negativity might lead folks to think that equities have been a miserable intermediate-term or even long-term investment. Certainly, we are not trying to sweep this year’s red ink under the rug, but Alphabet’s Larry Paige & Sergey Brin and Microsoft’s Bill Gates are not exactly on Skid Row (the three have a net worth near $100 billion, despite losing $28 to $30 billion each for the 12 months ended September 2). And that Federal Reserve household equity data shows that $33 trillion looks pretty good compared to the $22.7 trillion tally five years ago, $13.7 trillion 10 years ago and $7.4 trillion 20 years ago.
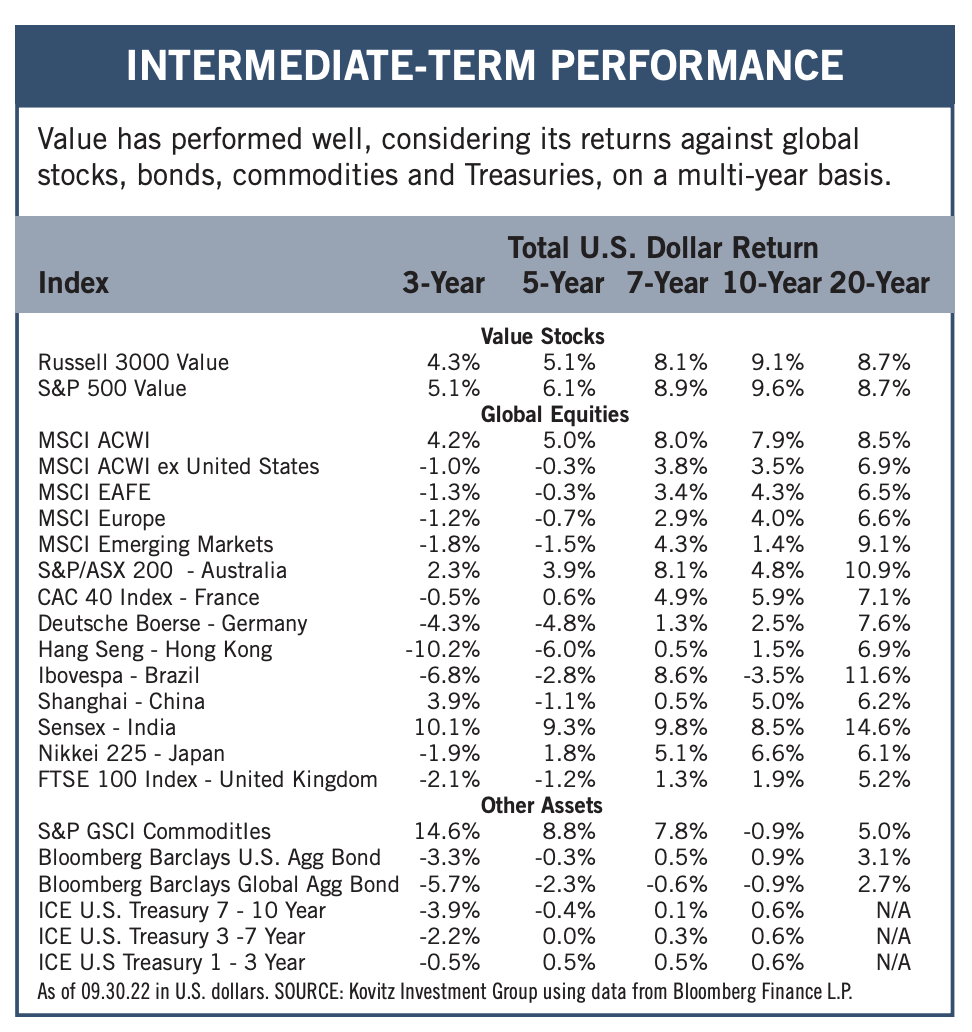
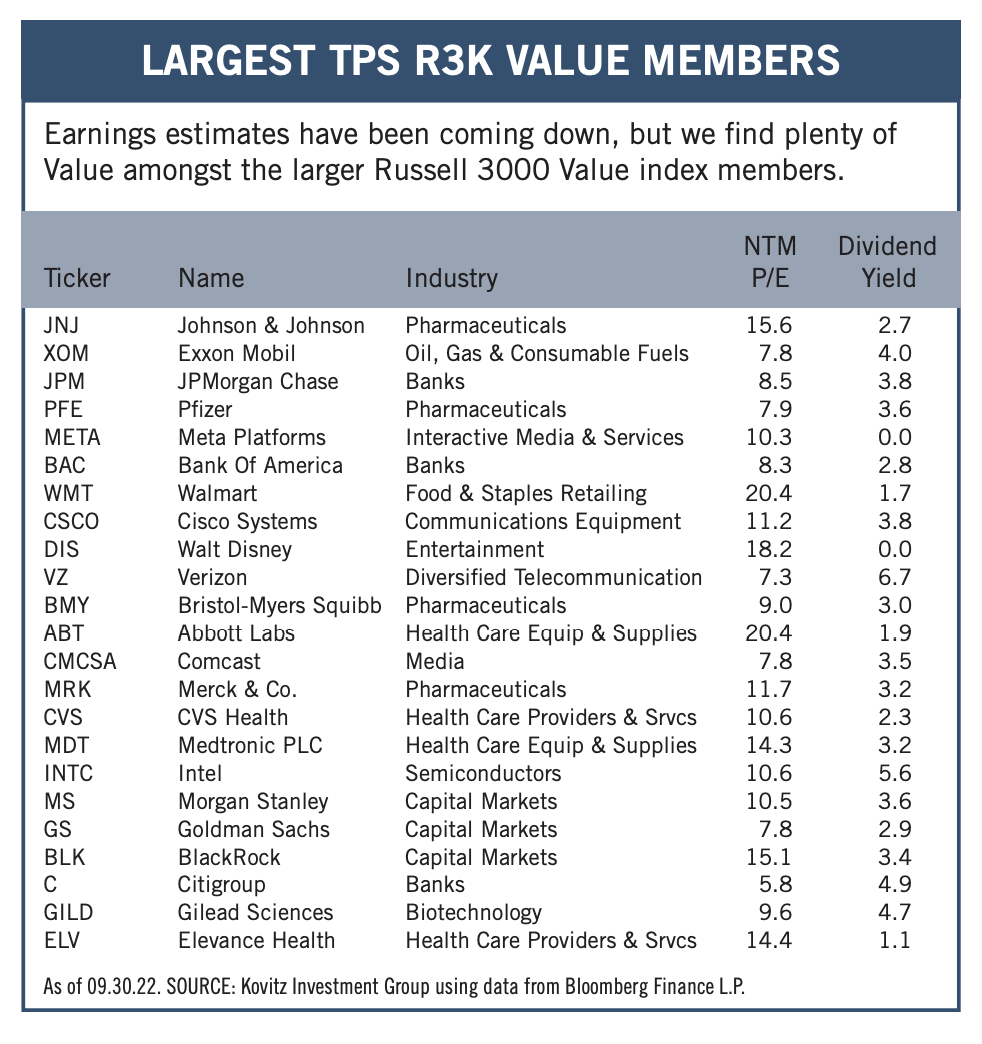
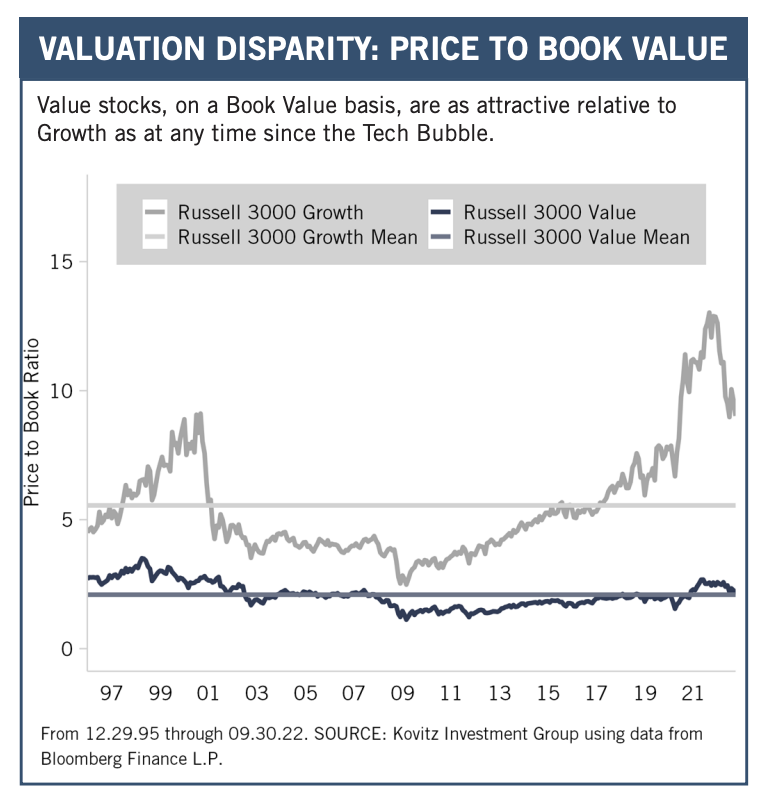
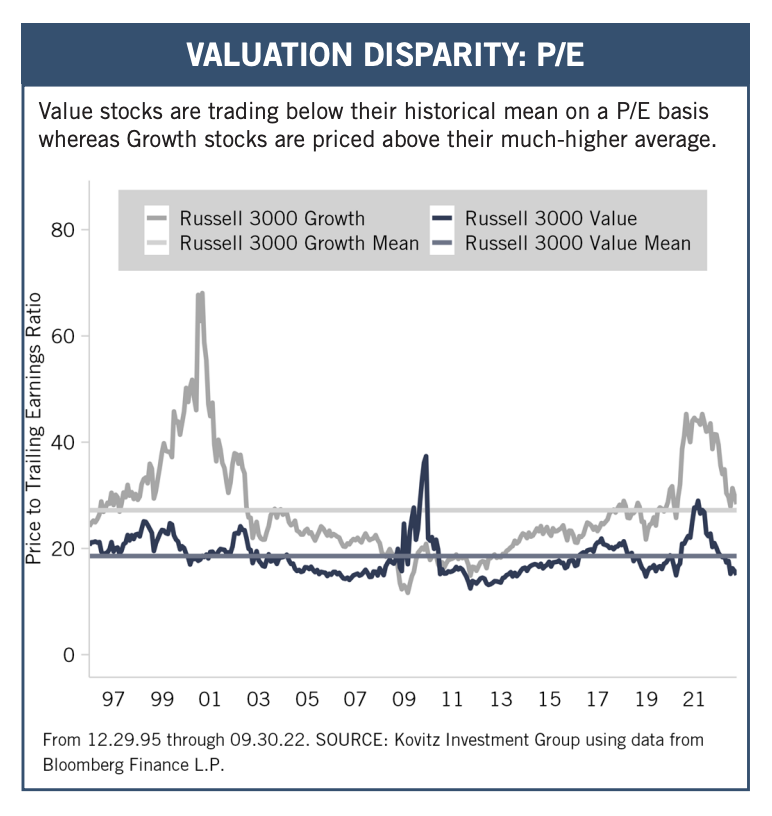
Indeed we think the perspective gained via a longer-term lens is highly valuable. This is especially true for those invested in Value stocks, which have been maligned in recent years. Believe it or not, including this year’s carnage, the Russell 3000 Value and S&P 500 Value indexes since Q3 2012 had gained 9.1% and 9.6% PER ANNUM, a terrific 10-year annualized return (in dollar terms) relative to stocks around the world, not to mention bonds, commodities and U.S. Treasuries. The modest three- and five-year return numbers also are decent, especially versus fixed income, while the two-decade annualized figures not-too-far from 9% are very good.
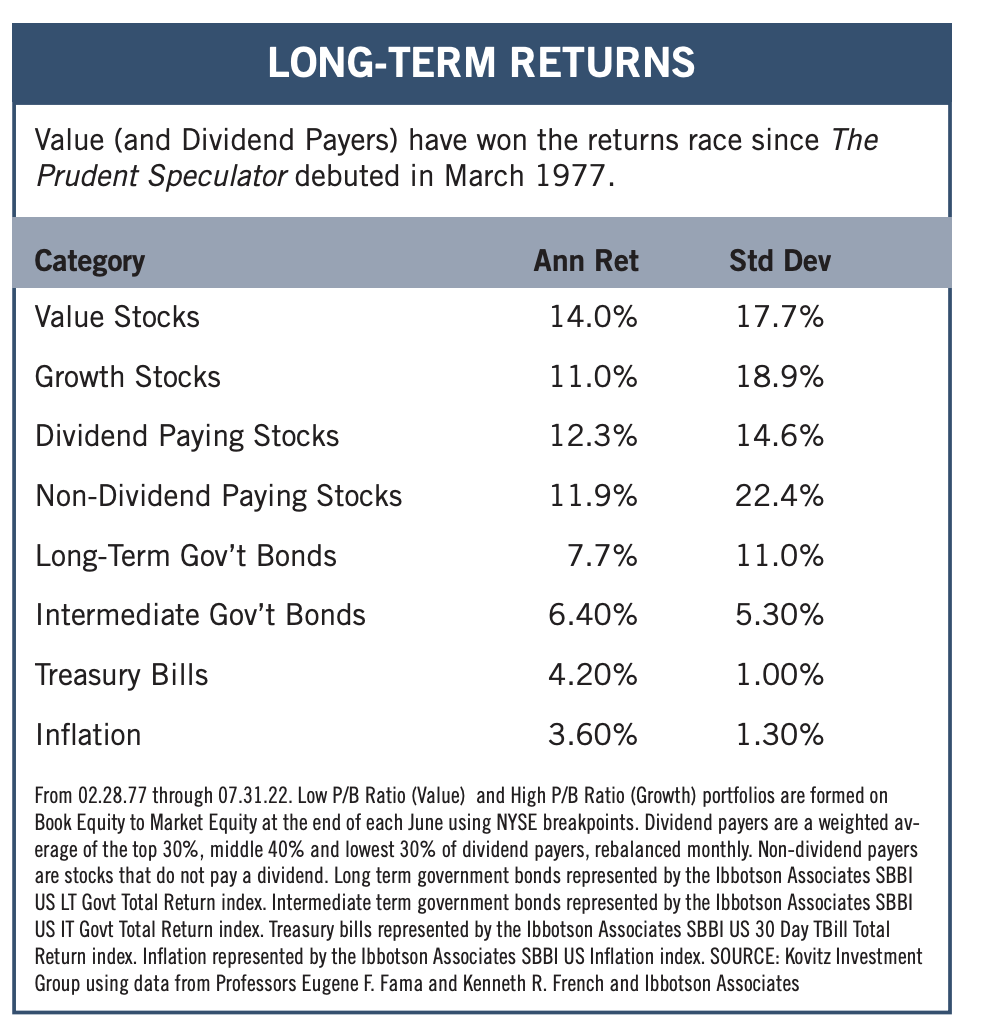
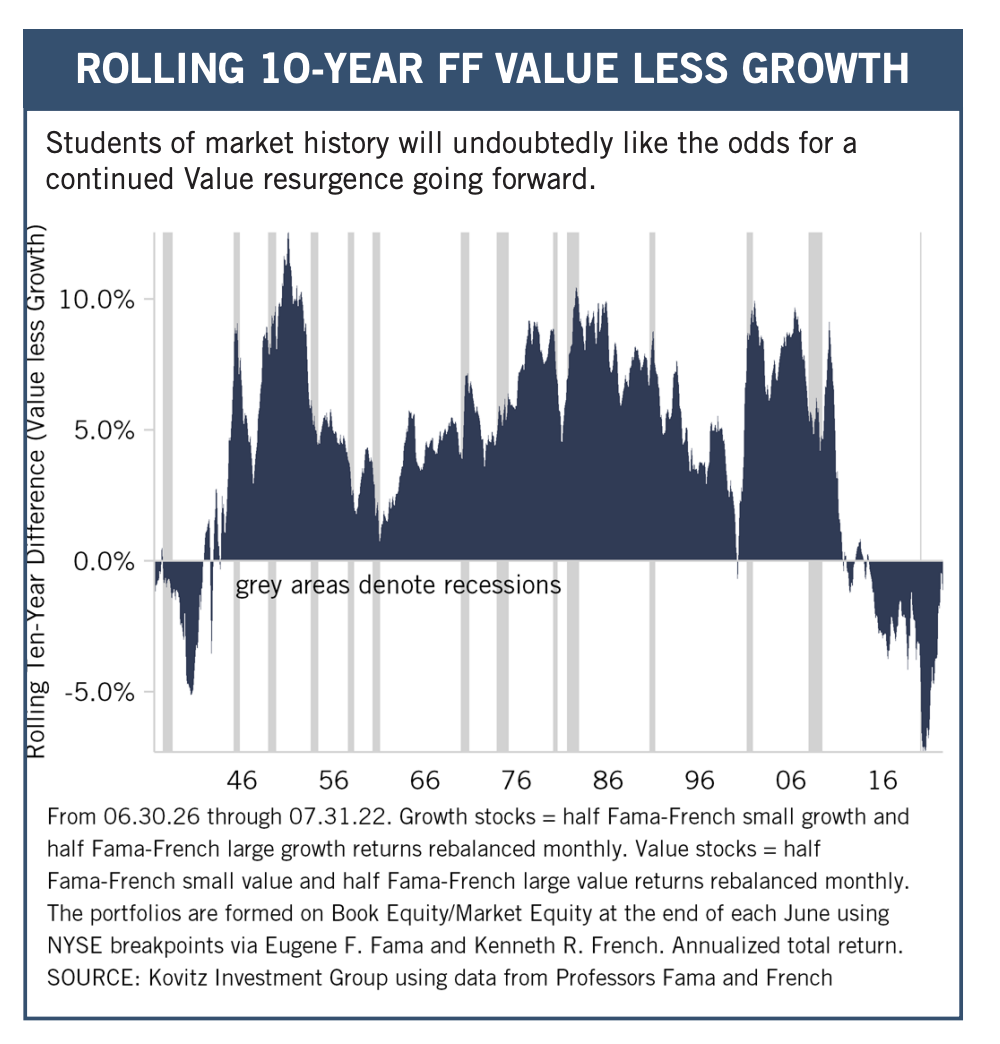
True, all of those Value returns trail the historical 14.0% annual return for the Fama-French Value series dating back to the launch of The Prudent Speculator some 45 years ago, but in our view this bodes well for stocks like those we have long championed going forward. Happily, Value also has been rapidly closing the 10-year performance gap with Growth, while the former is much less expensively valued versus its historical norms today.
Recommended Stock List
In this space, we list all of the stocks we own across our multi-cap-value managed account strategies and in our four newsletter portfolios. See the last page for pertinent information on our flagship TPS strategy, which has been in existence since the launch of The Prudent Speculator in March 1977.
Readers are likely aware that TPS has long been monitored by The Hulbert Financial Digest (“Hulbert”). As industry watchdog Mark Hulbert states, “Hulbert was founded in 1980 with the goal of tracking investment advisory newsletters. Ever since it has been the premiere source of objective and independent performance ratings for the industry.” For info on the newsletters tracked by Hulbert, visit: http://hulbertratings.com/since-inception/
Keeping in mind that all stocks are rated as “Buys” until such time as we issue an official Sales Alert, we believe that all of the companies in the tables on these pages trade for significant discounts to our determination of longterm fair value and/or offer favorable risk/reward profiles. Note that, while we always seek substantial capital gains, we require lower appreciation potential for stocks that we deem to have more stable earnings streams, more diversified businesses and stronger balance sheets. The natural corollary is that riskier companies must offer far greater upside to warrant a recommendation. Further, as total return is how performance is ultimately judged, we explicitly factor dividend payments into our analytical work.
While we always like to state that we like all of our children equally, meaning that we would be fine in purchasing any of the 100+ stocks, we remind subscribers that we very much advocate broad portfolio diversification with TPS Portfolio holding more than eighty of these companies. Of course, we respect that some folks may prefer a more concentrated portfolio, however our minimum comfort level in terms of number of overall holdings in a broadly diversified portfolio is at least thirty!
TPS rankings and performance are derived from hypothetical transactions “entered” by Hulbert based on recommendations provided within TPS, and according to Hulbert’s own procedures, irrespective of specific prices shown within TPS, where applicable. Such performance does not reflect the actual experience of any TPS subscriber. Hulbert applies a hypothetical commission to all “transactions” based on an average rate that is charged by the largest discount brokers in the U.S., and which rate is solely determined by Hulbert. Hulbert’s performance calculations do not incorporate the effects of taxes, fees, or other expenses. TPS pays an annual fee to be monitored and ranked by Hulbert. With respect to “since inception” performance, Hulbert has compared TPS to 19 other newsletters across 62 strategies (as of the date of this publication). Past performance is not an indication of future results. For additional information about Hulbert’s methodology, visit: http://hulbertratings.com/methodology/.

Portfolio Builder
Each month in this column, we highlight 10 stocks with which readers might populate their portfolios: Blackrock (BLK), Micron Tech (MU), TotalEnergies SE (TTE) and seven others.