Preview of September 2022 Newsletter
Editor’s Note
“Mr. Market is there to serve you, not to guide you. It is his pocketbook, not his wisdom, that you will find useful.” — Benjamin Graham
Though we have long known he has had “incurable emotional problems,” Benjamin Graham’s Mr. Market has been particularly moody of late. After a superb bounce in stock prices in July, following an ugly first half of ‘22, the equity rebound continued over the first half of August, with spirits boosted by solid Q2 corporate profits, relatively healthy economic stats and better-than-expected readings on inflation.
Incredibly, that move higher (a 17% jump in the S&P 500 from the June 16 low) culminated with the American Association of Individual Investors (AAII) proclaiming as of August 17: “Optimism among individual investors about the short-term direction of the stock market is at its highest level of the year.” Alas, that enthusiasm, such as it was (the number of Bulls was only 33.3% versus Bears of 37.2%), illustrated why so many think the AAII Sentiment gauge is a contrarian indicator, as equities immediately began a skid that has seen the S&P 500 stumble nearly 9% in 13 days. Happily, there is a silver lining as the number of Bulls has now plunged to 21.9% and the Bears have leapt to 50.4%, the -28.5% BullBear Spread one of the most pessimistic in history.
Not sure why folks feel better about future prospects when stock prices are higher than when they are lower, but many seem to forget that they have ownership in companies, most of which produce profits and many of which pay dividends. Of course, as Mr. Graham says, “Even though businesses have economic characteristics that are stable, Mr. Market’s [stock price] quotations will be anything but,” so the obvious question is what changed over the last couple of weeks to turn Mr. Market from euphoric to depressed?
In our view, not much is different on the economic front as data on the whole has remained OK, with better-than-expected numbers on Q2 GDP, core PCE inflation, retail sales ex. vehicles and gasoline, ISM Manufacturing, consumer confidence and jobless claims. True, housing statistics have weakened considerably, the Leading Economic Indicators index was negative and the unemployment rate for August ticked up to 3.7%, but there were 315,000 new payrolls created last month and the odds of recession have stayed the same for a while now.
What has changed is tougher talk on inflation from the Federal Reserve, with Jerome H. Powell warning in Jackson Hole, “While higher interest rates, slower growth, and softer labor market conditions will bring down inflation, they will also bring some pain to households and businesses.” Nothing the Chair said at that Wyoming speech should have been overly surprising, and the forecast for Fed Funds rate hikes rose only modestly, as most realize that Powell & Co. will always be data dependent, but the use of the word “pain” was not well received
This was especially true as Mr. Powell also saw fit to mention Paul Volcker, the Fed Chair who was able to finally vanquish the Great Inflation of the late-1960s and 1970s, but not without triggering two U.S. economic contractions in 1980 and 1981. Sounds ominous, we suppose, but those who bother to look at how equities performed during the Volcker years might be astounded to learn that Value stocks soared 24.7% per annum from the start of 1979 to the end of 1986, while Dividend Payers gained an annualized 18.7%. And the Fed Funds rate ended 1986 at 6.0%, a tad bit higher than today’s 2.5% level.
To be sure, this time (and every other) is different, while there is a ton of turmoil on the geopolitical stage, so we are not arguing that caution be thrown to the wind. However, we continue to believe that equities, especially Value, are a good hedge against inflation, while we are not unhappy to see folks again focusing on financial fundamentals with so-called meme and other richly valued stocks coming down to earth. Yes, enduring short-term pain isn’t much fun, but undervalued stocks have held up better of late AND provided plenty of long-term gain.
Earnings Scorecard
Q2 Earnings
Given that real (inflation-adjusted) U.S. GDP growth slumped by 0.6% in Q2, on top of a 1.6% decline in the first quarter, revenue and net income numbers from Corporate America held up well, even as management teams engaged in their usual tempering of guidance. Impressively, the number of S&P 500 companies that exceeded bottom-line forecasts was 75.1%, much better than the usual “beat” rate, while 62.7% eclipsed top-line projections. Of The Prudent Speculator’s 97 stocks presented in our Earnings Scorecard, a solid 68.0% topped EPS expectations, while the average one-day price reaction was a gain of 0.5%, despite several big setbacks.
Standard & Poor’s projects (as of 08.31.22) that after jumping from $122.37 in 2020 to $208.21 in 2021, bottom-up operating EPS for the S&P 500 will inch up to $209.99 this year (the figure includes a massive $66.9 billion ($4.74 per share) “unrealized investment” loss from Berkshire Hathaway in Q2) and to $240.66 in 2023. Estimates are subject to change (current forecasts are lower than those three months ago) and much will depend on the health of the U.S. and global economies, but anything close to those tallies should support much higher stock prices.
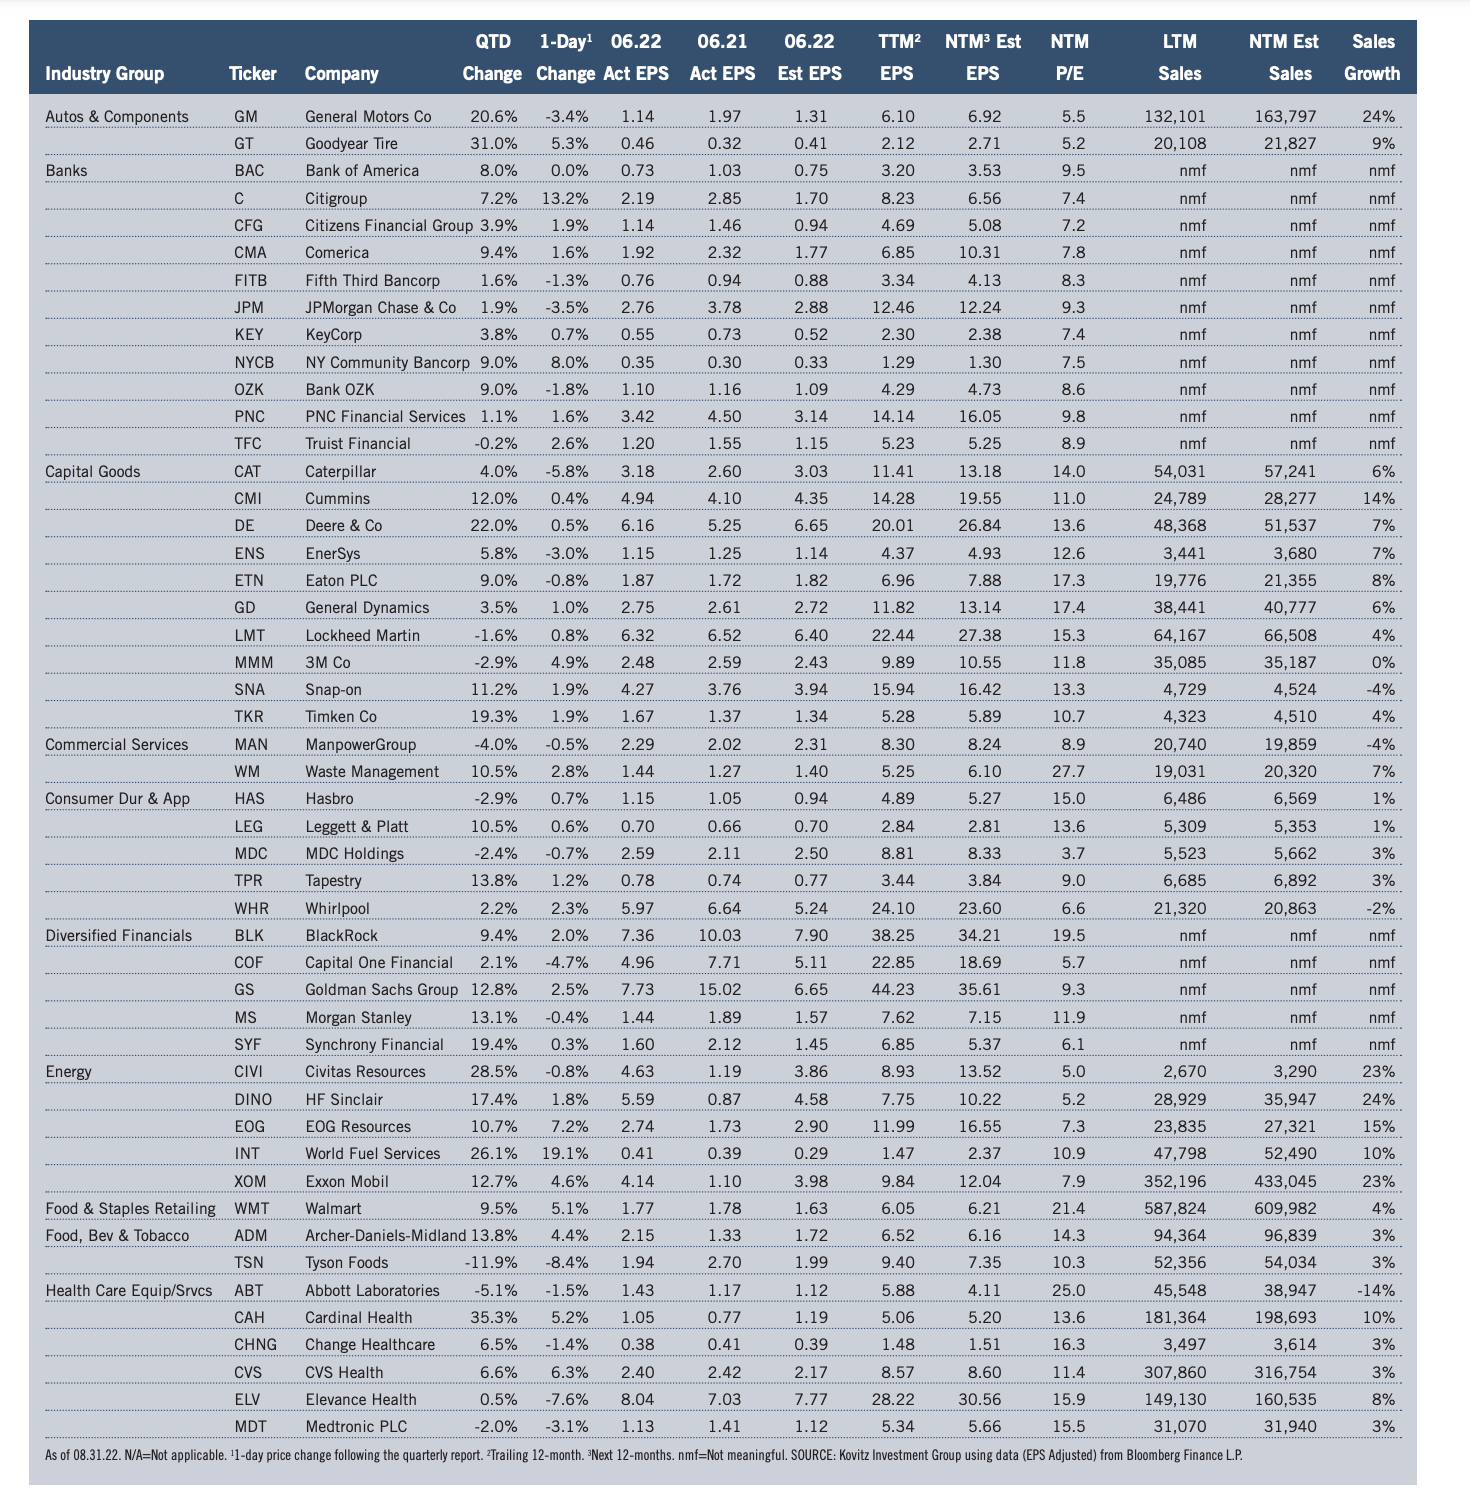
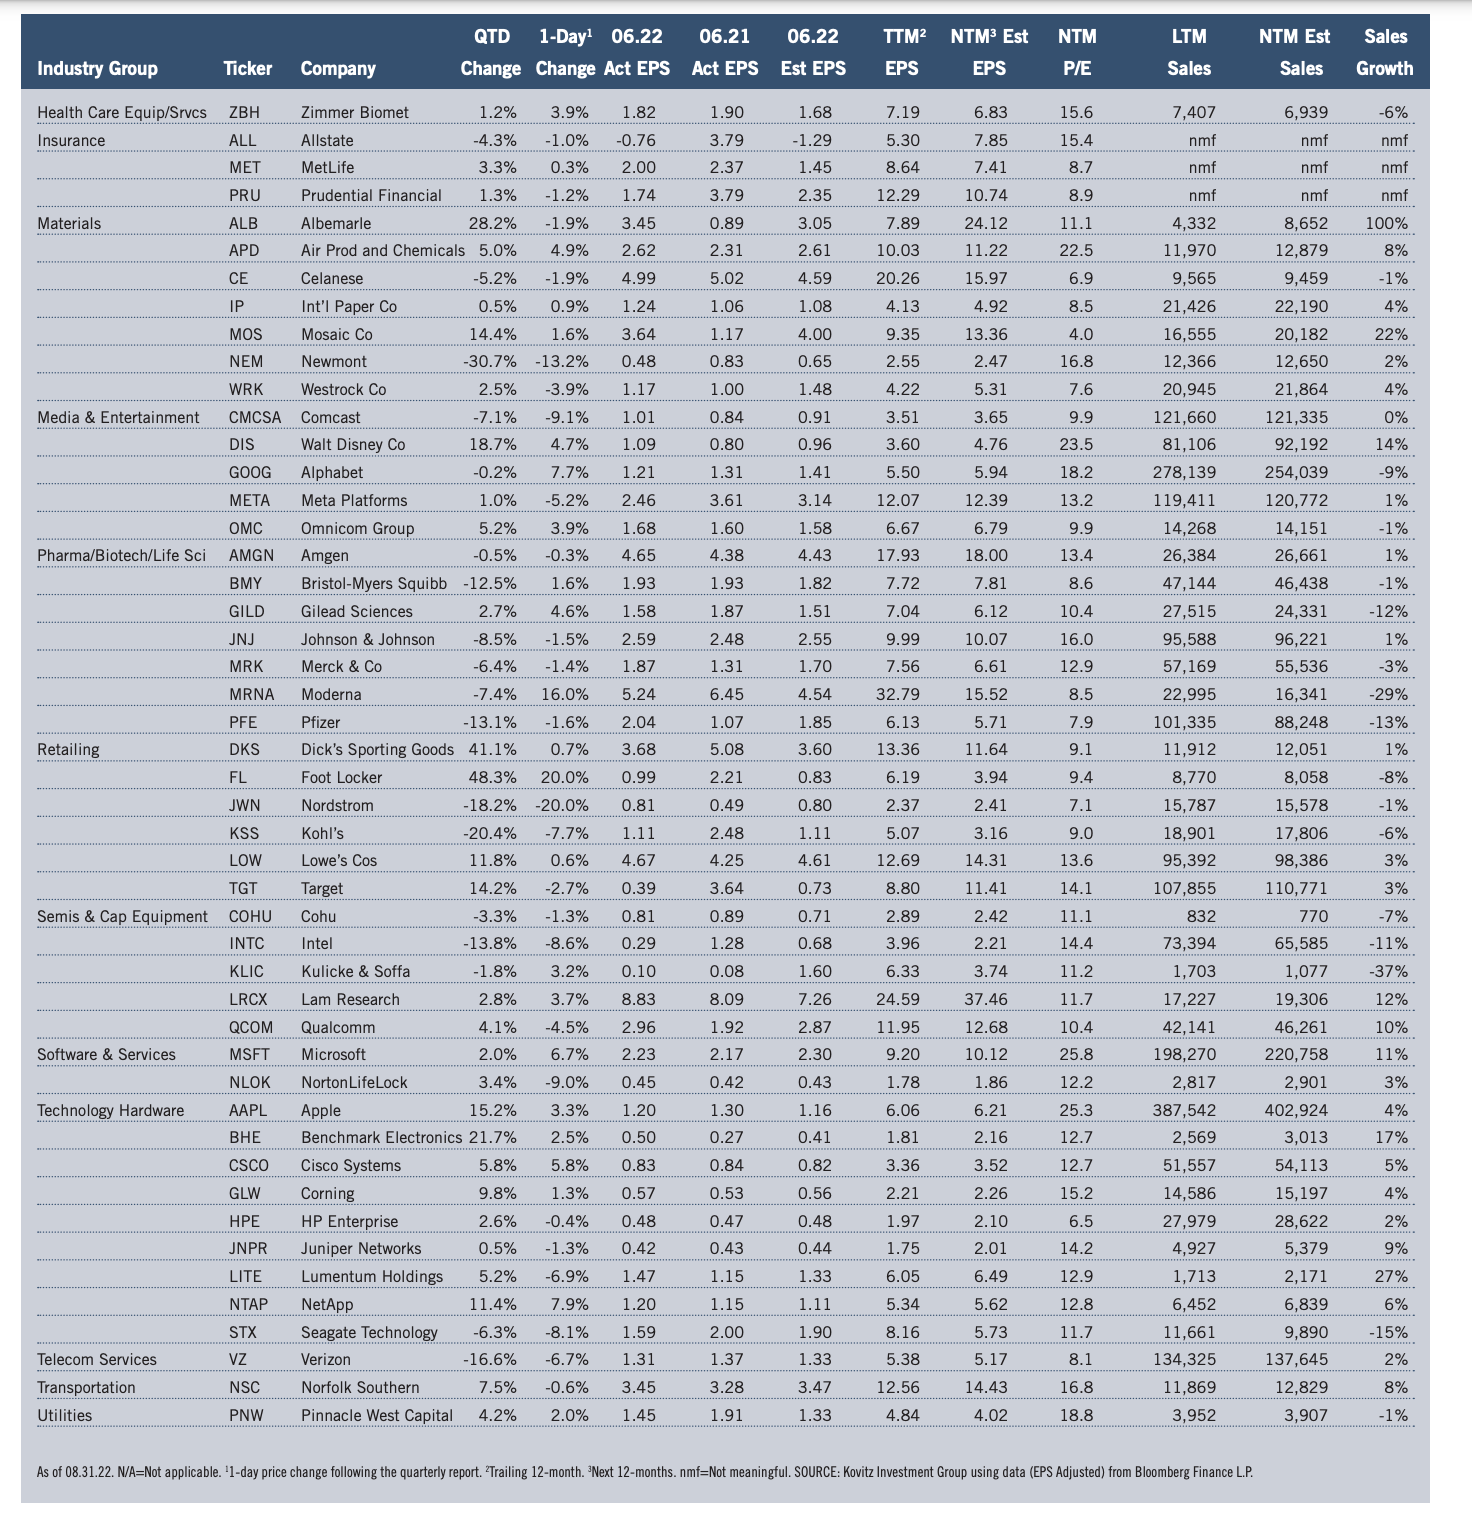
Recommended Stock List
In this space, we list all of the stocks we own across our multi-cap-value managed account strategies and in our four newsletter portfolios. See the last page for pertinent information on our flagship TPS strategy, which has been in existence since the launch of The Prudent Speculator in March 1977.
Readers are likely aware that TPS has long been monitored by The Hulbert Financial Digest (“Hulbert”). As industry watchdog Mark Hulbert states, “Hulbert was founded in 1980 with the goal of tracking investment advisory newsletters. Ever since it has been the premiere source of objective and independent performance ratings for the industry.” For info on the newsletters tracked by Hulbert, visit: http://hulbertratings.com/since-inception/
Keeping in mind that all stocks are rated as “Buys” until such time as we issue an official Sales Alert, we believe that all of the companies in the tables on these pages trade for significant discounts to our determination of longterm fair value and/or offer favorable risk/reward profiles. Note that, while we always seek substantial capital gains, we require lower appreciation potential for stocks that we deem to have more stable earnings streams, more diversified businesses and stronger balance sheets. The natural corollary is that riskier companies must offer far greater upside to warrant a recommendation. Further, as total return is how performance is ultimately judged, we explicitly factor dividend payments into our analytical work.
While we always like to state that we like all of our children equally, meaning that we would be fine in purchasing any of the 100+ stocks, we remind subscribers that we very much advocate broad portfolio diversification with TPS Portfolio holding more than eighty of these companies. Of course, we respect that some folks may prefer a more concentrated portfolio, however our minimum comfort level in terms of number of overall holdings in a broadly diversified portfolio is at least thirty!
TPS rankings and performance are derived from hypothetical transactions “entered” by Hulbert based on recommendations provided within TPS, and according to Hulbert’s own procedures, irrespective of specific prices shown within TPS, where applicable. Such performance does not reflect the actual experience of any TPS subscriber. Hulbert applies a hypothetical commission to all “transactions” based on an average rate that is charged by the largest discount brokers in the U.S., and which rate is solely determined by Hulbert. Hulbert’s performance calculations do not incorporate the effects of taxes, fees, or other expenses. TPS pays an annual fee to be monitored and ranked by Hulbert. With respect to “since inception” performance, Hulbert has compared TPS to 19 other newsletters across 62 strategies (as of the date of this publication). Past performance is not an indication of future results. For additional information about Hulbert’s methodology, visit: http://hulbertratings.com/methodology/.

Portfolio Builder
Each month in this column, we highlight 10 stocks with which readers might populate their portfolios: Walt Disney (DIS), Elevance Health (ELV), Kohl’s (KSS) and seven others.