Every month, The Prudent Speculator produces a newsletter that includes a market summary, helpful charts and graphs, recent equity market news, economic outlook and specific stock investment strategies focused on value stock investing. In this month’s Newsletter, we discuss the equity market headwinds, value stocks vs. growth stocks, dividend stocks Dow Jones, Russell 3000 Value and more. We also include a preview of our current Recommended Stock List and Portfolio Builder section with ten highlighted stocks. Note that the entire list is available to our community of loyal subscribers only.

Editor’s Note: Equity Market Headwinds, Seasonality and Index Component Contributions to Return and more Economic News
“There may be another small one, but this pretty much resolves them all. This part of the crisis is over.” — Jamie Dimon
The ink had barely dried on Uncle Sam’s seizure of First Republic Bank (FRC) and hasty weekend sale of the troubled lender’s $173 billion in loans and $30 billion of securities to JPMorgan Chase (JPM – $138.92), which also assumed $92 billion in deposits. After arguably (bank stocks skidded on May 2) helping put an end to the runs on regional banks by flighty depositors ($100 billion was withdrawn from FRC in Q1), Treasury Secretary Janet Yellen was quick to warn, “After reviewing recent federal tax receipts, our best estimate is that we will be unable to continue to satisfy all of the government’s obligations by early June, and potentially as early as June 1, if Congress does not raise or suspend the debt limit before that time.”
If it isn’t one thing, it is another! Indeed, the list of investor concerns these days is long. After all, Jerome H. Powell & Co. are likely to boost interest rates by an additional 25 basis points this month as the Fed’s preferred measure of inflation, the core Personal Consumption Expenditures index, rose 4.6% in March. And the odds of recession in the next 12 months, as calculated by Bloomberg, stand at 65% as the ISM Manufacturing index for April came in at 47.1, signaling a contraction in the factory sector. The Leading Economic index also fell 1.2% in March, prompting the keeper of the gauge to proclaim, “The Conference Board forecasts that economic weakness will intensify and spread more widely throughout the U.S. economy over the coming months, leading to a recession starting in mid-2023.”
Of course, there always seems to be something about which to fret, yet equities have long climbed a Wall of Worry. As Warren Buffett stated, “In the 20th century, the United States endured two world wars and other traumatic and expensive military conflicts; the Depression; a dozen or so recessions and financial panics; oil shocks; a flu epidemic; and the resignation of a disgraced president. Yet the Dow rose from 66 to 11,497.”
Channeling the Oracle of Omaha, we might add, “In the 21st century, the United States has endured 9/11, the Iraq War, the Great Financial Crisis, the downgrade of the U.S. credit rating and the COVID-19 pandemic, not to mention plenty of drama on the geopolitical stage, yet the Dow has risen from 11,497 to over 33,000 today.”
By no means are we suggesting that there is nothing to fear for equity market participants, especially as 10% corrections happen every 11 months, on average, and 20% Bear Markets occur every 3.4 years. However, despite all of the headwinds through the years, Value stocks, like those that we have long championed, have enjoyed returns of more than 13% per annum since 1927. Alas, few were able to achieve those returns as many forget that the secret to success in stocks is not to get scared out of them.
We realize that fear is a far more powerful emotion than greed, so we do our best to keep folks on track to reach their multi-year investment objectives by constantly showing that consternations like high inflation, elevated interest rates and even recessions are not cause for those who share our long-term time horizon to bail out of equities. After all, the reason that stocks have performed so well over time is that the economy grows (U.S. GDP was $9.9 trillion in 1999 vs. $26.5 trillion today) and companies generally become more valuable. In fact, operating EPS for the S&P 500 has risen from $46.77 in 1999 to more than $190 in 2022. Likewise, dividends for the S&P have grown from $16 per share at the turn of the Millennium to $67 today. A moderate recession like that contemplated by many economists would (temporarily) slow growth down, but S&P itself presently forecasts that EPS for the S&P 500 will rise to $218.06 this year and $244.22 in 2024.
There is plenty of pessimism today (a contrarian positive), but we like that JPM CEO Jamie Dimon, who warned in June of a potential economic hurricane, just tapped his “fortress” balance sheet to shop for bargains at FRC!
Graphic Detail: Value Stocks, Growth Stocks and Dividend Stocks
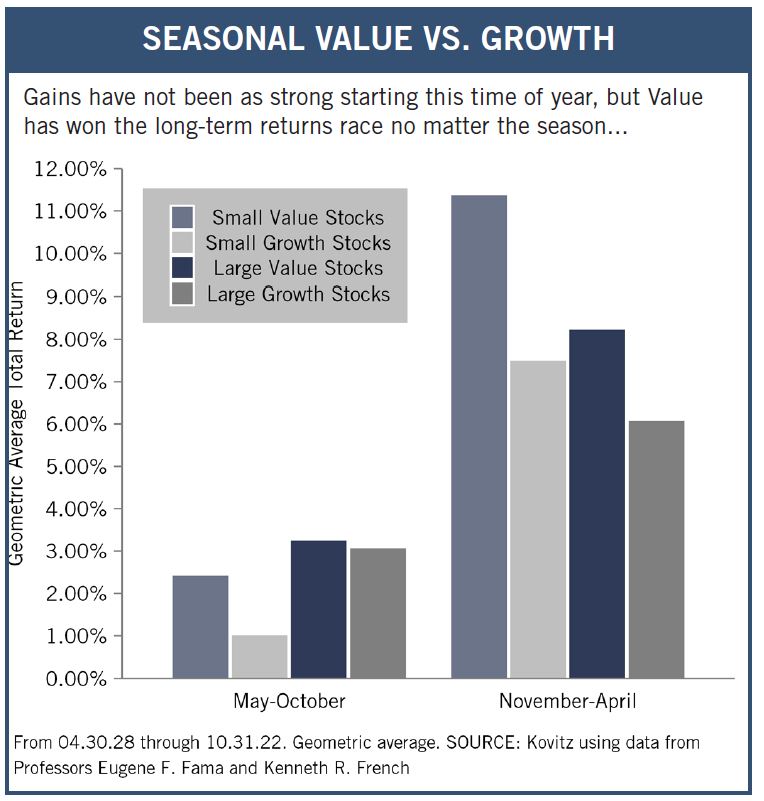
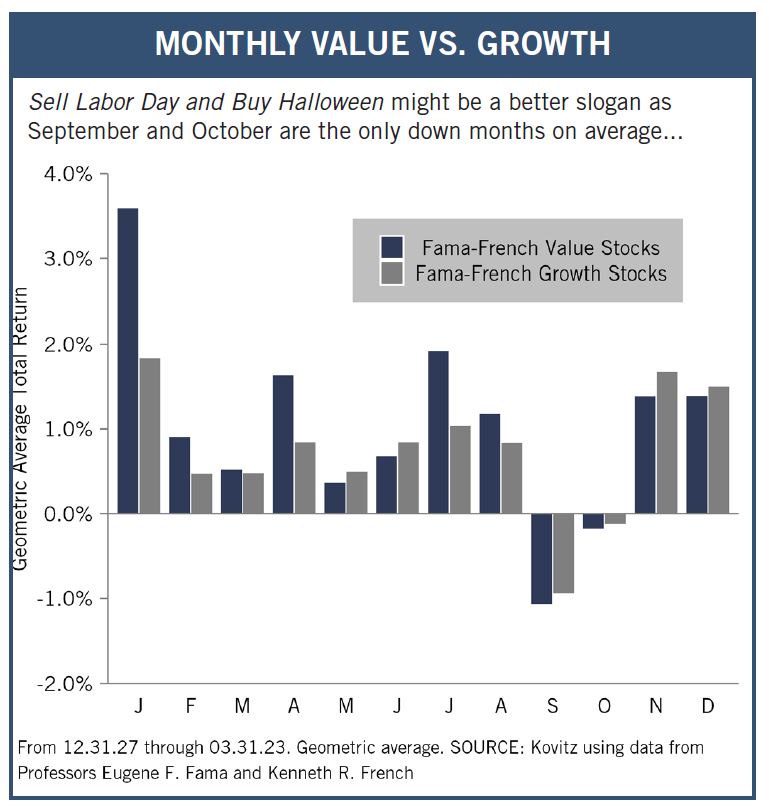
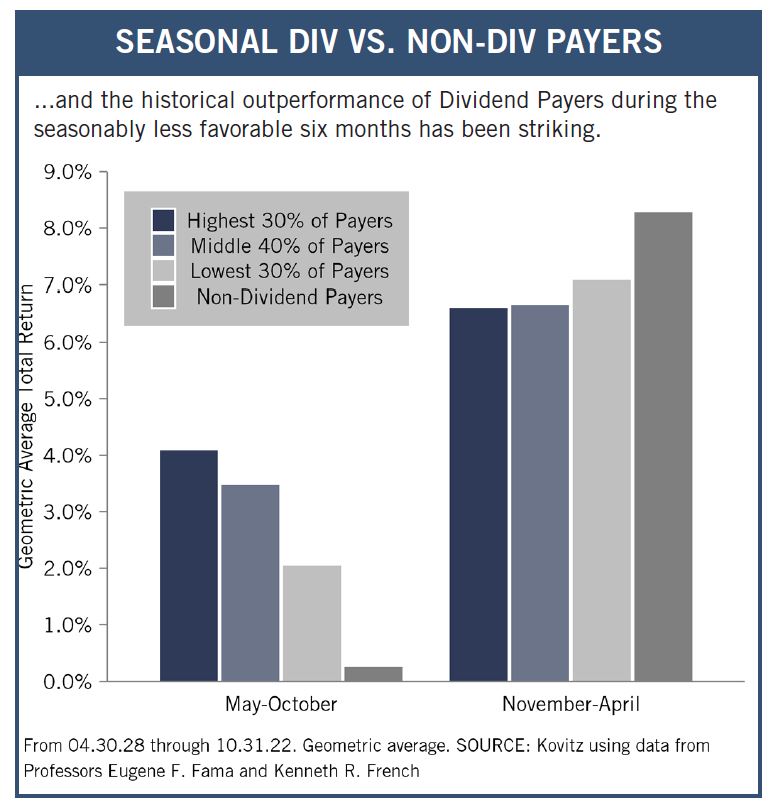
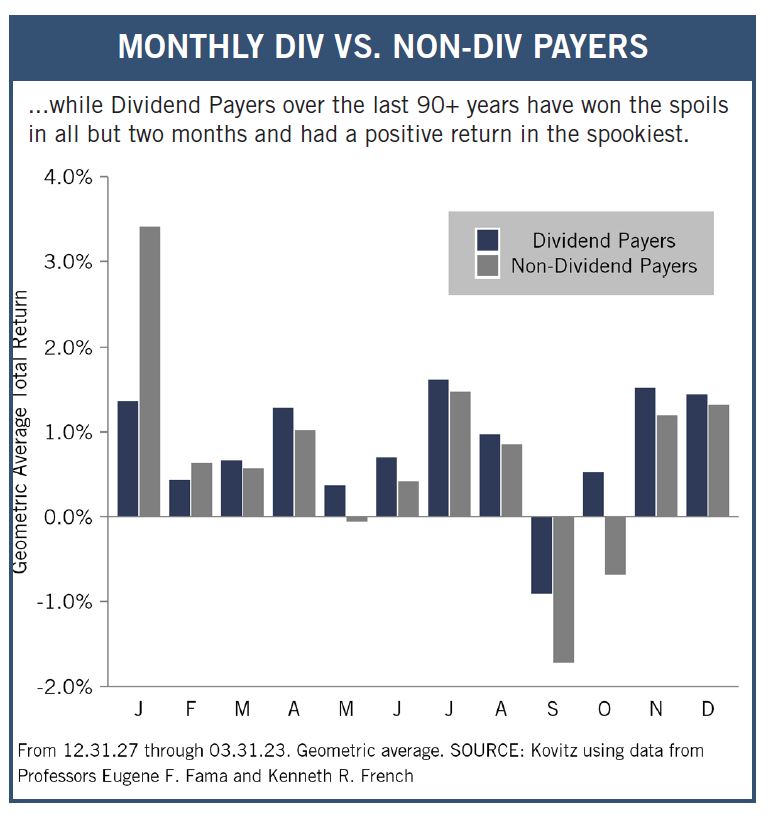
Even as stocks went south in the May 2022 – Oct. 2022 seasonally less favorable period, and generally moved higher in the Nov. 2022 – Apr. 2023 seasonally more favorable time span, we would never want to make major allocation decisions based on the calendar. Of course, that does not stop pundits from warning that folks should Sell in May and Go Away, but the historical data show that Dividend Payers and Value Stocks have enjoyed positive absolute and relative returns, on average, during each of the May to October periods.
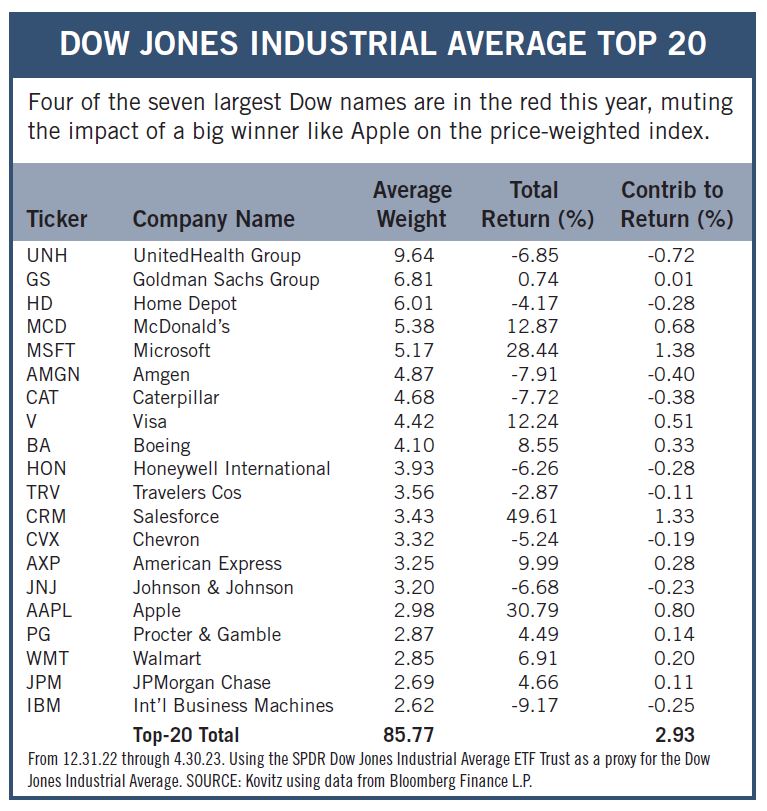
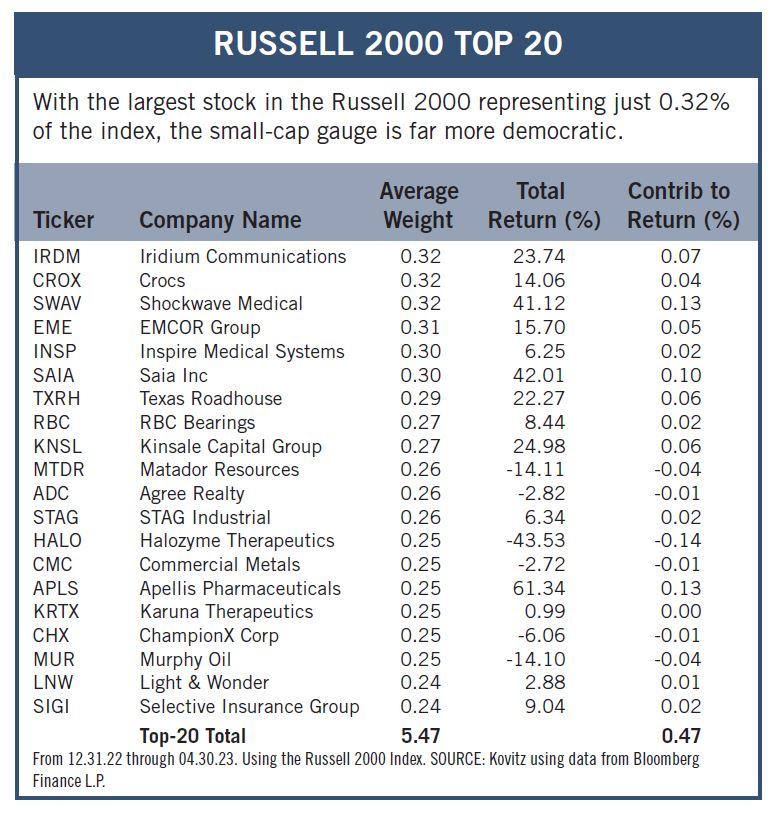
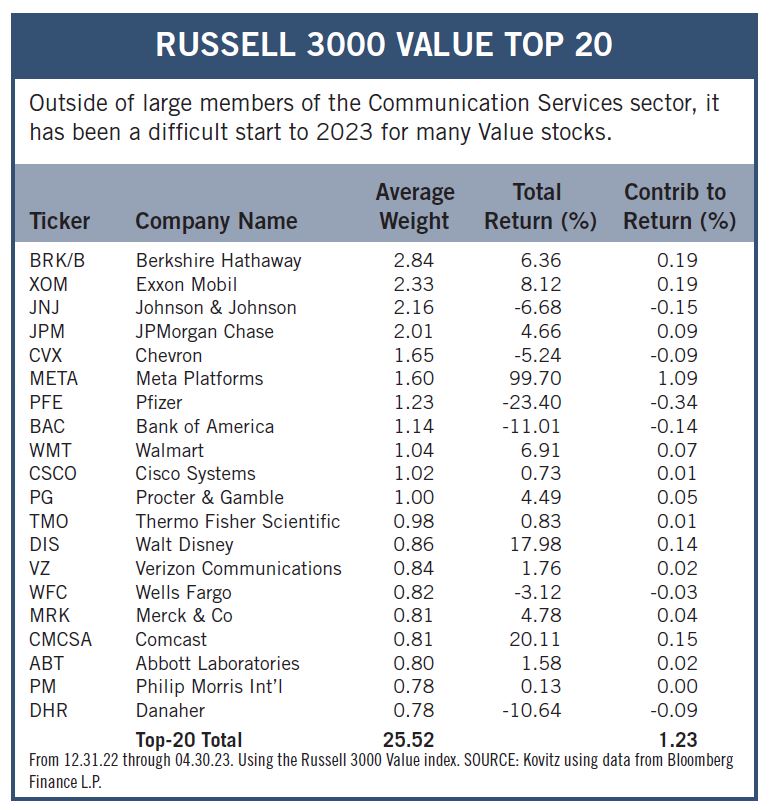
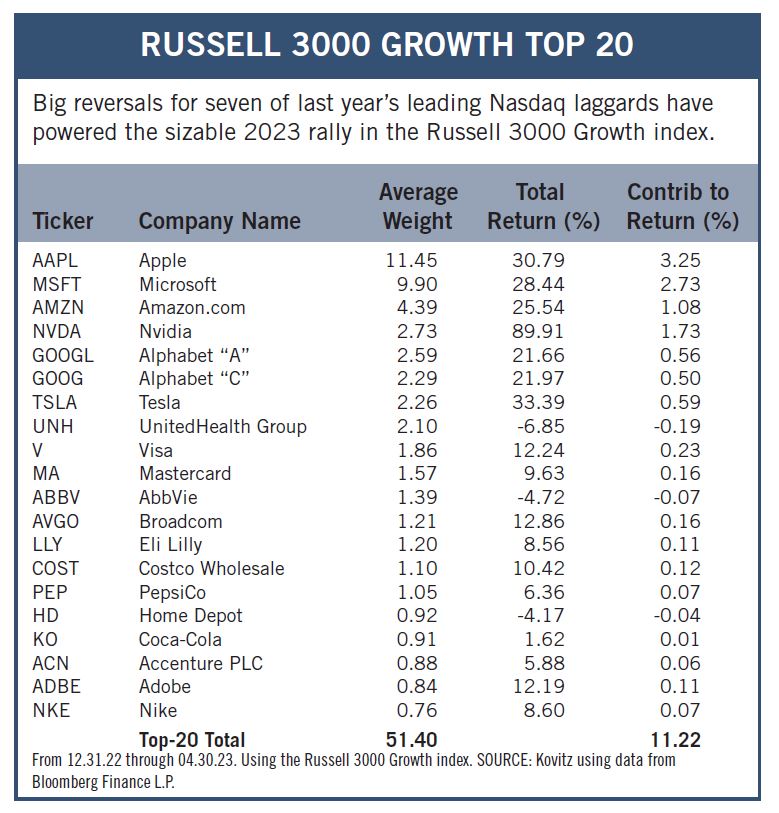
Graphic Detail: Dow Jones, Russell 3000 Value and Growth vs. Russell 2000
Top 20
The proverbial soldiers and generals each performed miserably in 2022, with the average stock in the broad-based Russell 3000 (R3K) losing 19.8%, compared to a decline of 19.2% for the capitalization-weighted index. 2023 has been a different story, however, as the average R3K constituent gained 0.4% over the first four months of the year, versus an 8.3% return for the index. No doubt, many indexes are top-heavy as Apple, Microsoft and Amazon.com account for about the same weight in the R3K Growth index as do the top 20 in the R3K Value index.
Recommended Stock List
In this space, we list all of the stocks we own across our multi-cap-value managed account strategies and in our four newsletter portfolios. See the last page for pertinent information on our flagship TPS strategy, which has been in existence since the launch of The Prudent Speculator in March 1977.
Readers are likely aware that TPS has long been monitored by The Hulbert Financial Digest (“Hulbert”). As industry watchdog Mark Hulbert states, “Hulbert was founded in 1980 with the goal of tracking investment advisory newsletters. Ever since it has been the premiere source of objective and independent performance ratings for the industry.” For info on the newsletters tracked by Hulbert, visit: http://hulbertratings.com/since-inception/.
Keeping in mind that all stocks are rated as “Buys” until such time as we issue an official Sales Alert, we believe that all of the companies in the tables on these pages trade for significant discounts to our determination of long-term fair value and/or offer favorable risk/reward profiles. Note that, while we always seek substantial capital gains, we require lower appreciation potential for stocks that we deem to have more stable earnings streams, more diversified businesses and stronger balance sheets. The natural corollary is that riskier companies must offer far greater upside to warrant a recommendation. Further, as total return is how performance is ultimately judged, we explicitly factor dividend payments into our analytical work.
While we always like to state that we like all of our children equally, meaning that we would be fine in purchasing any of the 100+ stocks, we remind subscribers that we very much advocate broad portfolio diversification with TPS Portfolio holding more than eighty of these companies. Of course, we respect that some folks may prefer a more concentrated portfolio, however our minimum comfort level in terms of number of overall holdings in a broadly diversified portfolio is at least thirty!
TPS rankings and performance are derived from hypothetical transactions “entered” by Hulbert based on recommendations provided within TPS, and according to Hulbert’s own procedures, irrespective of specific prices shown within TPS, where applicable. Such performance does not reflect the actual experience of any TPS subscriber. Hulbert applies a hypothetical commission to all “transactions” based on an average rate that is charged by the largest discount brokers in the U.S., and which rate is solely determined by Hulbert. Hulbert’s performance calculations do not incorporate the effects of taxes, fees, or other expenses. TPS pays an annual fee to be monitored and ranked by Hulbert. With respect to “since inception” performance, Hulbert has compared TPS to 19 other newsletters across 62 strategies (as of the date of this publication). Past performance is not an indication of future results. For additional information about Hulbert’s methodology, visit: http://hulbertratings.com/methodology/.

Portfolio Builder
Each month in this column, we highlight 10 stocks with which readers might populate their portfolios: Fifth Third Bancorp (FITB), Hasbro (HAS), American Tower (AMT) and seven others.