
Every month, The Prudent Speculator produces a newsletter that includes a market summary, helpful charts and graphs, recent equity market news, economic outlook and specific stock investment strategies focused on value stock investing. This month, we offer four brand-new recommendations, while our Graphic Detail provides our annual review of equity valuation factors and returns. In addition, our Editor’s Note offers perspective on the first quarter, in which the S&P 500 briefly entered correction territory. Note that the entire list is available to our community of subscribers only.

Editor’s Note: First Quarter Perspective, Market Corrections, and Volatility
Given that on a total return basis, the Nasdaq Composite Index retreated 10.3% and the S&P 500 skidded 4.3%, it was a tough first quarter for equity investors. True, Value indexes performed much better than Growth, but the average stock in the Russell 3000 tumbled 9.3%, providing another reminder that volatility is a natural part of the investment process.
On average, pullbacks of 5% plus take place three times per year, corrections of 10% or more occur every 11 months and even Bear Markets of 20% or greater happen every 3.4 years. Happily, upswings of 5% or more, rallies of 10% or greater and Bull Markets of 20% have come with similar frequencies. Importantly, the gains from periods in the green have far outweighed the losses from times in the red. As a result, Value Stocks have enjoyed long-term returns of 13.1% per annum, dating back more than nine decades.
That does not mean that selloffs are not scary. But, as JPMorgan Chase CEO Jamie Dimon said back in 2018, when the world was on edge with the threat of Trump 45 tariffs AND the Dow Jones Industrial Average was then in the 25000 range: “We are always prepared for volatility and rapidly moving markets— they should surprise no one. I am a little perplexed when people are surprised by large market moves. Oftentimes, it takes only an unexpected supply/demand imbalance of a few percent and changing sentiment to dramatically move markets…Changing expectations, whether around inflation, growth or recession (yes, there will be another recession—we just don’t know when), supply and demand, sentiment and other factors, can cause drastic volatility.”
To be sure, this time (and every time) is different and though the magnitude of the decline is thus far relatively minor, we did find interesting comments offered by BlackRock Chairman Larry Fink, “I hear it from nearly every client, nearly every leader—nearly every person—I talk to: They’re more anxious about the economy than any time in recent memory. I understand why.”
We respect that there is plenty of confusion today surrounding Trump 47’s tariff policy and its impact on economic growth, inflation and foreign relations, while the polarized political and sensationalized media environment does not help. Uncertainty notwithstanding (the future is never certain), the U.S. economy at year end was on solid footing with 2.4% real (inflation-adjusted) GDP growth in Q4 and the jobs market has been OK in 2025, which makes the level of pessimism that has gripped Main Street puzzling.
Incredibly, the American Association of Individual Investors Sentiment readings during March were on par with or even more Bearish on the outlook for equities than they were when COVID-19 shut down the global economy in March 2020 or at the bottom of the Great Financial Crisis in March 2009. Those seemingly more frightening periods were a great time to buy stocks.
Past performance is no guarantee of future performance, but extreme pessimism has often led to well-above-average equity market returns going forward. Such has often been the case when looking at surveys of consumer confidence and sentiment from the Conference Board and the Univ. of Michigan. The former just hit lows not seen since 2020 and the latter since mid-2022, both also very favorable times to be leaning into stocks.
We suspect the weeks and months ahead will be volatile, as Bloomberg now shows a 30% chance of recession vs. 20% in January, and the latest forecast from the Atlanta Fed for Q1 real U.S. GDP growth sank to -3.7%. However, the Federal Reserve and the OECD are both projecting positive growth for the full year, which should bolster corporate profits. And, with valuations attractive for TPS Portfolio (forward P/E of 13.9 and dividend yield of 2.5%), our long-term optimism remains intact. As Mr. Fink concluded, “We have lived through moments like this before. And somehow, in the long run, we figure things out.”
“A correction is a wonderful opportunity to buy your favorite companies at a bargain price.” — Peter Lynch
Graphic Detail:
Valuation Factors Revisited: Historical Evidence
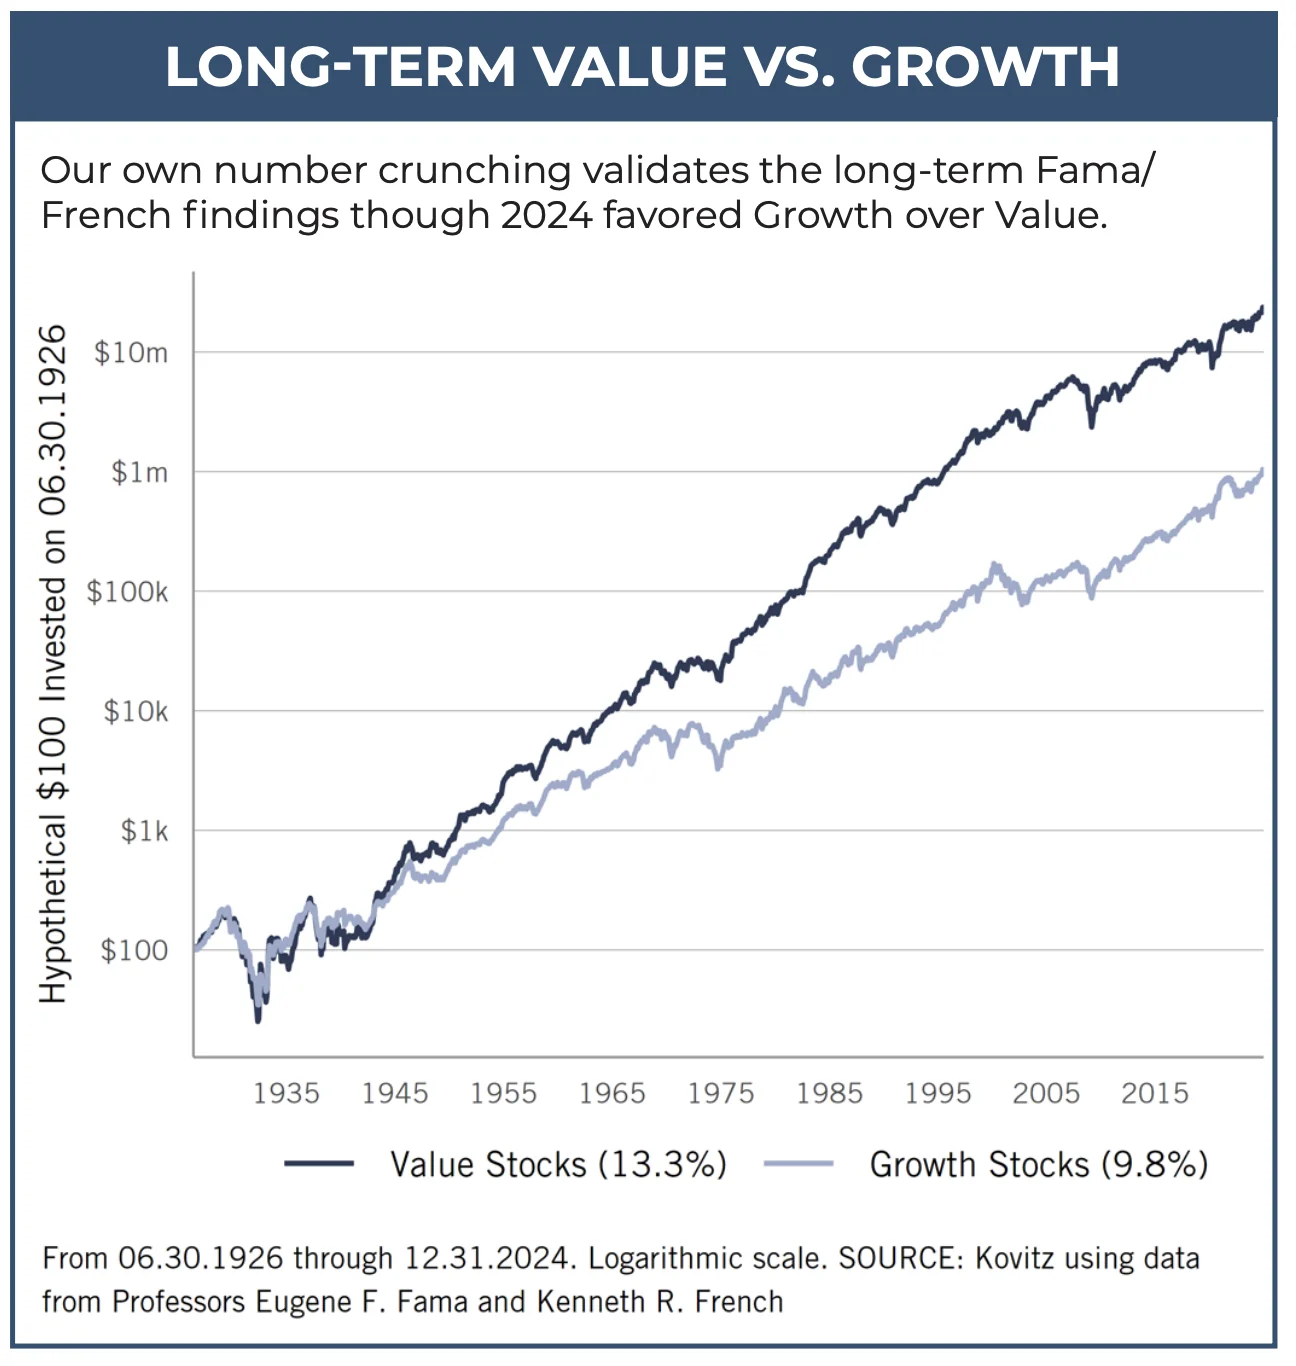
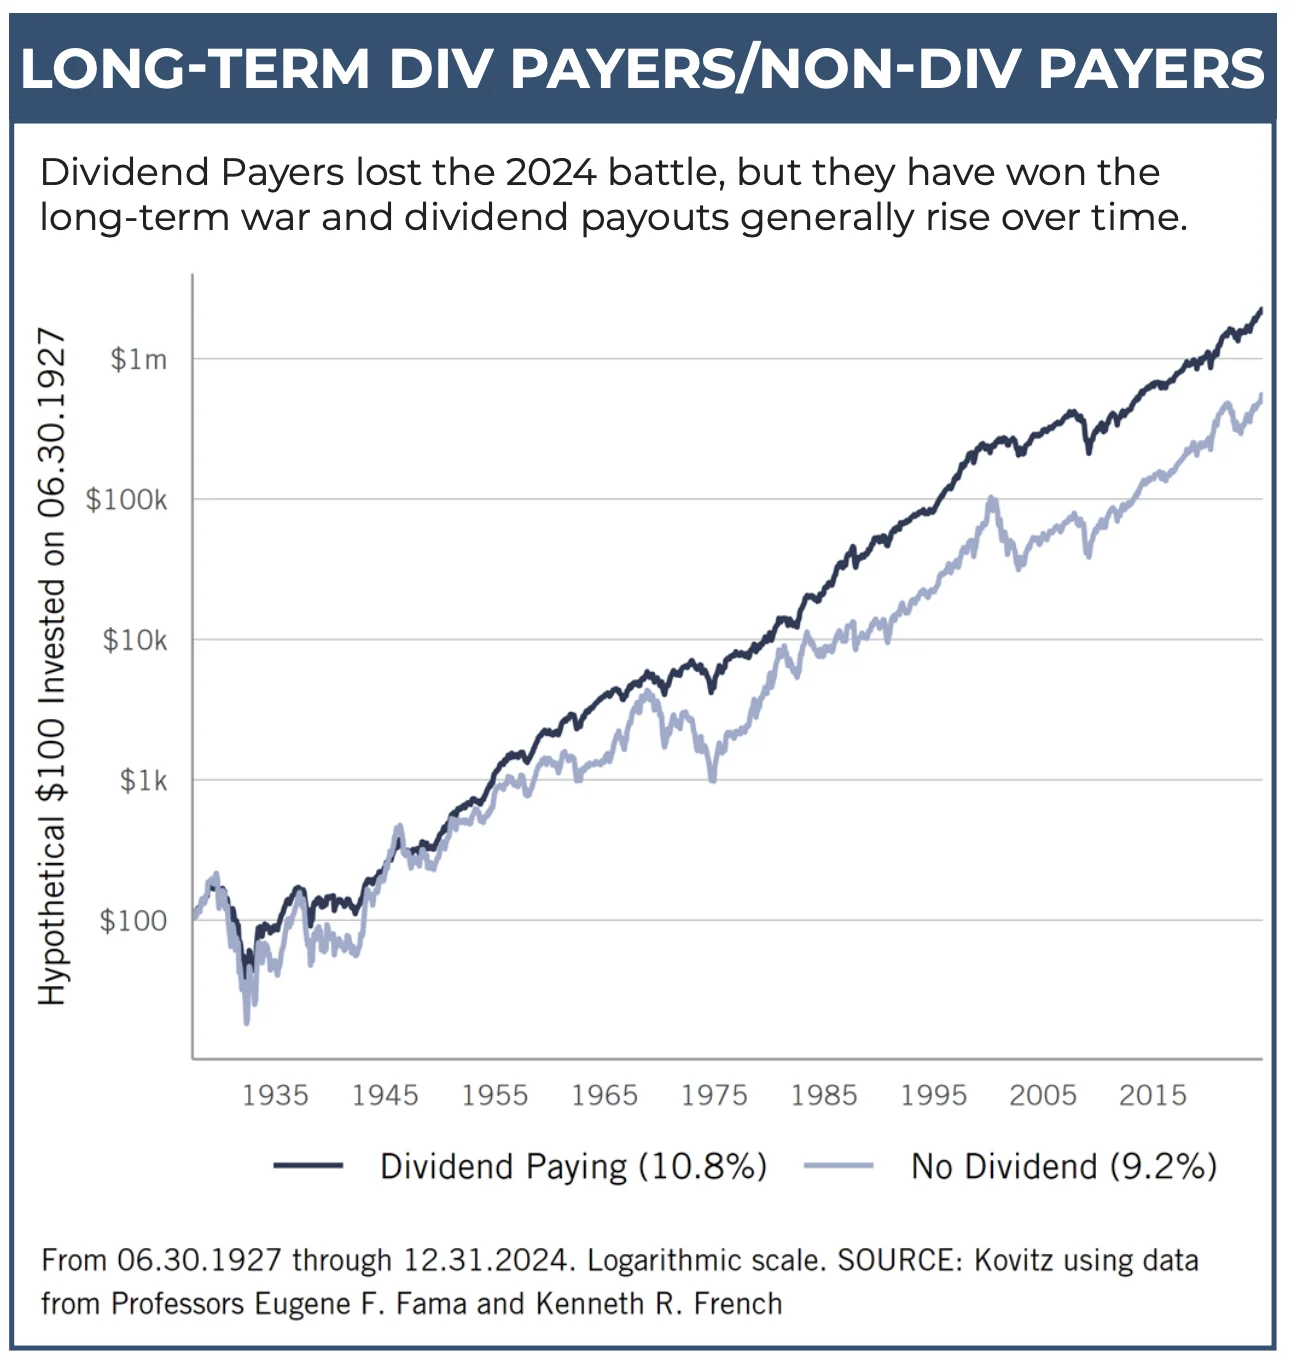
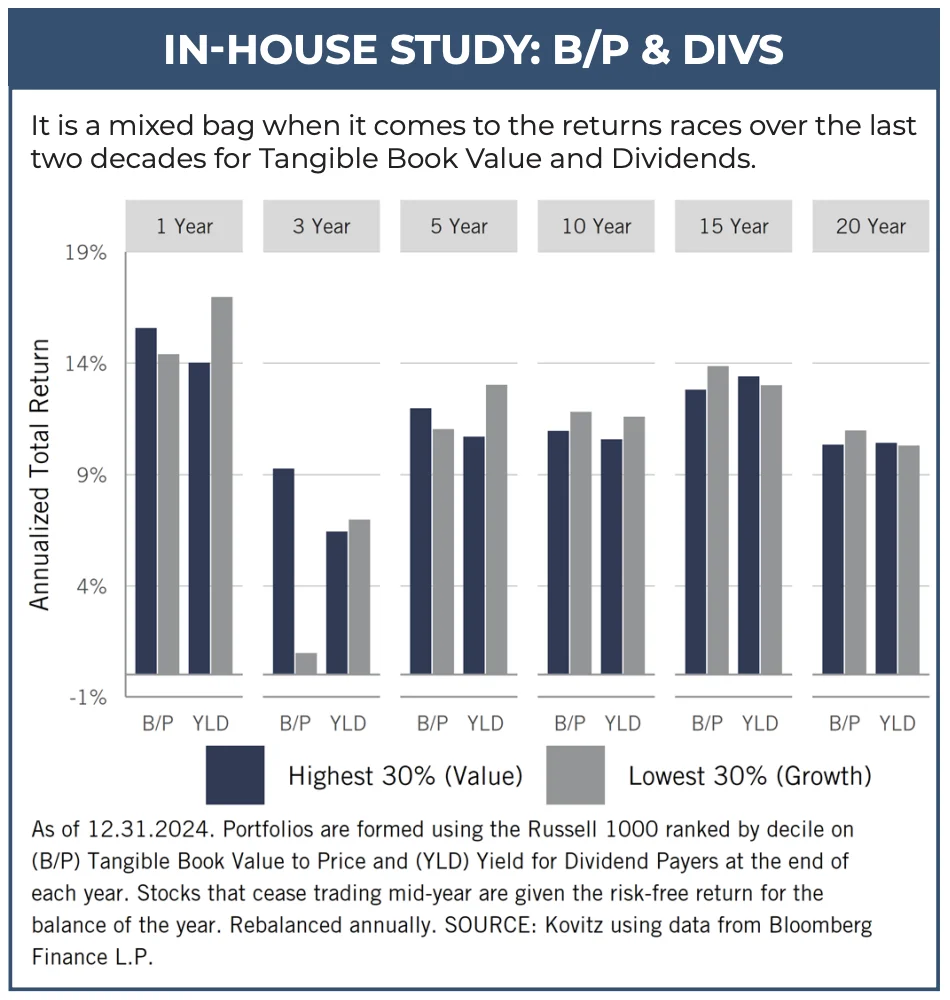
Value stocks, per data from June 1926 through December 2024 compiled by Professors Eugene F. Fama and Kenneth R. French, have topped the long-term performance scorecard versus Growth by a score of 13.1% to 9.7% per annum. And, via a separate data series, the duo has calculated that Dividend-Paying stocks have outperformed Non-Dividend Payers by a per-year tally of 10.8% to 9.2% over a similar time span. Those return gaps are large, especially when one considers the impact of compounding over multi-year periods. It is little wonder, then, given our multi-year time horizon, that we remain loyal to our four-plus-decade-old strategy of buying and harvesting portfolios of what we believe to be undervalued stocks, most often of dividend-paying companies.
While we think that folks would naturally gravitate toward inexpensive stocks, given that most seek bargains in their everyday lives, 2024 was another year in which double-digit percentage returns were available pretty much across the board. True, the average stock in the broad-based Russell 3000 index returned only 10.5% last year, as Small-Caps generally were also-rans in the performance derby, but just about any way they were sliced and diced in our annual factor-based review of the Large-Cap Russell 1000 index for 2024, stocks had solid average returns.
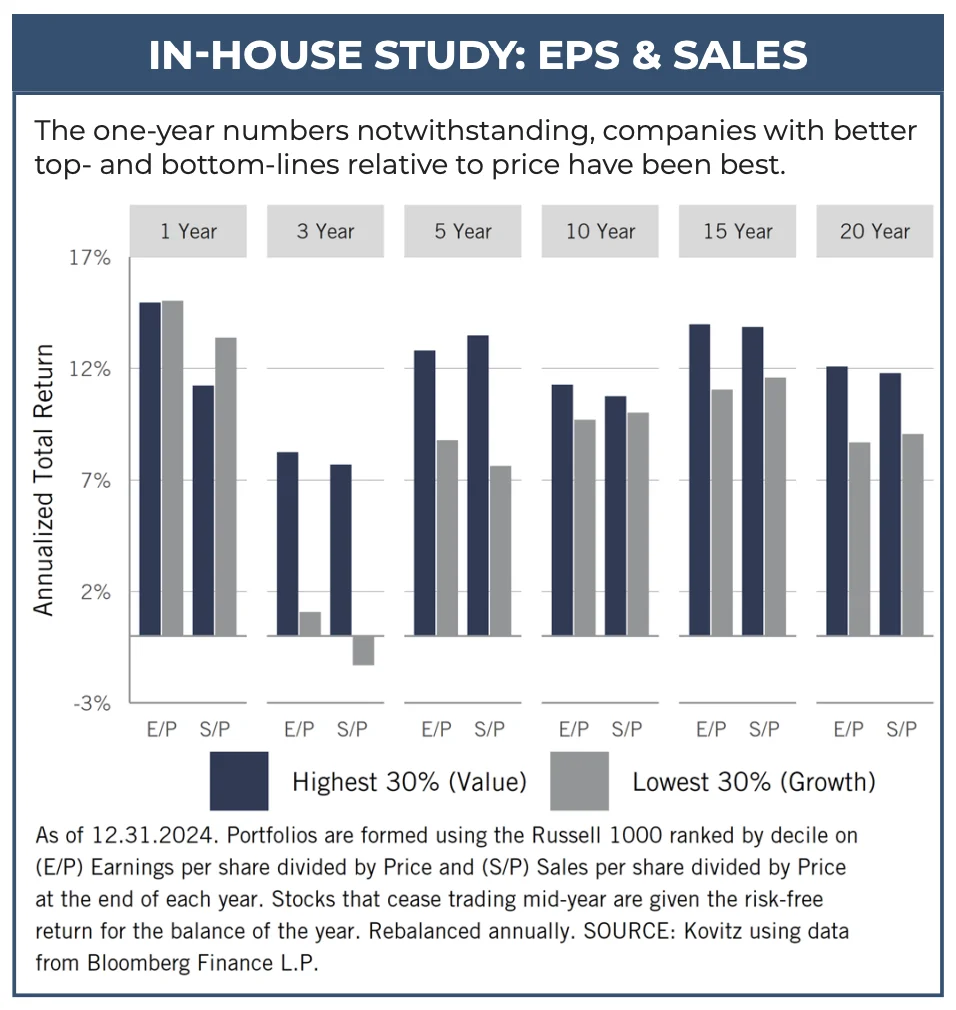
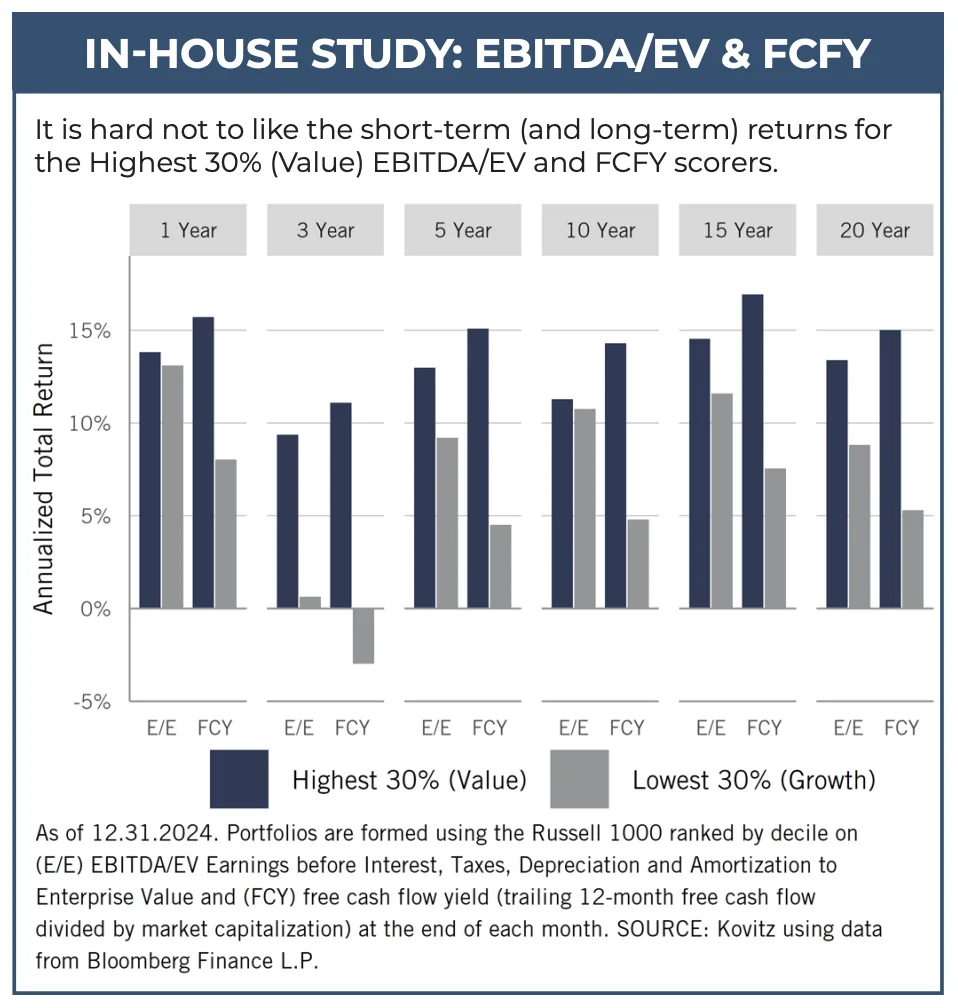
Of course, we concede that stocks with higher dividend yields bucked their historical propensity for outperformance, but less expensively priced stocks generally won more of the returns race. Meanwhile, we offer the reminder that we are not constrained by arbitrary definitions of Value and Growth. Indeed, we hardly think that the traditional price-to-book-value distinction that has long been the academic dividing line tells a complete story, so we are constantly evaluating additional metrics, many of which are displayed in the accompanying charts. As we cast our lines for new investment ideas, our objective is to always be fishing in a pond stocked with companies that exhibit characteristics of those that have proven over time to be better long-term performers.
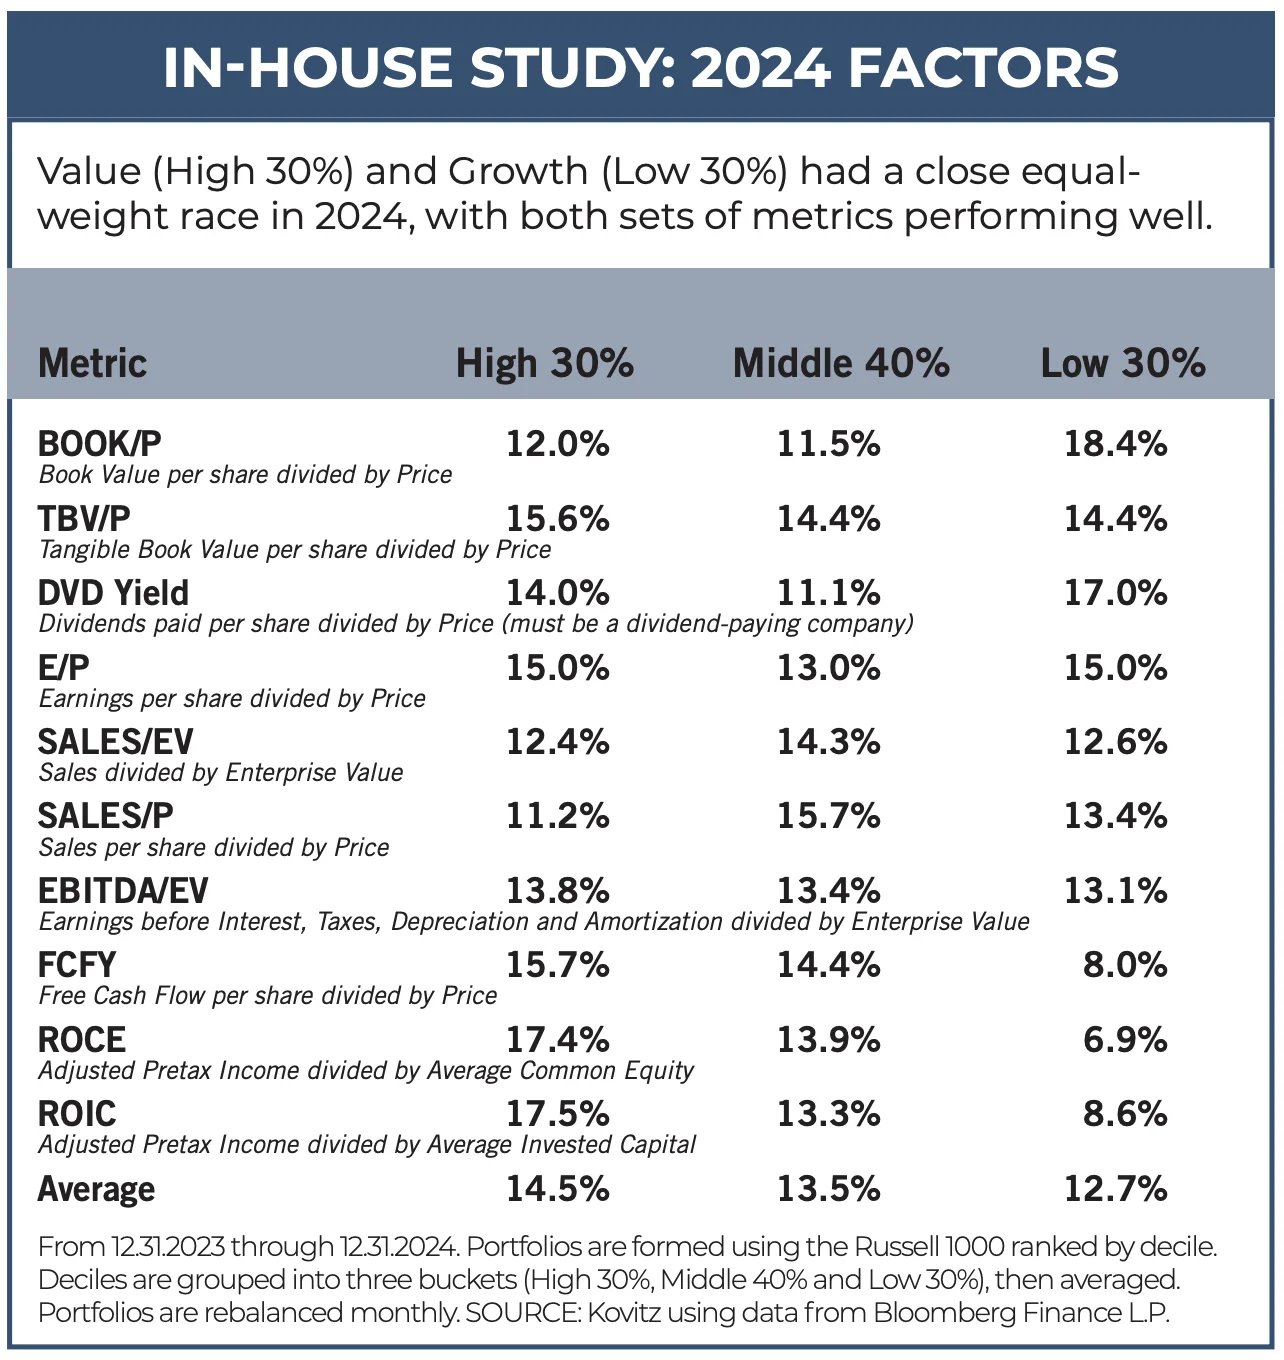
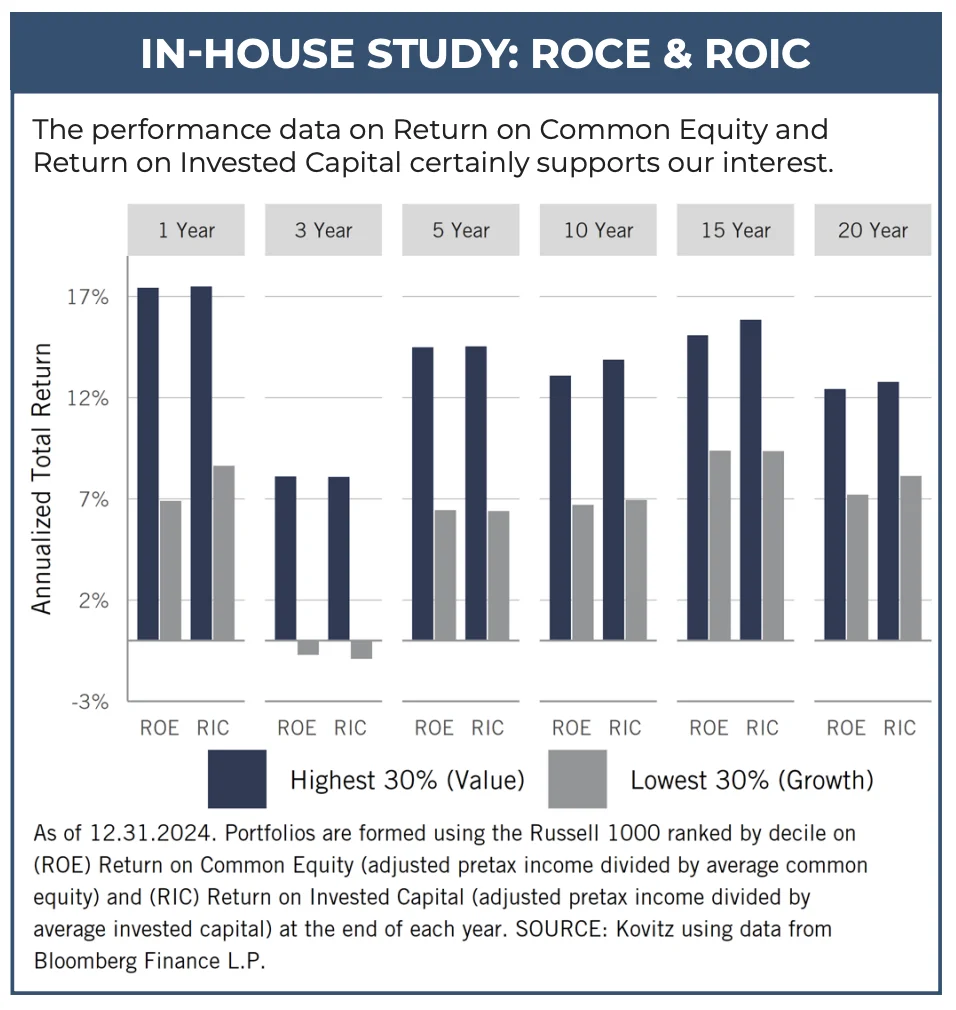
That in mind, we crunch plenty of our own numbers so that we can validate the historical evidence and determine if other valuation factors are worthy of inclusion in our work. Our initial screens are only one step in our investment process, but we continue to think that Free Cash Flow Yield, EBITDA/Enterprise Value, Return on Common Equity and Return on Invested Capital are measures that add value to our quantitative analytics.
Recommended Stock List
In this space, we list all of the stocks we own across our multi-cap-value managed account strategies and in our four newsletter portfolios. See the last page for pertinent information on our flagship TPS strategy, which has been in existence since the launch of The Prudent Speculator in March 1977.
Readers are likely aware that TPS has long been monitored by The Hulbert Financial Digest (“Hulbert”). As industry watchdog Mark Hulbert states, “Hulbert was founded in 1980 with the goal of tracking investment advisory newsletters. Ever since it has been the premiere source of objective and independent performance ratings for the industry.” For info on the newsletters tracked by Hulbert, visit: http://hulbertratings.com/since-inception/.
Keeping in mind that all stocks are rated as “Buys” until such time as we issue an official Sales Alert, we believe that all of the companies in the tables on these pages trade for significant discounts to our determination of long-term fair value and/or offer favorable risk/reward profiles. Note that, while we always seek substantial capital gains, we require lower appreciation potential for stocks that we deem to have more stable earnings streams, more diversified businesses and stronger balance sheets. The natural corollary is that riskier companies must offer far greater upside to warrant a recommendation. Further, as total return is how performance is ultimately judged, we explicitly factor dividend payments into our analytical work.
While we always like to state that we like all of our children equally, meaning that we would be fine in purchasing any of the 100+ stocks, we remind subscribers that we very much advocate broad portfolio diversification with TPS Portfolio holding more than eighty of these companies. Of course, we respect that some folks may prefer a more concentrated portfolio, however our minimum comfort level in terms of number of overall holdings in a broadly diversified portfolio is at least thirty!
TPS rankings and performance are derived from hypothetical transactions “entered” by Hulbert based on recommendations provided within TPS, and according to Hulbert’s own procedures, irrespective of specific prices shown within TPS, where applicable. Such performance does not reflect the actual experience of any TPS subscriber. Hulbert applies a hypothetical commission to all “transactions” based on an average rate that is charged by the largest discount brokers in the U.S., and which rate is solely determined by Hulbert. Hulbert’s performance calculations do not incorporate the effects of taxes, fees, or other expenses. TPS pays an annual fee to be monitored and ranked by Hulbert. With respect to “since inception” performance, Hulbert has compared TPS to 19 other newsletters across 62 strategies (as of the date of this publication). Past performance is not an indication of future results. For additional information about Hulbert’s methodology, visit: http://hulbertratings.com/methodology/.

Portfolio Builder
Each month in this column, we highlight 10 stocks with which readers might populate their portfolios: Abercrombie & Fitch (ANF), First Solar (FSLR), Meritage Homes (MTH)

Kovitz Investment Group Partners, LLC (“Kovitz”) is an investment adviser registered with the Securities and Exchange Commission. This report should only be considered as a tool in any investment decision and should not be used by itself to make investment decisions. Opinions expressed are only our current opinions or our opinions on the posting date. Any graphs, data, or information in this publication are considered reliably sourced, but no representation is made that it is accurate or complete and should not be relied upon as such. This information is subject to change without notice at any time, based on market and other conditions. Past performance is not indicative of future results, which may vary.