Every month, The Prudent Speculator produces a newsletter that includes a market summary, helpful charts and graphs, recent equity market news, economic outlook and specific stock investment strategies focused on value stock investing. In this month’s newsletter we discuss long-term investing, global market performance and valuations. We also include a preview of our current Recommended Stock List and Portfolio Builder section with ten highlighted stocks. Note that the entire list is available to our community of loyal subscribers only.

Editor’s Note: Long-Term Investing, Global Market Performance, Valuations and More
“Psychology helps to measure the probability that an aim is attainable.” – Edward Thorndike
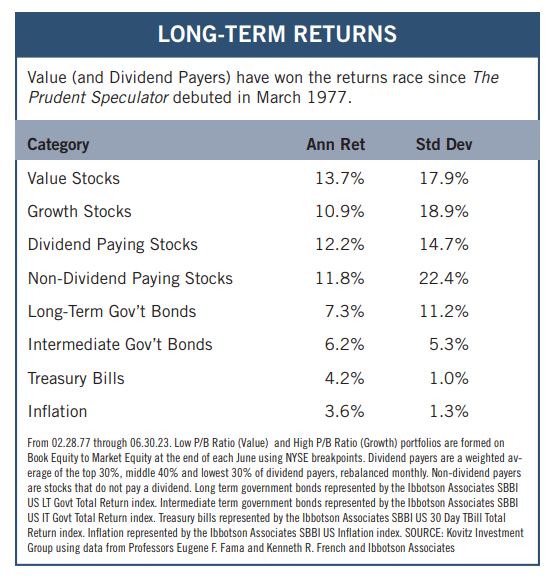
Our founder Al Frank proclaimed more than 46 years ago in the inaugural issue of The Prudent Speculator, “Successful speculating is more a matter of character than mathematics, analysis or luck,” and those words continue to ring true more than ever today. Indeed, even though equities have enjoyed sensational long-term returns ranging from 12.2% per annum (Dividend Payers) to 13.7% per annum (Value Stocks) since the launch of our publication in March 1977, a month like September can make it difficult for many sailors to maintain their course. After all, the Russell 3000 Value index tumbled 3.94% on a total-return basis last month, while its Growth counterpart skidded 5.50%. For its part, the broad-based S&P 500 dropped 4.87% on a price basis.
Of course, that big decline for the S&P ranks only #130 on the list of worst months for the benchmark over the past 95 years. In addition, the current retreat from the recent highs of more than 5% is the 316th such occurrence, meaning losses of similar magnitude have taken place more than three times per year on average.
Obviously, given that the S&P has enjoyed a 10.1% average annualized long-term return, there have been numerous months (178 to be precise) since 1928 with gains of 4.87% or greater, while the average gain (14.7%) in periods stocks are advancing has dwarfed the average loss (10.9%) when they are falling. Believe it or not, the S&P has appreciated on a monthly basis 62.8% of the time, meaning that the historical odds are very much stacked in the favor of long-term-oriented investors.
And speaking of probabilities, stocks suffered their worst one-day drop since March on Sept. 27 due in large part to interest rate comments from high-profile JPMorgan Chase CEO Jamie Dimon who said while in India, “Going from zero to 2% was almost no increase. Going from zero to 5% caught some people off guard, but no one would have taken 5% out of the realm of possibility. I am not sure if the world is prepared for 7%.” Naturally, Mr. Dimon must have his bank braced for any eventuality, but the chance of a 7% interest rate would seem remote, especially if the latest economic projections from the Federal Reserve are to be believed.
In fact, Jerome H. Powell & Co. are estimating that there is likely to be one more interest rate increase this year, before the target for the Fed Funds rate falls to 4.6% next year and 3.4% in 2025. The Fed paused the 2023 rate hikes last month, with Chair Powell explaining, “We’re taking advantage of the fact that we’ve moved quickly to move a little more carefully now.”
To be sure, there is no consensus at the Fed on where rates are headed, as Minneapolis Fed President Neel Kashkari had the following to say, also on Sept. 27: “Once supply factors have fully recovered, is policy tight enough to complete the job of bringing services inflation back to target? It might not be, in which case we would have to push the Federal Funds rate higher, potentially meaningfully higher. Today, I put a 40% probability on this scenario.”
We suppose that sounds somewhat disconcerting, even as there is a 60% chance that such a scenario will not materialize. Further, readers are likely well aware of our research showing that Value Stocks and Dividend Payers have managed very nice gains, on average, whether the Fed is raising or lowering interest rates, and whether the yield on the 10-Year U.S. Treasury is moving higher or lower. And history even shows that long-term investors would want to be moving toward stocks if the economy was in recession as the period following prior contractions has seen terrific average returns.
Anything can happen, but we continue to like the probability that our broadly diversified portfolios of what we believe to be undervalued stocks will provide handsome long-term rewards
Graphic Detail: Value Disparity, Intermediate and Long-Term Returns
Long-Term Perspective
The downturn in August and September has dampened enthusiasm for stocks, but what a difference a year makes? After all, at this time in 2022, the major market averages were then off more than 20% from their highs. Meanwhile, the broad-based Russell 3000 index was down 24.6% on the year and the average stock was mired in its fourth Bear Market (2016, 2018, 2020 & 2022) in less than seven years. Not surprisingly, talking heads were warning at every turn that further equity market peril was likely.
Fast forward a year and it is not as if stiff headwinds are no longer blowing. After all, the Federal Reserve continues to battle inflation, with Jerome H. Powell & Co. having raised the discount rate by 200 basis points, from an upper bound of 3.5% a year ago to 5.5% today. Meanwhile, the yield on the 10-Year U.S. Treasury has jumped from 3.97% to 4.58%, the highest level since 2007.
Sounds like a difficult backdrop for stocks, especially given additional new bricks in the proverbial Wall of Worry, yet the major market averages scored handsome gains over the past 12 months. While there was even greener grass in the tech-heavy benchmarks, the Russell 3000 Value index advanced 14.6% and the S&P 500 Value index climbed 22.5% from 9.30.22 to 9.30.23. True, those gains merely recouped the losses over the prior 12 months, but they again offered the reminder that the secret to success in stocks is not to get scared out of them.
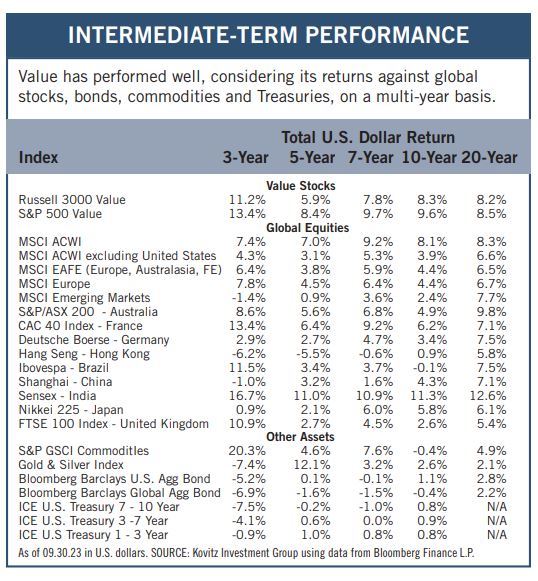
Yes, it is not always easy to keep the faith as markets endure inevitable short-term trips south, so we think the perspective gained via a longer-term lens is valuable. This is especially true for those invested in Value stocks, which have been maligned in recent years. Believe it or not, the Russell 3000 Value and S&P 500 Value indexes since Q3 2013 have respectively gained 8.3% and 9.6% PER ANNUM, a terrific 10-year annualized return (in dollar terms) relative to most stocks outside the U.S., not to mention bonds, commodities and U.S. Treasuries.
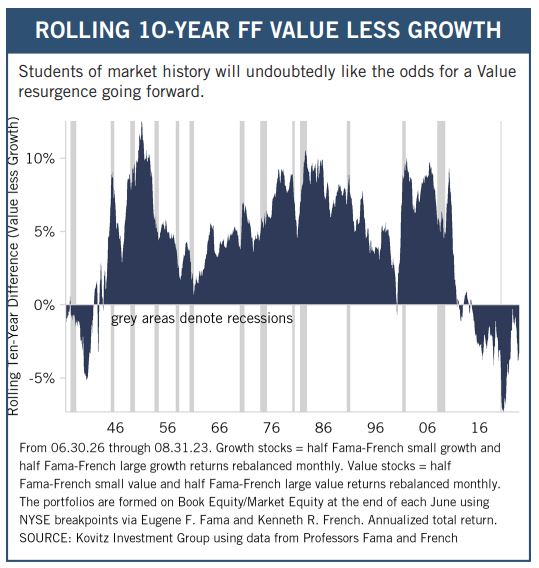
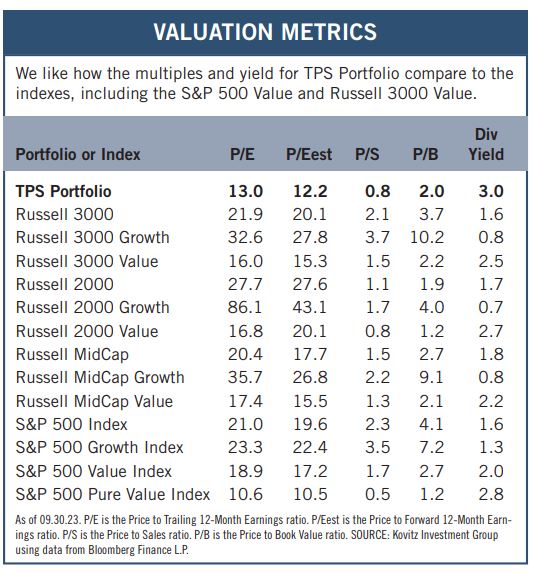
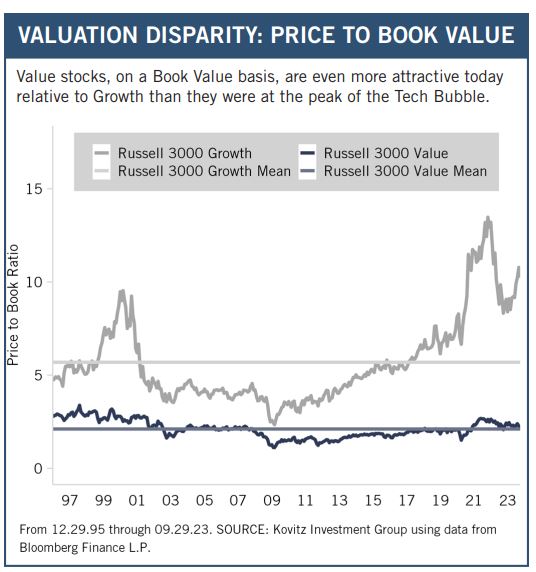
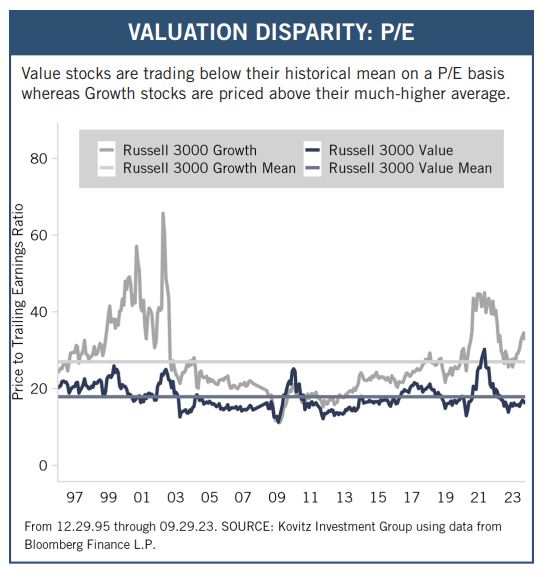
Yes, all of those Value returns trail the historical 13.7% annual return for the Fama-French Value series dating back to the launch of The Prudent Speculator more than 46 years ago, but in our view this bodes well for stocks like those we have long championed going forward. Historically, Value has outperformed Growth, yet over the last 10 years, the latter has led the charge, which has markedly widened the valuation gap. On that score, with many concerned about rich equity multiples, we think metrics in line with the historical norms adds to Value’s appeal.
Recommended Stock List
In this space, we list all of the stocks we own across our multi-cap-value managed account strategies and in our four newsletter portfolios. See the last page for pertinent information on our flagship TPS strategy, which has been in existence since the launch of The Prudent Speculator in March 1977.
Readers are likely aware that TPS has long been monitored by The Hulbert Financial Digest (“Hulbert”). As industry watchdog Mark Hulbert states, “Hulbert was founded in 1980 with the goal of tracking investment advisory newsletters. Ever since it has been the premiere source of objective and independent performance ratings for the industry.” For info on the newsletters tracked by Hulbert, visit: http://hulbertratings.com/since-inception/.
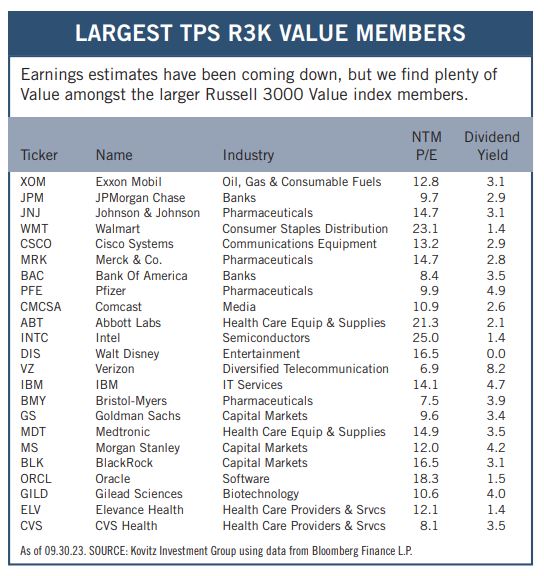
Keeping in mind that all stocks are rated as “Buys” until such time as we issue an official Sales Alert, we believe that all of the companies in the tables on these pages trade for significant discounts to our determination of long-term fair value and/or offer favorable risk/reward profiles. Note that, while we always seek substantial capital gains, we require lower appreciation potential for stocks that we deem to have more stable earnings streams, more diversified businesses and stronger balance sheets. The natural corollary is that riskier companies must offer far greater upside to warrant a recommendation. Further, as total return is how performance is ultimately judged, we explicitly factor dividend payments into our analytical work.
While we always like to state that we like all of our children equally, meaning that we would be fine in purchasing any of the 100+ stocks, we remind subscribers that we very much advocate broad portfolio diversification with TPS Portfolio holding more than eighty of these companies. Of course, we respect that some folks may prefer a more concentrated portfolio, however our minimum comfort level in terms of number of overall holdings in a broadly diversified portfolio is at least thirty!
TPS rankings and performance are derived from hypothetical transactions “entered” by Hulbert based on recommendations provided within TPS, and according to Hulbert’s own procedures, irrespective of specific prices shown within TPS, where applicable. Such performance does not reflect the actual experience of any TPS subscriber. Hulbert applies a hypothetical commission to all “transactions” based on an average rate that is charged by the largest discount brokers in the U.S., and which rate is solely determined by Hulbert. Hulbert’s performance calculations do not incorporate the effects of taxes, fees, or other expenses. TPS pays an annual fee to be monitored and ranked by Hulbert. With respect to “since inception” performance, Hulbert has compared TPS to 19 other newsletters across 62 strategies (as of the date of this publication). Past performance is not an indication of future results. For additional information about Hulbert’s methodology, visit: http://hulbertratings.com/methodology/.

Portfolio Builder
Each month in this column, we highlight 10 stocks with which readers might populate their portfolios: Citigroup(C), Celanese (CE), Medtronic PLC (MDT) and seven others.