Every month, The Prudent Speculator produces a newsletter that includes a market summary, helpful charts and graphs, recent equity market news, economic outlook and specific stock investment strategies focused on value stock investing. This month, we celebrate our 46th Anniversary and detail stock market news via our Quarterly Earnings Scorecard. We also include a preview of our current Recommended Stock List and Portfolio Builder section with ten highlighted stocks. Note that the entire list is available to our community of loyal subscribers only.

Editor’s Note: Warren Buffet on Volatility; High Odds of Interest Rate Boost and More Stock Market News
This month, The Prudent Speculator celebrates its 46th anniversary! It was March 12, 1977, when the first edition of The Pinchpenny Speculator rolled off our founder Al Frank’s 10-inch carriage, pica typewriter. A marketing genius Al was not, for it took him five years to swap out the pejorative Pinchpenny for Prudent on our masthead. Of course, Speculator was not exactly the best sales tool either, though Al would explain, “Actually, I very much see speculating as a form of being in business. I have purchased certain merchandise with the anticipation of selling it at a profit. Sometimes I will have misjudged conditions and be unable to liquidate except at a loss. More often, skillfully, I will have bought my straw hats in the winter and my fur coats in the summer, so that in due time their prices will advance in season.”
Of course, equity markets have no consistent seasons and short-term gyrations are impossible to predict, but Al’s analogy is apt in that buying stocks when they are unwanted and undervalued and selling them when they are en vogue and fairly valued or when another stock is more attractively priced is a very prudent form of speculation. After all, since March 1977, Value Stocks have returned 14.1% through 1.31.23, while Dividend-Payers have returned 12.3%. Those figures compare very well to the 10.9% and 11.6% respective annualized returns for Growth Stocks and Non-Dividend Payers, not to mention the 3.6% average inflation rate.
Further illustrating that time in the market trumps market timing, data provider Dalbar shows that the average equity fund investor has had a 6.81% per annum total return over the last 30 years through 2022, compared to 9.65% for the S&P 500. Alas, far too many folks think they can jump out of stocks before a downturn and get back in before the next upturn. Believe it or not, the S&P 500 is now in the 150th downturn of at least 5% without a 5% or greater move in the other direction just since the launch of The Prudent Speculator, yet despite enduring every one of those trips south, we have been well rewarded over the long haul as the newsletter back page will attest.
Warren Buffett wrote in the 2022 Berkshire Hathaway Letter to Shareholders, “It’s crucial to understand that stocks often trade at truly foolish prices, both high and low. ‘Efficient’ markets exist only in textbooks. In truth, marketable stocks and bonds are baffling, their behavior usually understandable only in retrospect.”
This is especially true these days. For example, on Wednesday, the markets dipped as a slightly stronger-than-expected reading on the health of the manufacturing sector pushed the benchmark U.S. Treasury yield above 4% and increased the odds of a 50-basis-point interest rate boost at the upcoming FOMC meeting. However, stock prices rebounded on Thursday, despite bond yields moving higher still, with dovish comments from Atlanta Fed Governor Raphael Bostic suggesting that he thinks the Fed can keep interest rate hikes to 25 basis points the catalyst.
Needless to say, nobody knows which way equity prices will move in the near term, but we continue to believe that we will be able to sell the merchandise we are buying and holding today at a handsome profit in the fullness of time. Yes, uncertainty abounds on rates, the Fed, inflation and the economy, but we take great comfort in the inexpensive valuation metrics (forward P/E ratio of 12.4) and generous dividend yield of 2.9% for TPS Portfolio.
Mr. Buffett recently proclaimed, “We count on the American Tailwind and, though it has been becalmed from time to time, its propelling force has always returned. I have been investing for 80 years – more than one-third of our country’s lifetime. Despite our citizens’ penchant–almost enthusiasm–for self-criticism and self-doubt, I have yet to see a time when it made sense to make a long-term bet against America.” It has been nearly 21 years since Al Frank passed, but we are certain he would concur.
Earnings Scorecard: Surpassing Earnings expectations; GDP growth in Q4 and more
Q4 Season
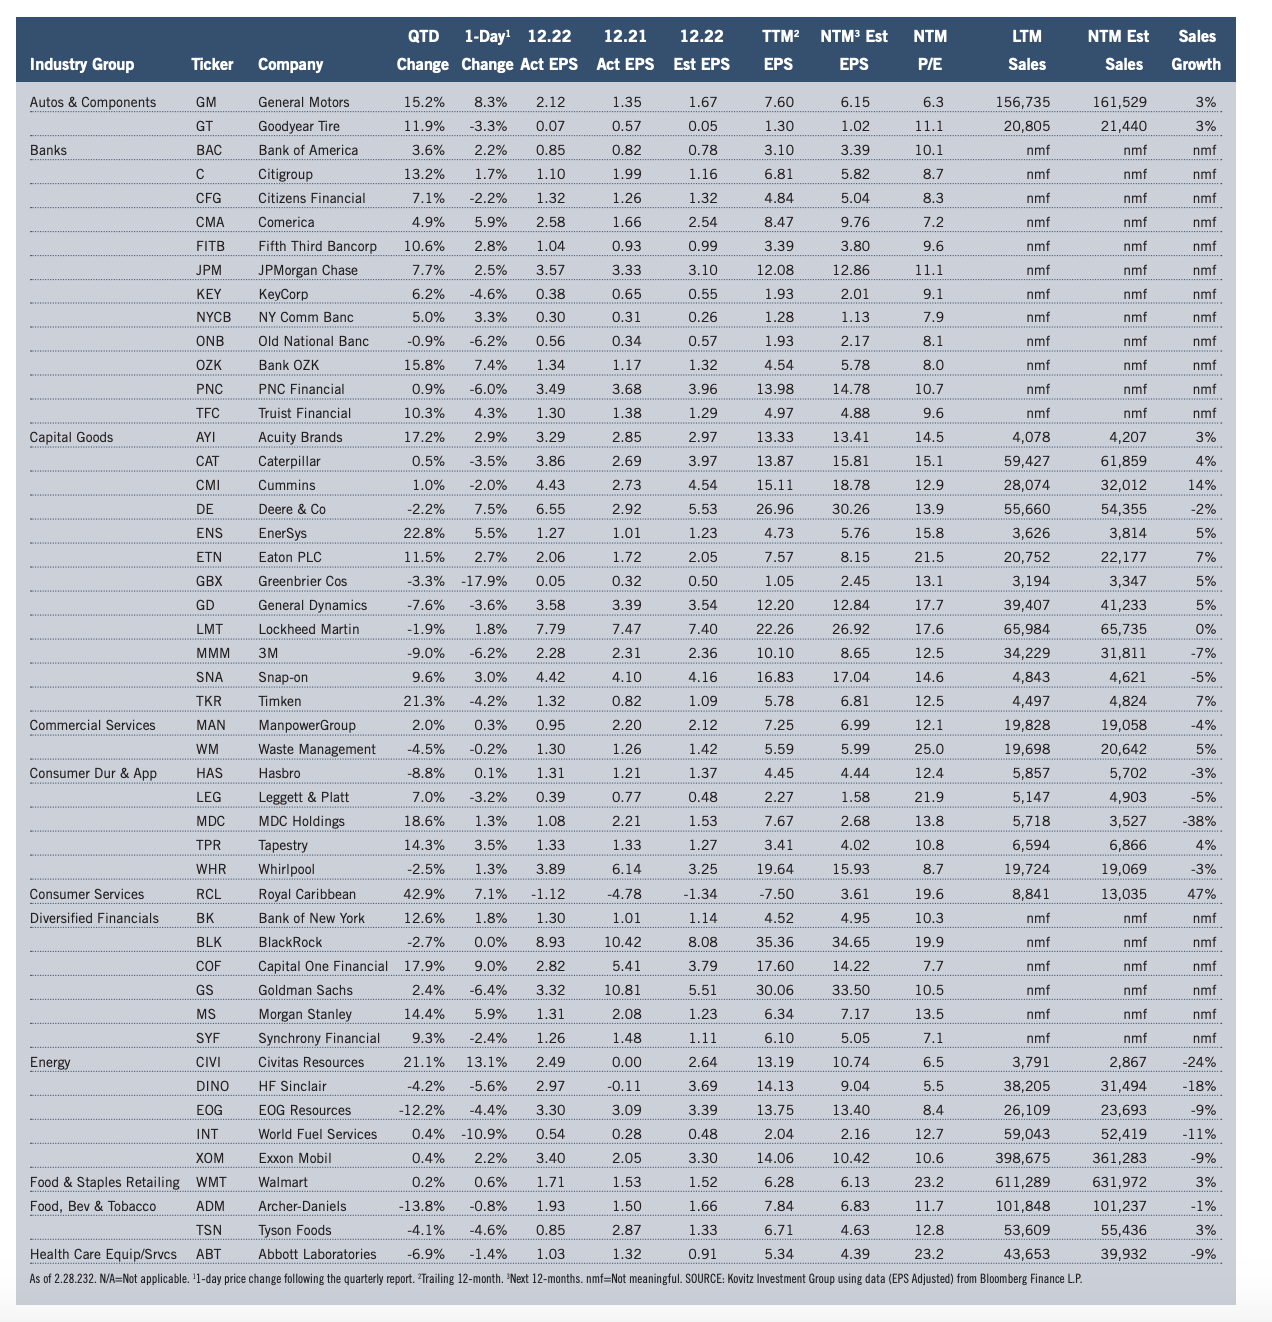
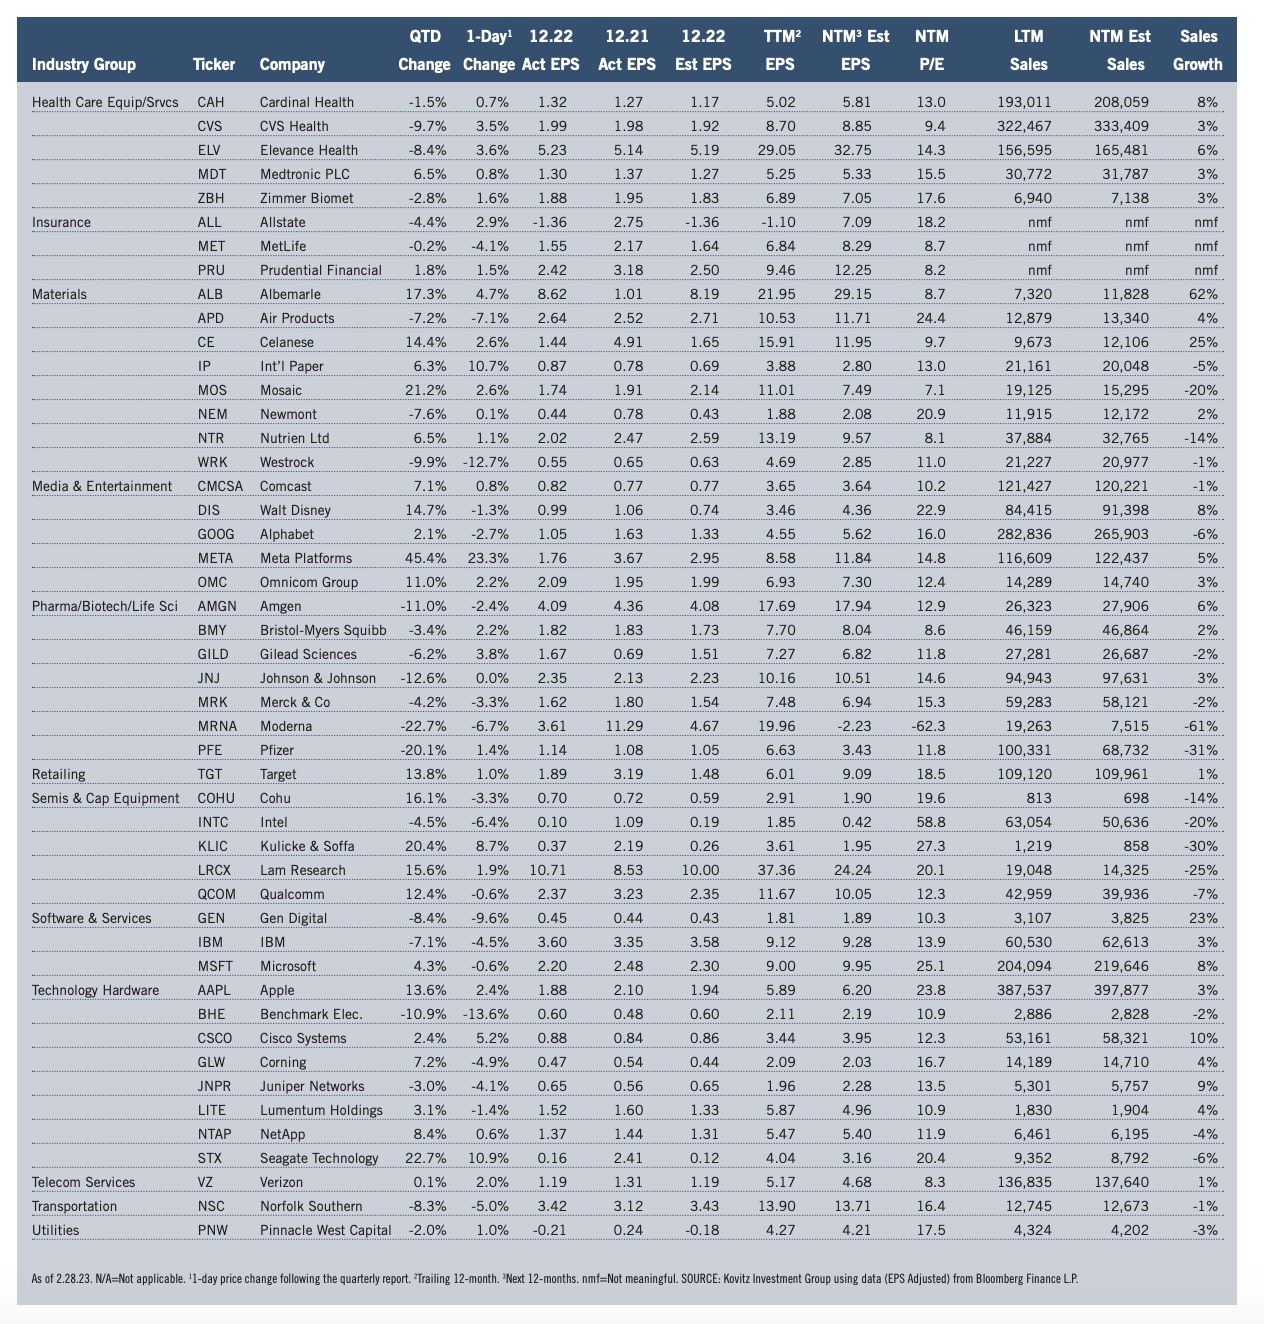
Economic statistics in the period were not exactly anything to write home about, yet real (inflation-adjusted) U.S. GDP growth came in at 2.7% in Q4, supporting solid revenue and net income numbers from Corporate America, even as management teams engaged in their usual tempering of guidance. Impressively, the number of S&P 500 companies that exceeded bottom-line forecasts was 68.6%, in line with the usual “beat” rate, while 58.3% eclipsed top-line projections. Of The Prudent Speculator’s 97 stocks presented in our Earnings Scorecard, 65% topped EPS expectations, while the average one-day price reaction was a gain of 0.2%, despite several big setbacks.
Standard & Poor’s projects (as of 2.28.23) that after dipping from $208.21 in 2021 to $196.09 in 2022 (last year’s figure includes a massive $66.9 billion ($4.74 per share) “unrealized investment” loss from Berkshire Hathaway in Q2), bottom-up operating EPS for the S&P 500 will rise to $219.13 in 2023. Estimates are subject to change (current forecasts are lower than those three months ago) and much will depend on the health of the U.S. and global economies, but anything close to that ‘23 tally should support much higher stock prices.
Recommended Stock List
In this space, we list all of the stocks we own across our multi-cap-value managed account strategies and in our four newsletter portfolios. See the last page for pertinent information on our flagship TPS strategy, which has been in existence since the launch of The Prudent Speculator in March 1977.
Readers are likely aware that TPS has long been monitored by The Hulbert Financial Digest (“Hulbert”). As industry watchdog Mark Hulbert states, “Hulbert was founded in 1980 with the goal of tracking investment advisory newsletters. Ever since it has been the premiere source of objective and independent performance ratings for the industry.” For info on the newsletters tracked by Hulbert, visit: http://hulbertratings.com/since-inception/.
Keeping in mind that all stocks are rated as “Buys” until such time as we issue an official Sales Alert, we believe that all of the companies in the tables on these pages trade for significant discounts to our determination of longterm fair value and/or offer favorable risk/reward profiles. Note that, while we always seek substantial capital gains, we require lower appreciation potential for stocks that we deem to have more stable earnings streams, more diversified businesses and stronger balance sheets. The natural corollary is that riskier companies must offer far greater upside to warrant a recommendation. Further, as total return is how performance is ultimately judged, we explicitly factor dividend payments into our analytical work.
While we always like to state that we like all of our children equally, meaning that we would be fine in purchasing any of the 100+ stocks, we remind subscribers that we very much advocate broad portfolio diversification with TPS Portfolio holding more than eighty of these companies. Of course, we respect that some folks may prefer a more concentrated portfolio, however our minimum comfort level in terms of number of overall holdings in a broadly diversified portfolio is at least thirty!
TPS rankings and performance are derived from hypothetical transactions “entered” by Hulbert based on recommendations provided within TPS, and according to Hulbert’s own procedures, irrespective of specific prices shown within TPS, where applicable. Such performance does not reflect the actual experience of any TPS subscriber. Hulbert applies a hypothetical commission to all “transactions” based on an average rate that is charged by the largest discount brokers in the U.S., and which rate is solely determined by Hulbert. Hulbert’s performance calculations do not incorporate the effects of taxes, fees, or other expenses. TPS pays an annual fee to be monitored and ranked by Hulbert. With respect to “since inception” performance, Hulbert has compared TPS to 19 other newsletters across 62 strategies (as of the date of this publication). Past performance is not an indication of future results. For additional information about Hulbert’s methodology, visit: http://hulbertratings.com/methodology/.

Portfolio Builder
Each month in this column, we highlight 10 stocks with which readers might populate their portfolios: HF Sinclair (DINO), Alphabet (GOOG), 3M Co (MMM) and seven others.