
Every month, The Prudent Speculator produces a newsletter that includes a market summary, helpful charts and graphs, recent equity market news, economic outlook and specific stock investment strategies focused on value stock investing. This month, we take a look at a very good Q2 earnings reporting season, while we again add stocks to our four newsletter portfolios. Note that the entire list is available to our community of subscribers only.

Editor’s Note: Q2 Earnings Report, FOMC Meeting and GDP Growth
We realize that he has long not been a fan, as back in 2022 he called Jerome H. Powell’s monetary policy the third worst in the history of the Federal Reserve, but we were shocked by Professor Jeremy Siegel’s call on August 5 for an emergency Fed rate cut of 75 basis points and an additional 75-basis-point reduction at the FOMC Meeting in September.
True, there had just been two weaker-than-expected economic numbers released, with the ISM Manufacturing Index (PMI) for July dropping to 46.8, well below the historical average of 52.3, and the monthly jobs report showing only 114,000 new payrolls created, but Mr. Powell has repeatedly stated that his group is data dependent, so two poor numbers would hardly a trend make. An emergency cut this time around, especially of 75 basis points, would have signalled that the Fed Chair and his colleagues were expecting the economy to fall off a cliff.
It isn’t as if a cut in the target for the Fed Funds rate in between FOMC meetings would have been unprecedented, but prior reductions followed the collapse of Long-Term Capital in 1998, the bursting of the Tech Bubble in early 2001, the aftermath of the terrorist attacks on 9/11, the upheaval during the Great Financial Crisis in 2007-2008 and worries about COVID-19 in March 2020.
Given that the Siegel plea coincided with a sizable equity market downturn in the U.S. and an even bigger plunge for Japanese stocks, we might argue that the Wizard of Wharton forgot one of the tenets of his long-term-oriented-investor classic Stocks for the Long Run: “In the short run, however, stock returns are very volatile, driven by changes in earnings, interest rates, risk, and uncertainty, as well as psychological factors, such as optimism and pessimism as well as fear and greed.”
To be fair to the good Professor, a couple of days later he backed off his call for an emergency cut, stating, “Obviously, I wanted to shake things up. There’s no way he’s going to do that without things falling apart. I don’t think things are falling apart. But by all criteria and all monetary rules…they [rates] should be under 4%.”
And, he was quick to add that day, “ I didn’t say it was a recession. I didn’t say it’s a Bear Market. I didn’t say, dump your stocks.” Happily, Prof. Siegel seemingly remembered what he said a couple of years back: “It’s interesting because the first edition [Stocks for the Long Run], which came out in May 1994, used data through the end of 1992. The long-term real return (net of inflation, from investing in stocks) 1802 onward was 6.7% in real terms. I updated it til June of this year and it’s 6.7% real—exactly the same as the last 30 years, despite the financial crisis, COVID, and so forth. It’s remarkably durable.”
Certainly, there was no assurance that the economic data would not deteriorate further, but the stats that followed in August generally were solid. Real (inflation-adjusted) U.S. GDP growth for Q2 also came in at a healthy 3.0%, reinforcing what Mr. Powell said in his widely anticipated Jackson Hole, Wyoming speech on August 23, “Overall, the economy continues to grow at a solid pace…With an appropriate dialing back of policy restraint, there is good reason to think that the economy will get back to 2% inflation while maintaining a strong labor market.”
We shall see if the Fed has moved too slowly in easing monetary policy and stocks sold off again the first day of seasonally weak September on another lower-than-expected PMI report, but the current estimate for real Q3 GDP growth is 2.0%, while Q2 EPS growth was strong and the forecast for corporate profits through the balance of this year and 2025 is favorable. With rate cuts on the way (the futures market is showing year-end 2024 and 2025 Fed Funds at 4.30% and 3.09%, respectively), the interest rate backdrop should also be supportive of higher equity prices. Yes, we must always be braced for downside volatility, but we still prize our copy of Stocks for the Long Run!
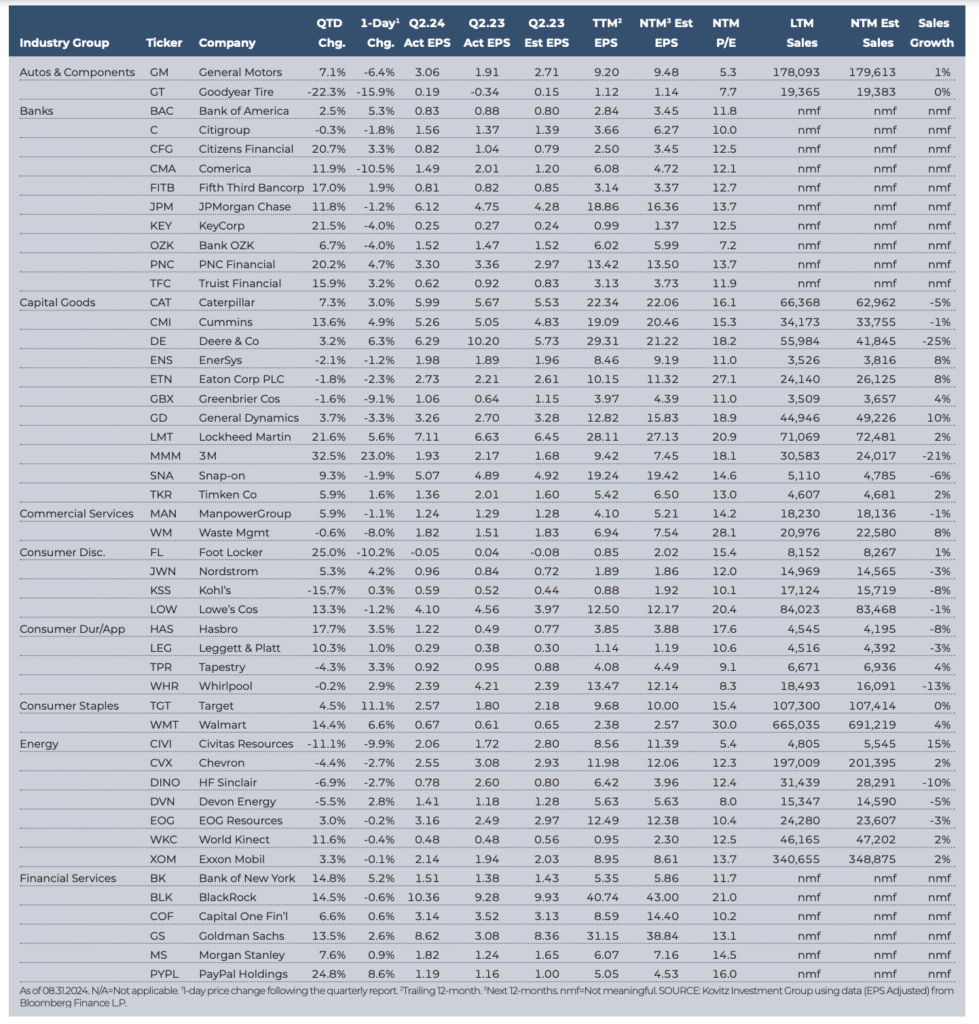
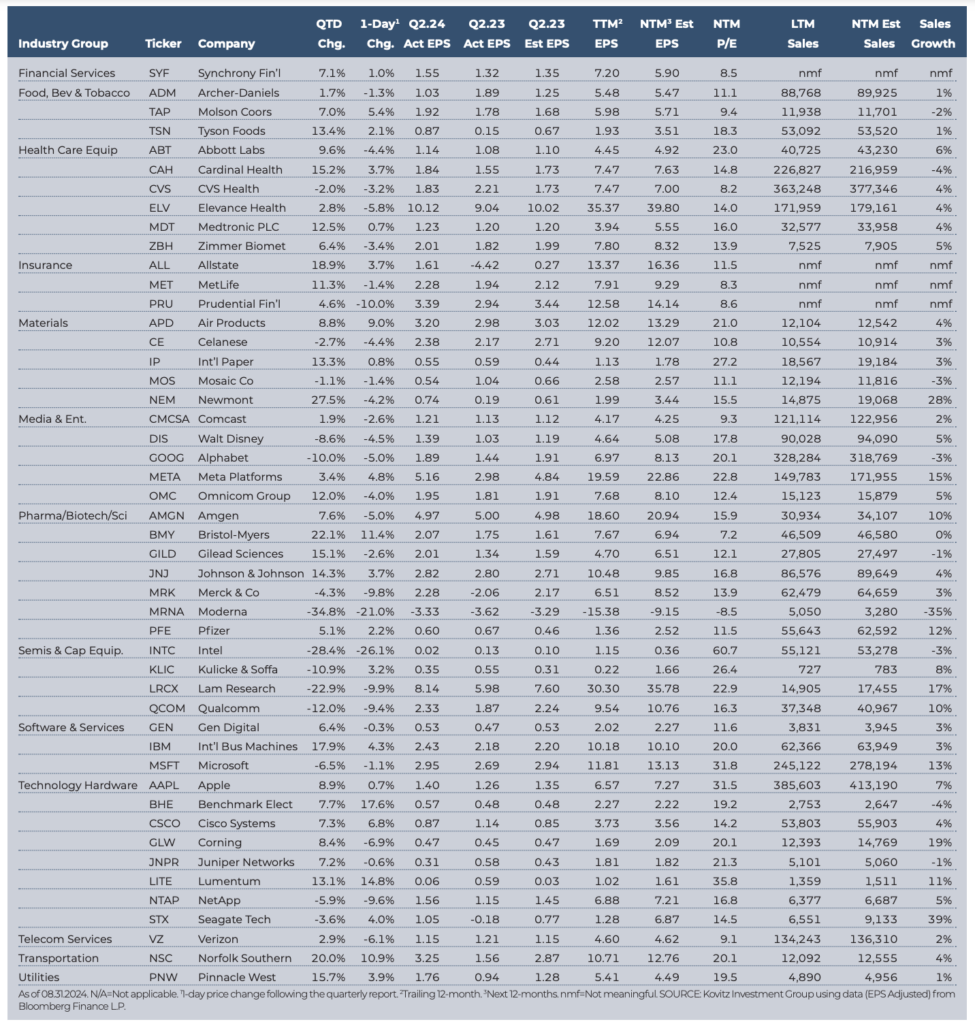
Graphic Detail: Earning Scorecards
Q2 Season
Economic data in the period was favorable and real (inflation-adjusted) U.S. GDP grew a robust 3.0% in Q2, while Corporate America again enjoyed solid revenue and net income tallies, even as management teams engaged in their usual tempering of guidance. Impressively, the number of S&P 500 companies that exceeded bottom-line forecasts was 79.9%, in line with the usual “beat” rate, and 48.9% eclipsed top-line projections. Of The Prudent Speculator’s 96 stocks presented below, 73% topped EPS expectations, but the average one-day price reaction was a loss of 0.3%, yet the average two-month gain since 06.30.24 through 08.31.24 was 5.8%.
Standard & Poor’s projects (as of 08.30.24) bottom-up operating EPS for the S&P 500 are to climb to $237.81 in 2024 and $277.34 in 2025. That is up from $196.95 and $213.53 in 2022 and 2023, respectively, and those figures include massive $66.9 billion ($4.74 per share) in Q2 ‘22 and $23.5 billion ($2.82 per share) in Q3 ‘23 “unrealized investment” losses for Berkshire Hathaway. Estimates are subject to change (current forecasts are lower (‘24) and higher (‘25) vs. three months ago), but anything close to those EPS levels should support higher stock prices.
Recommended Stock List
In this space, we list all of the stocks we own across our multi-cap-value managed account strategies and in our four newsletter portfolios. See the last page for pertinent information on our flagship TPS strategy, which has been in existence since the launch of The Prudent Speculator in March 1977.
Readers are likely aware that TPS has long been monitored by The Hulbert Financial Digest (“Hulbert”). As industry watchdog Mark Hulbert states, “Hulbert was founded in 1980 with the goal of tracking investment advisory newsletters. Ever since it has been the premiere source of objective and independent performance ratings for the industry.” For info on the newsletters tracked by Hulbert, visit: http://hulbertratings.com/since-inception/.
Keeping in mind that all stocks are rated as “Buys” until such time as we issue an official Sales Alert, we believe that all of the companies in the tables on these pages trade for significant discounts to our determination of long-term fair value and/or offer favorable risk/reward profiles. Note that, while we always seek substantial capital gains, we require lower appreciation potential for stocks that we deem to have more stable earnings streams, more diversified businesses and stronger balance sheets. The natural corollary is that riskier companies must offer far greater upside to warrant a recommendation. Further, as total return is how performance is ultimately judged, we explicitly factor dividend payments into our analytical work.
While we always like to state that we like all of our children equally, meaning that we would be fine in purchasing any of the 100+ stocks, we remind subscribers that we very much advocate broad portfolio diversification with TPS Portfolio holding more than eighty of these companies. Of course, we respect that some folks may prefer a more concentrated portfolio, however our minimum comfort level in terms of number of overall holdings in a broadly diversified portfolio is at least thirty!
TPS rankings and performance are derived from hypothetical transactions “entered” by Hulbert based on recommendations provided within TPS, and according to Hulbert’s own procedures, irrespective of specific prices shown within TPS, where applicable. Such performance does not reflect the actual experience of any TPS subscriber. Hulbert applies a hypothetical commission to all “transactions” based on an average rate that is charged by the largest discount brokers in the U.S., and which rate is solely determined by Hulbert. Hulbert’s performance calculations do not incorporate the effects of taxes, fees, or other expenses. TPS pays an annual fee to be monitored and ranked by Hulbert. With respect to “since inception” performance, Hulbert has compared TPS to 19 other newsletters across 62 strategies (as of the date of this publication). Past performance is not an indication of future results. For additional information about Hulbert’s methodology, visit: http://hulbertratings.com/methodology/.

Portfolio Builder
Each month in this column, we highlight 10 stocks with which readers might populate their portfolios: Cohu (COHU), TotalEnergies SE (TTE) and Molson Coors (TAP).

Kovitz Investment Group Partners, LLC (“Kovitz”) is an investment adviser registered with the Securities and Exchange Commission. This report should only be considered as a tool in any investment decision and should not be used by itself to make investment decisions. Opinions expressed are only our current opinions or our opinions on the posting date. Any graphs, data, or information in this publication are considered reliably sourced, but no representation is made that it is accurate or complete and should not be relied upon as such. This information is subject to change without notice at any time, based on market and other conditions. Past performance is not indicative of future results, which may vary.