
Every month, The Prudent Speculator produces a newsletter that includes a market summary, helpful charts and graphs, recent equity market news, economic outlook and specific stock investment strategies focused on value stock investing. This month, we offer a brand-new recommendation in the Materials sector, while our Graphic Detail takes a look at our newsletter portfolio sector weightings and Russell index 2024 sector attribution figures. Note that the entire list is available to our community of subscribers only.

Editor’s Note: Value Stocks, Economic Statistics and the Federal Reserve
The equity markets followed up a terrific November with a dismal December, providing another reminder that downside volatility is always part of the investment equation. The Dow Jones Industrial Average closed out 2024 with a final-month loss of more than 5%, the second monthly decline of that magnitude or greater of the year and the 125th time the popular market gauge has suffered a similar or larger skid dating back to 1928. Of course, given that the Dow has risen from a reading of 200 nearly a century ago to more than 42000 today, there have been lots of winning months along the way, with 167 of them over the last 97 years enjoying returns above 5%.
Obviously, equities have proved very rewarding over the long term, as those Dow numbers do not include dividends or their reinvestment, while Value Stocks have returned 13.1% and Dividend Payers 10.8% per annum since 1927. However, it has never been easy for many investors to stick with stocks during the inevitable trips south.
No doubt, there have been numerous disconcerting headlines on the global stage through the years and it isn’t as if it has been a pleasure to read the newspapers in recent weeks, but the December downturn hit without a clear catalyst. True, the markets had posted sensational gains since the Q3 2022 lows, so a round or two of profit taking was not surprising, but we would argue that nothing much changed on the economic front in December.
In fact, several of the key stats (albeit for November) released during the month topped expectations with the critical monthly labor report showing 227,000 new payrolls created and retail sales climbing 0.7%, ahead of the 0.4% estimated increase. We also learned that the economy was even stronger than thought in Q3, with real (inflation-adjusted) GDP growth revised up to 3.1% from 2.8%, while the odds of recession in the next 12 months as tabulated by data provider Bloomberg declined from 25% to 20%. And the Federal Reserve’s preferred measure of inflation, the Core Personal Consumption Expenditure (PCE) Price Index rose a less-than-forecast 2.8% on a year over-year basis during November.
Stock prices gyrate for many reasons, but most market watchers would cite the Fed as the culprit for last month’s swoon. As widely expected, the FOMC at its December meeting lowered its target for the Fed Funds rate by another 25 basis points to a range of 4.25% to 4.50% BUT the updated quarterly economic projections from Jerome H. Powell & Co. had a sizable jump in the year-end 2025 and 2026 expectations for the benchmark lending rate. The Fed now estimates a Fed Funds rate at the end of this year of 3.9%, up from 3.4% in the September forecast, and 3.4% in 2026, up from the prior 2.9%.
Interestingly, those forecasts were roughly in line with market expectations ahead of the Dec. 18 decision on interest rates, while the Fed Chair was relatively upbeat in his comments: “The economy is strong overall and has made significant progress toward our goals over the past two years. The labor market has cooled from its formerly overheated state and remains solid. Inflation has moved much closer to our 2 percent longer-run goal.”
We find it hard to be unhappy about an economy on sound footing, especially as corporate profits are likely to show healthy growth this year, even if it means the data-dependent Fed might be more patient in any further easing of monetary policy. After all, decades of market history reveal that stocks have performed fine whether the Fed is lifting or lowering its lending rate or whether interest rates in general are rising or falling.
Yes, geopolitical events always are a wildcard, while there is plenty of uncertainty emanating from Washington, but we retain our optimism for the long-term prospects of our broadly diversified portfolios of what we believe to be undervalued stocks, with the recent dip adding to the upside potential going forward.
“It’s not unlike driving on a foggy night or walking into a dark room full of furniture. You just slow down.” — Jerome H. Powel
Graphic Detail: Sector and Industry Group Weightings and Value vs. Growth Sector Attribution
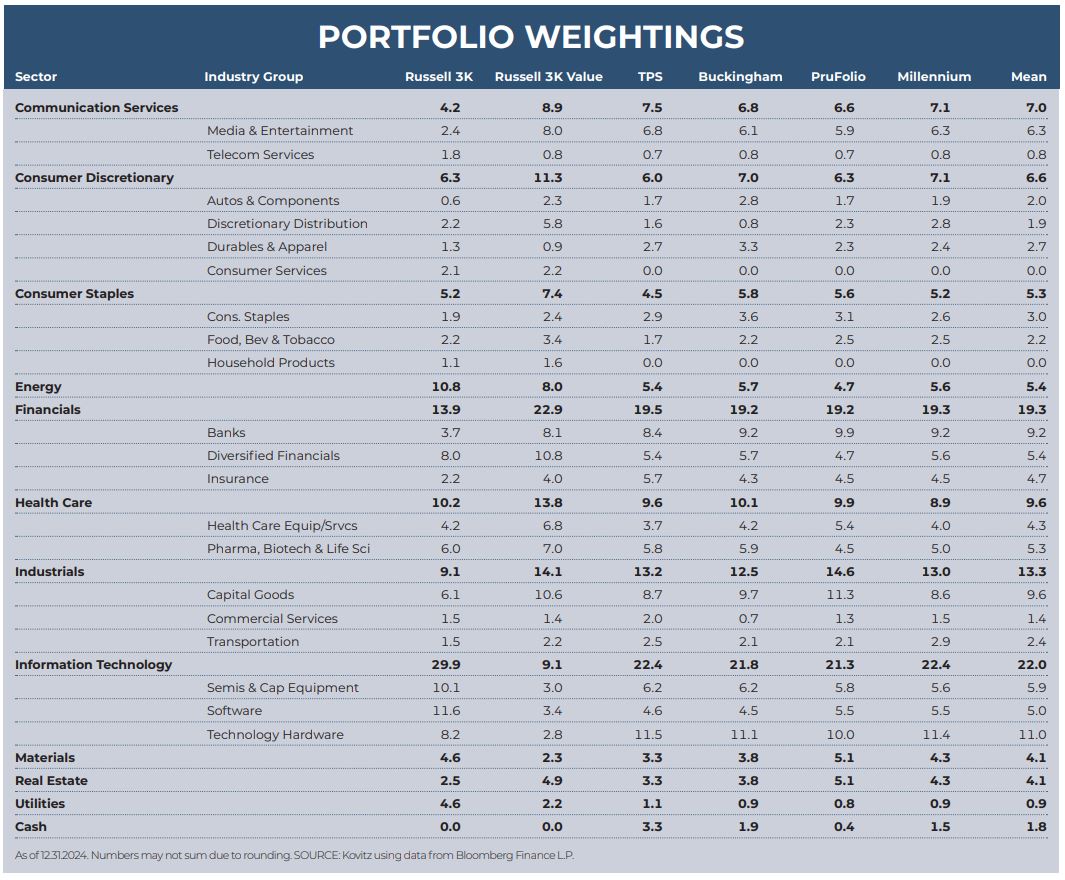
Time again to compare the current sector and industry group weightings of our four newsletter portfolios to those of the broad-based Russell 3000 and Russell 3000 Value indexes, noting that our valuation metrics more closely resemble (and are even more attractive) than those of Value-oriented gauges. While we very much remain bottom-up stock pickers focused on the merits of individual companies, we also keep an eye on the composition of the indexes in order to ensure that we are comfortable in the over- or under-weighting of a particular sector or industry group. As such, we are able to better focus our subjective reviews on the output of the objective new-idea generation screens that we run every day on areas in which we might desire additional exposure, be it to augment a sector with minimal ownership or to add to a particularly undervalued industry.
There is a great deal of art accompanying the science of portfolio construction and sector and industry group weightings are always used as a guide and not as the gospel. Over time, the gaps have narrowed, as we have often added to existing positions in addition to picking up new stocks, but inevitably there will be dispersion across the newsletter portfolios due to the timing of purchases and modest differences in the names held. Still, the same desire for broad diversification, which we think is an important risk mitigation tool, has always been pervasive.
Value vs. Growth Sector Attribution
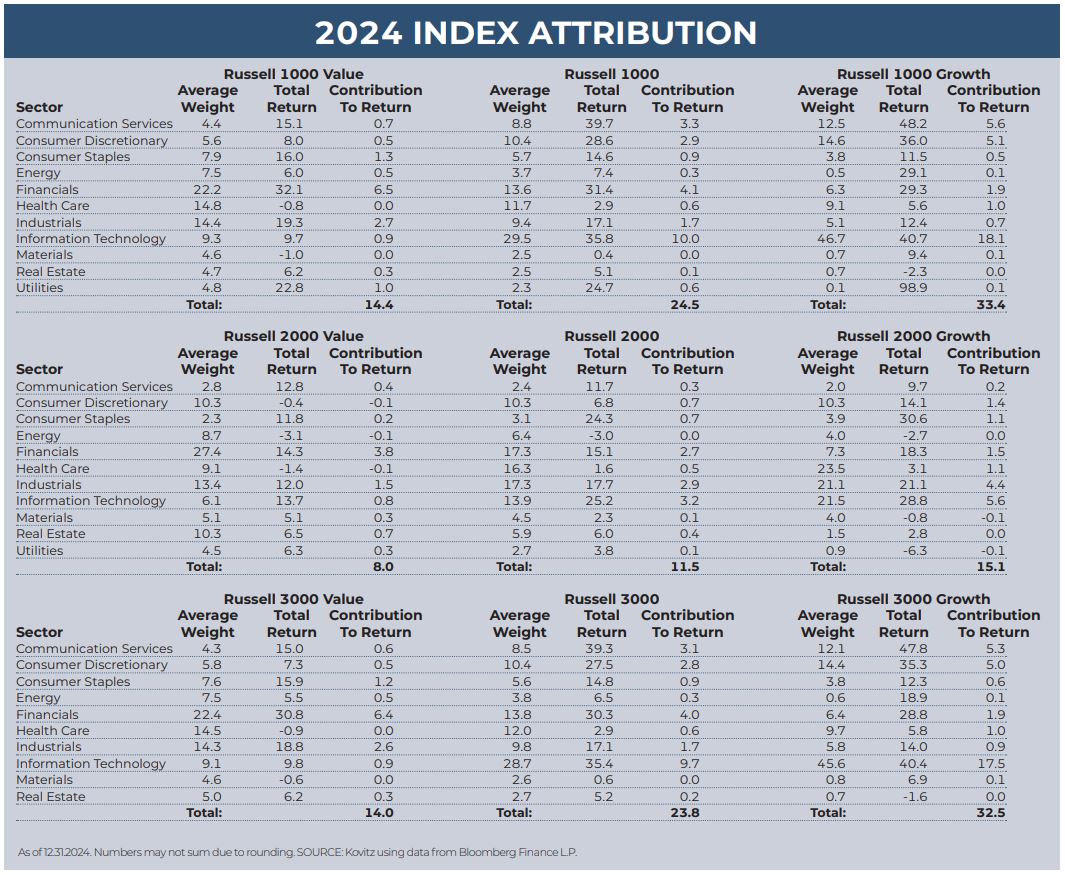
The following two paragraphs hardly do the subject justice, but the simple attribution displayed below helps to better understand which market sectors contributed the most (or least) to index returns. Given our willingness to buy stocks of any market capitalization, we look at the large-cap Russell 1000, the small-cap Russell 2000 and the all-cap Russell 3000 indexes, as well as the Value and Growth versions of each benchmark. We note that our portfolios, with what we believe to be their inexpensive valuations, have long resembled the Value indexes in terms of their financial metrics, even as our sector weightings have more often than not been lighter in Financials and heavier in Information Technology stocks.
There was another large return chasm in favor of Growth for the non-Value large-cap Russell indexes in 2024, thanks mainly to exposure to six (Alphabet, Amazon, Apple, Meta Platforms, Nvidia & Tesla) of the Magnificent Seven. Happily, the large-cap Value indexes posted solid annual returns, in line with their historical norm, led by gains in the Financial and Industrial sectors. The Russell 2000 indexes had weaker relative performance as small-cap stocks lagged their larger cousins pretty much all the way around. The Health Care and Materials sectors generally were poor performers across the indexes, while the Info Tech, Financial and Communication Services sectors fueled the full Russell 1000 and 3000 indexes.
Recommended Stock List
In this space, we list all of the stocks we own across our multi-cap-value managed account strategies and in our four newsletter portfolios. See the last page for pertinent information on our flagship TPS strategy, which has been in existence since the launch of The Prudent Speculator in March 1977.
Readers are likely aware that TPS has long been monitored by The Hulbert Financial Digest (“Hulbert”). As industry watchdog Mark Hulbert states, “Hulbert was founded in 1980 with the goal of tracking investment advisory newsletters. Ever since it has been the premiere source of objective and independent performance ratings for the industry.” For info on the newsletters tracked by Hulbert, visit: http://hulbertratings.com/since-inception/.
Keeping in mind that all stocks are rated as “Buys” until such time as we issue an official Sales Alert, we believe that all of the companies in the tables on these pages trade for significant discounts to our determination of long-term fair value and/or offer favorable risk/reward profiles. Note that, while we always seek substantial capital gains, we require lower appreciation potential for stocks that we deem to have more stable earnings streams, more diversified businesses and stronger balance sheets. The natural corollary is that riskier companies must offer far greater upside to warrant a recommendation. Further, as total return is how performance is ultimately judged, we explicitly factor dividend payments into our analytical work.
While we always like to state that we like all of our children equally, meaning that we would be fine in purchasing any of the 100+ stocks, we remind subscribers that we very much advocate broad portfolio diversification with TPS Portfolio holding more than eighty of these companies. Of course, we respect that some folks may prefer a more concentrated portfolio, however our minimum comfort level in terms of number of overall holdings in a broadly diversified portfolio is at least thirty!
TPS rankings and performance are derived from hypothetical transactions “entered” by Hulbert based on recommendations provided within TPS, and according to Hulbert’s own procedures, irrespective of specific prices shown within TPS, where applicable. Such performance does not reflect the actual experience of any TPS subscriber. Hulbert applies a hypothetical commission to all “transactions” based on an average rate that is charged by the largest discount brokers in the U.S., and which rate is solely determined by Hulbert. Hulbert’s performance calculations do not incorporate the effects of taxes, fees, or other expenses. TPS pays an annual fee to be monitored and ranked by Hulbert. With respect to “since inception” performance, Hulbert has compared TPS to 19 other newsletters across 62 strategies (as of the date of this publication). Past performance is not an indication of future results. For additional information about Hulbert’s methodology, visit: http://hulbertratings.com/methodology/.

Portfolio Builder
Each month in this column, we highlight 10 stocks with which readers might populate their portfolios: Celanese (CE), Healthpeak (DOC), PPG Industries (PPG)

Kovitz Investment Group Partners, LLC (“Kovitz”) is an investment adviser registered with the Securities and Exchange Commission. This report should only be considered as a tool in any investment decision and should not be used by itself to make investment decisions. Opinions expressed are only our current opinions or our opinions on the posting date. Any graphs, data, or information in this publication are considered reliably sourced, but no representation is made that it is accurate or complete and should not be relied upon as such. This information is subject to change without notice at any time, based on market and other conditions. Past performance is not indicative of future results, which may vary.