
Every month, The Prudent Speculator produces a newsletter that includes a market summary, helpful charts and graphs, recent equity market news, economic outlook and specific stock investment strategies focused on value stock investing. This month, we again are adding stocks to our four newsletter portfolios, while our Graphic Detail offers our semiannual look at sector weightings and returns. Note that the entire list is available to our community of loyal subscribers only

Editor’s Note: Sector and Industry Group Weightings and Value vs. Growth
Mark Twain said, “Get your facts first, and then you can distort them as much as you please,” but the American humorist didn’t realize that some folks would skip getting the facts! After all, in a Wall Street Journal Editorial titled The Economy Is Good. Why Don’t People Know It?, noted American Economist and former vice chair of the Federal Reserve Alan S. Blinder wrote: “A Harris poll conducted a few weeks ago for the Guardian found that 49% of Americans believe that unemployment is at a 50-year high, 72% think inflation is increasing, and 56% think the U.S. is in a recession. Not one of these propositions is remotely true. That same poll even found that 49% think the S&P 500 stock market index is down for the year.”
We realize that we are operating in a highly polarized political climate and that polls sometimes tell us more about the pollsters than anything else, while only 2,119 adults were surveyed. Still, the responses are shocking, and it would seem that our oft-cited Vannevar Bush quotation, “Fear cannot be banished, but it can be calm and without panic; it can be mitigated by reason and evaluation,” is today more valuable than ever.
Indeed, with attention spans short and media outlets often biased in their coverage, keeping emotions in check seemingly has never been more difficult. This is why week after week we produce numerous charts focused on the current state of affairs and provide historical evidence for what has happened previously when similar events have occurred or comparable statistics have been registered. As Mr. Twain said, “History doesn’t repeat, but it often rhymes,” so we take great comfort that the admonition that the secret to success in stocks is not to get scared out of them is well substantiated.
That is not meant to suggest that equities will constantly prove rewarding as 5% declines in the Russell 3000 Value index (R3KV) have happened three times per year on average, 10% corrections have hit every 11 months on average and 20% Bear Markets have taken place every 2.9 years. On the flip slide, advances, rallies and Bull Markets have come with similar frequency AND the magnitude of the gains has dwarfed the losses, so much so that Value stocks, as segmented by Professors Eugene F. Fama and Kenneth R. French, have gained 13.8% per annum since the launch of The Prudent Speculator in 1977.
There are no guarantees that the past is prologue, but we note that despite June ending in the red, the R3KV returned 6.6% in the first half of 2024, almost exactly the historical two-quarter norm. True, the grass was greener on the Growth side of the fence, but it was also a whole lot worse for Small Caps, which knocked the average stock in the broad-based Russell 3000 index into the red for the full six months.
Not surprisingly, we always encourage investors to look beyond the headlines as the stock market, meaning the broad-based indexes, had a very good first half of the year, but the market of stocks lagged far behind. Incredibly, the proverbial monkey throwing darts would just as likely have picked a loser as a winner so far in 2024.
Happily, returns this year for our disciplined approach of buying and patiently harvesting inexpensively priced stocks have topped the Value benchmarks. More importantly, we think the basket of stocks we own remain undervalued, while we expect the economy to continue to show OK growth, corporate profits to expand and dividend payouts to rise. Of course, we have been singing this song for more than 47 years, but it has never gone out of tune, for those who have a long-term time horizon.
There have been some scary trips south along the way, but Value stocks have turned in terrific long-term returns, despite slowdowns in the economy, questions about the timing of Fed rate cuts, elevated inflation readings, conflicts around the world, contentious elections and any of the other worries, factual or not, troubling investors today.
“You are entitled to your opinion. But you are not entitled to your own facts.” — Daniel Patrick Moynihan
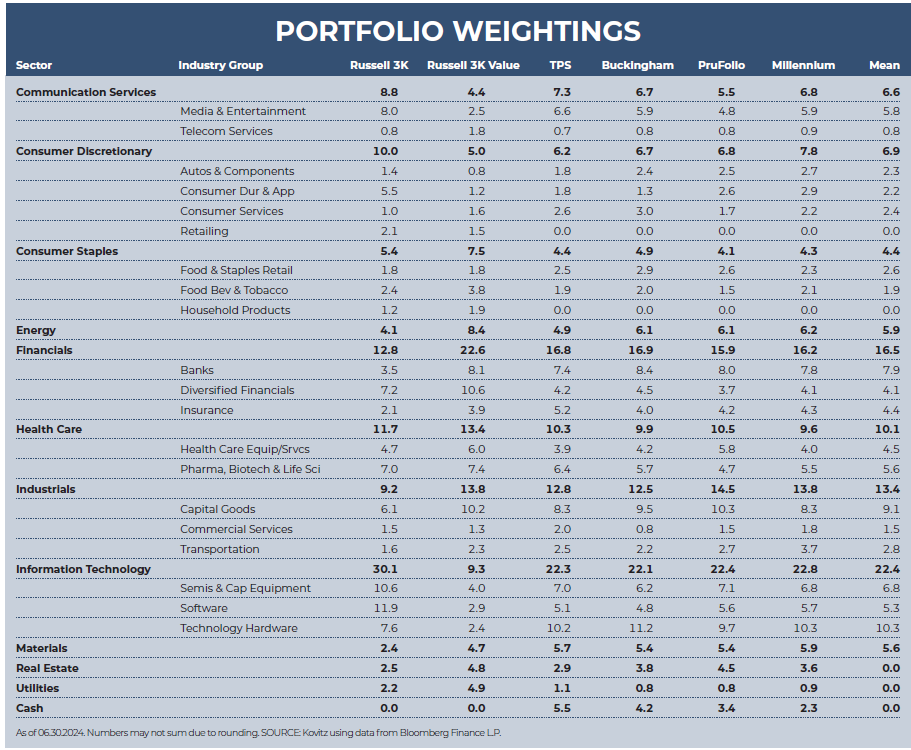
Graphic Detail: Sector and Industry Group Weightings
Time again to compare the current sector and industry group weightings of our four newsletter portfolios to those of the broad-based Russell 3000 and Russell 3000 Value indexes, noting that our valuation metrics more closely resemble those of Value-oriented gauges. While we very much remain bottom-up stock pickers focused on the merits of individual companies, we also keep an eye on the composition of the indexes in order to ensure that we are comfortable in the over- or under-weighting of a particular sector or industry group. As such, we are able to better focus our subjective reviews on the output of the objective new-idea generation screens that we run every day on areas in which we might desire additional exposure, be it to augment a sector with minimal ownership or to add to a particularly undervalued industry. Illustrative of this process were new recommendations in the last nine months of stocks in the Consumer Staples and Energy sectors.
There is a great deal of art accompanying the science of portfolio construction and sector and industry group weightings are always used as a guide and not as the gospel. Over time, the gaps have narrowed, but inevitably there will be dispersion across the newsletter portfolios due to the timing of purchases and modest differences in the names held, even as the same desire for broad diversification has always been pervasive.
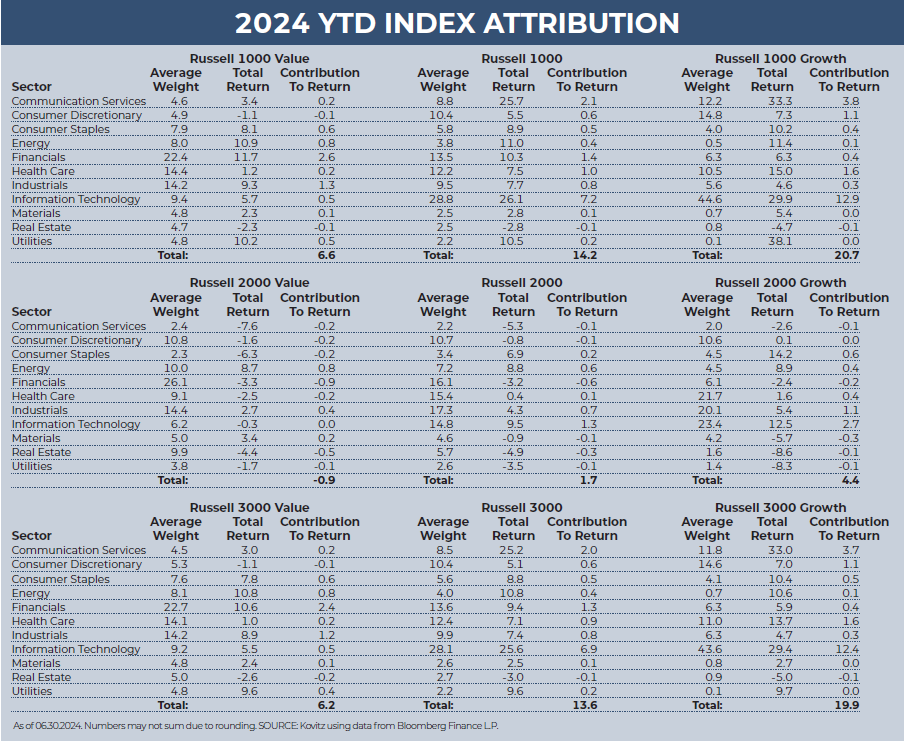
Graphic Detail: Value vs. Growth Sector Attribution
The following two paragraphs hardly do the subject justice, but the simple attribution displayed below helps to better understand which market sectors contributed the most (or least) to index returns. Given our willingness to buy stocks of any market capitalization, we look at the large-cap Russell 1000, the small-cap Russell 2000 and the all-cap Russell 3000 indexes, as well as the Value and Growth versions of each benchmark. We note that our portfolios, with what we believe to be their inexpensive valuations, have long resembled the Value indexes in terms of their financial metrics, even as our sector weightings have more often than not been lighter in Financials and heavier in Information Technology stocks.
There was another large return chasm in favor of Growth for the non-Value large-cap Russell indexes in the first half of 2024, thanks mainly to exposure to six (Alphabet, Amazon, Apple, Meta Platforms, Microsoft & Nvidia) of the Magnificent Seven. Happily, the large-cap Value indexes posted solid six-month returns, in line with their historical norm, led by gains in the Financial, Industrial and Energy sectors. The Russell 2000 indexes had miserable relative performance as Small-Cap stocks struggled pretty much all the way around. The Real Estate and Materials sectors generally were laggards across all of the indexes, while the Info Tech and Communication Services sectors fueled the full Russell 1000 and 3000 indexes.
Recommended Stock List
In this space, we list all of the stocks we own across our multi-cap-value managed account strategies and in our four newsletter portfolios. See the last page for pertinent information on our flagship TPS strategy, which has been in existence since the launch of The Prudent Speculator in March 1977.
Readers are likely aware that TPS has long been monitored by The Hulbert Financial Digest (“Hulbert”). As industry watchdog Mark Hulbert states, “Hulbert was founded in 1980 with the goal of tracking investment advisory newsletters. Ever since it has been the premiere source of objective and independent performance ratings for the industry.” For info on the newsletters tracked by Hulbert, visit: http://hulbertratings.com/since-inception/.
Keeping in mind that all stocks are rated as “Buys” until such time as we issue an official Sales Alert, we believe that all of the companies in the tables on these pages trade for significant discounts to our determination of long-term fair value and/or offer favorable risk/reward profiles. Note that, while we always seek substantial capital gains, we require lower appreciation potential for stocks that we deem to have more stable earnings streams, more diversified businesses and stronger balance sheets. The natural corollary is that riskier companies must offer far greater upside to warrant a recommendation. Further, as total return is how performance is ultimately judged, we explicitly factor dividend payments into our analytical work.
While we always like to state that we like all of our children equally, meaning that we would be fine in purchasing any of the 100+ stocks, we remind subscribers that we very much advocate broad portfolio diversification with TPS Portfolio holding more than eighty of these companies. Of course, we respect that some folks may prefer a more concentrated portfolio, however our minimum comfort level in terms of number of overall holdings in a broadly diversified portfolio is at least thirty!
TPS rankings and performance are derived from hypothetical transactions “entered” by Hulbert based on recommendations provided within TPS, and according to Hulbert’s own procedures, irrespective of specific prices shown within TPS, where applicable. Such performance does not reflect the actual experience of any TPS subscriber. Hulbert applies a hypothetical commission to all “transactions” based on an average rate that is charged by the largest discount brokers in the U.S., and which rate is solely determined by Hulbert. Hulbert’s performance calculations do not incorporate the effects of taxes, fees, or other expenses. TPS pays an annual fee to be monitored and ranked by Hulbert. With respect to “since inception” performance, Hulbert has compared TPS to 19 other newsletters across 62 strategies (as of the date of this publication). Past performance is not an indication of future results. For additional information about Hulbert’s methodology, visit: http://hulbertratings.com/methodology/.

Portfolio Builder
Each month in this column, we highlight 10 stocks with which readers might populate their portfolios: Citigroup (C), General Motos (GM), and Johnson & Johnson (JNJ)

Kovitz Investment Group Partners, LLC (“Kovitz”) is an investment adviser registered with the Securities and Exchange Commission. This report should only be considered as a tool in any investment decision and should not be used by itself to make investment decisions. Opinions expressed are only our current opinions or our opinions on the posting date. Any graphs, data, or information in this publication are considered reliably sourced, but no representation is made that it is accurate or complete and should not be relied upon as such. This information is subject to change without notice at any time, based on market and other conditions. Past performance is not indicative of future results, which may vary.