Two letters hit our mailbox on the same day recently. One proclaimed, “Trump and his agenda are a threat to our democracy. Think about where he and his MAGA extremists would take the country if they won again.” The other countered, “It’s clear that Crooked Joe Biden and the Far-Left are the true threats to our democracy.” No doubt, it will be a brutal run for the White House!
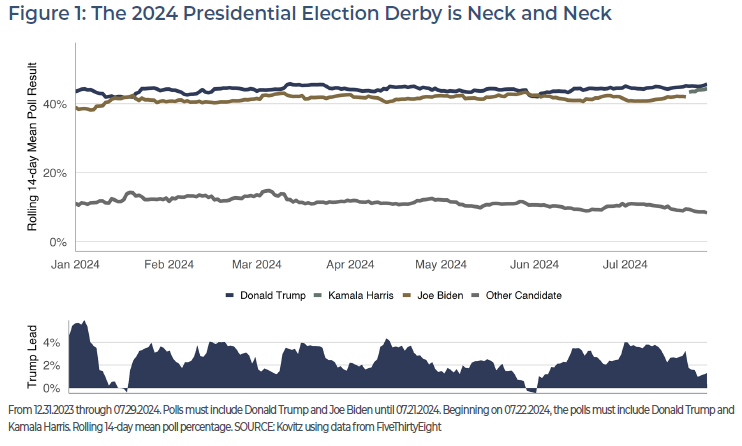
A lot happened in July. On the 13th, an assassin’s bullet nearly took the life of former President Trump. President Biden bowed out on the 21st. A few days later, VP Kamala Harris was anointed to be the Democratic standard-bearer. We expect many more twists and turns lie ahead in the lead-up to November 5. As usual, we offer our unemotional data-driven perspective to help investors navigate the political angst in what the polls are currently showing as a very tight race.
True, past performance is no guarantee of future returns, and some argue the number of data points might be too small, but those thinking about heading for the perceived safety of the sidelines generally have little historical basis for such a move. For example, Value stocks gained 36.6% in 1968, the last time a sitting president (Lyndon B. Johnson) chose not to run for re-election and the same year presidential candidate Robert F. Kennedy was shot and killed.
RETURNS LEADING UP TO ELECTIONS
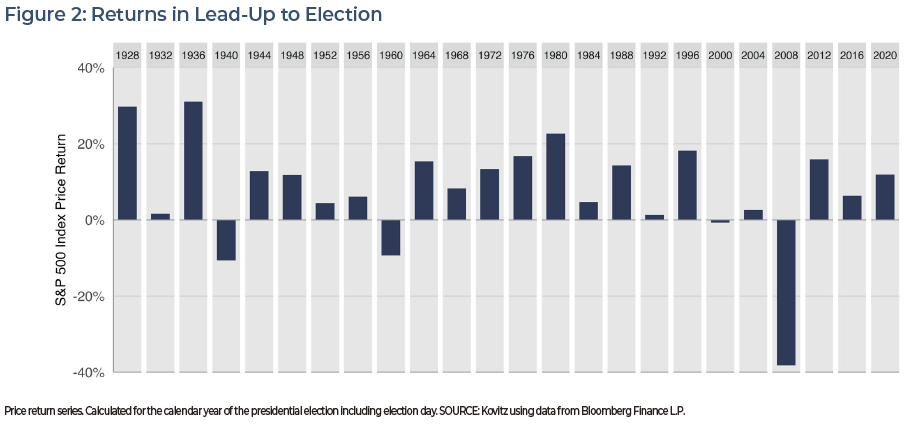
With roughly three months to go until voters head to the polls, the S&P 500 index has risen 14.4%–excluding dividends–through July 26. The gain is well above the 24-election average since 1928 of 7.9%, which includes the massive 38.5% drop during the Great Recession of 2008-2009. The polarization of the current political environment surely worries many, but it would seem that the stock market is again not paying a lot of attention to the drama unfolding in Washington D.C.
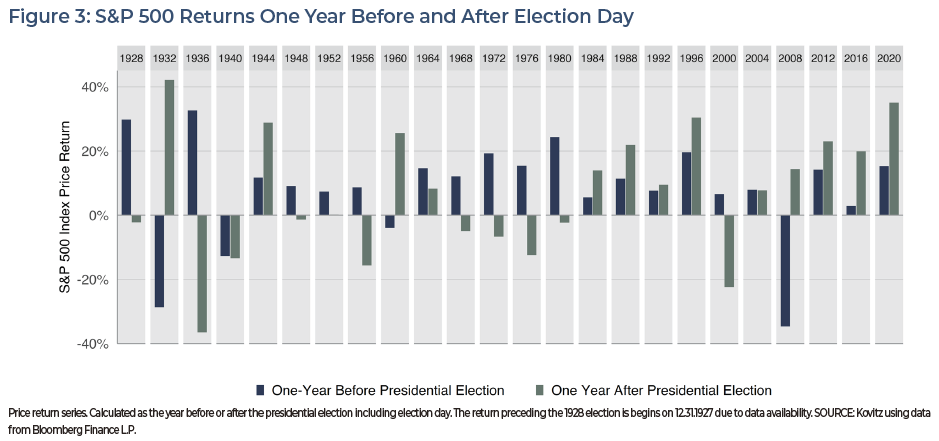
In Figure 3, we chart the S&P 500 price returns in the year leading up to Election Day and for a year following. Interestingly, the average gain preceding the election is 8.2%, while the average for the following year is 6.8%. Considering that those numbers do not include dividends or the effect of reinvested dividends, we think that with few exceptions those who dumped their stocks in preparation or response to an election would have missed out on some healthy returns, while enduring the tax consequences and transaction costs that come with that sort of portfolio churn.
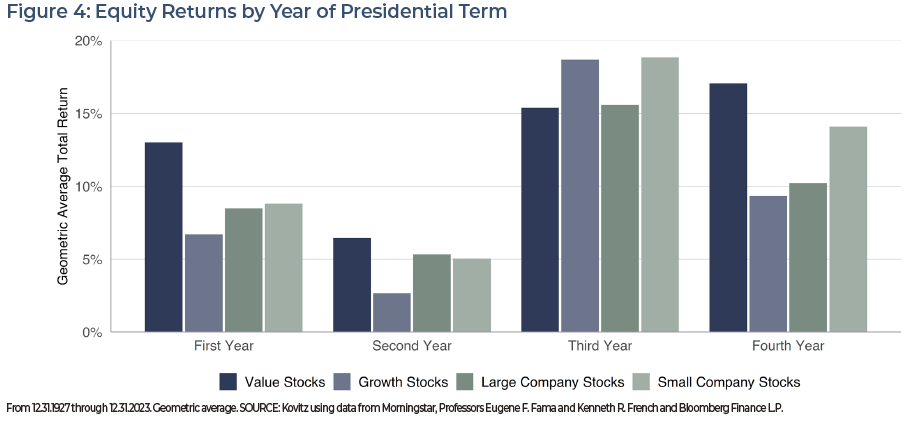
RETURNS BY PRESIDENTIAL TERM YEAR
At least when measured by stock market returns, presidents tend to see stronger third and fourth years than the first two. One school of thought to explain the divergence is that the Commander in Chief is far more willing to upset the proverbial apple cart in attempting to fulfill campaign promises early on, while reelection of person or party compels economic-friendly policies later in the four-year cycle. Of course, first-year returns for Value stocks have been terrific on both an absolute and a relative basis, perhaps propelled by some level enthusiasm for the president’s new (or refreshed) agenda. To be sure, averages may not always tell the whole story considering there are just two dozen annual returns in each group.
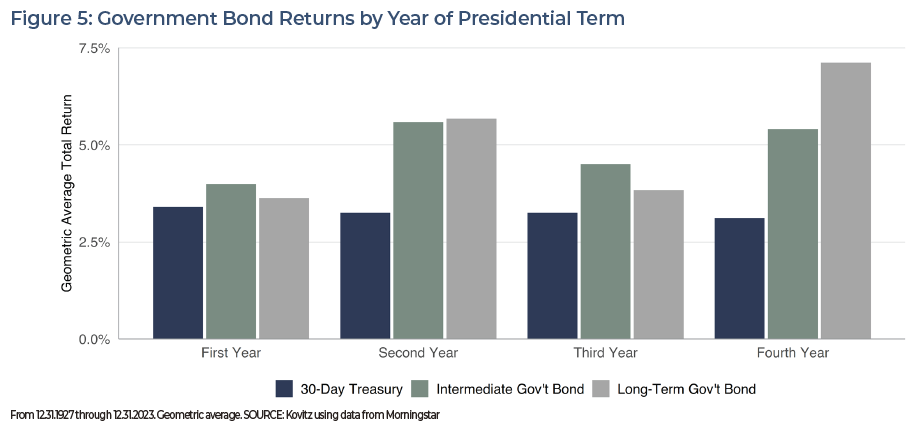
Bonds show more stable trends, perhaps not surprisingly, given the nature of the asset class, with useful investment-related conclusions based on the year of a president’s term hard to draw, especially for shorter-term instruments. As was the case with equities, having just two dozen data points in each group doesn’t help out much and the transaction-related costs that come with equities are often exacerbated in the often less-liquid fixed income universe.
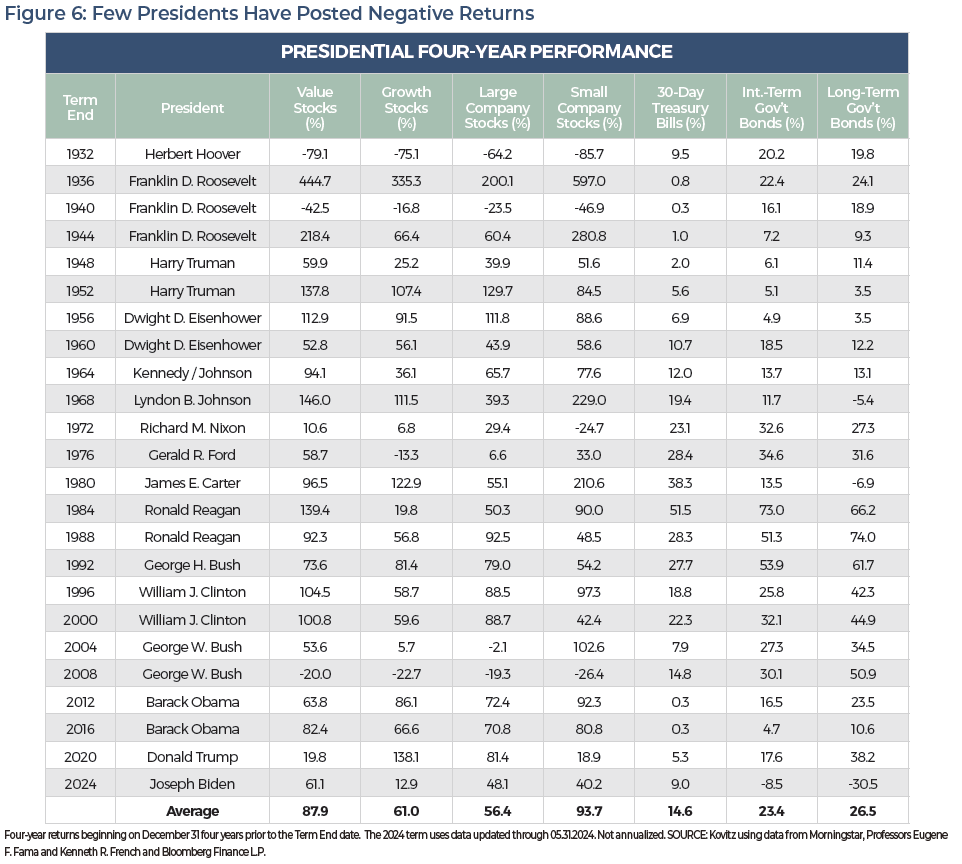
RETURNS BY PRESIDENT
Presidential terms for Herbert Hoover, Franklin D. Roosevelt (Term 2) and George W. Bush (Term 2) are the only three instances
since 1928 where Value stocks posted negative returns. Large Company Stocks (the S&P 500) show a similar trend with the inclusion of a -2.1% S&P 500 return for George W.’s first term. Hoover and Bush were Republicans, while Roosevelt was a three-term Democrat. It’s hard to say that means anything though—the president or the party— because there are other reasons to explain the investment returns that do not directly involve the sitting president.
For example, in 1932, the U.S. was in the midst of the Great Depression. Roosevelt’s second term included World War II, while George W.’s first term included the terrorist attacks on September 11 and the second term included the Great Financial Crisis. On the bond side, all returns have been positive, even if only modestly so, except for two. In the late 1960’s the Effective Federal Funds Rate rose quickly from 4% to 10%, harming long-term investors. Similar interest rate action caused monster losses for long-term bond investors coming out of the COVID-19 pandemic. We suspect we could work through each president’s positive returns, too, and come up with an apolitical explanation for success, perhaps more than one.
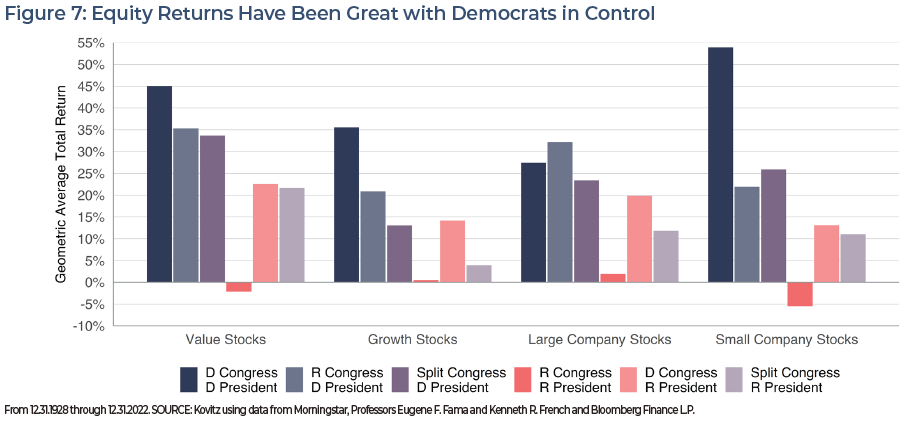
RETURNS by CONGRESS
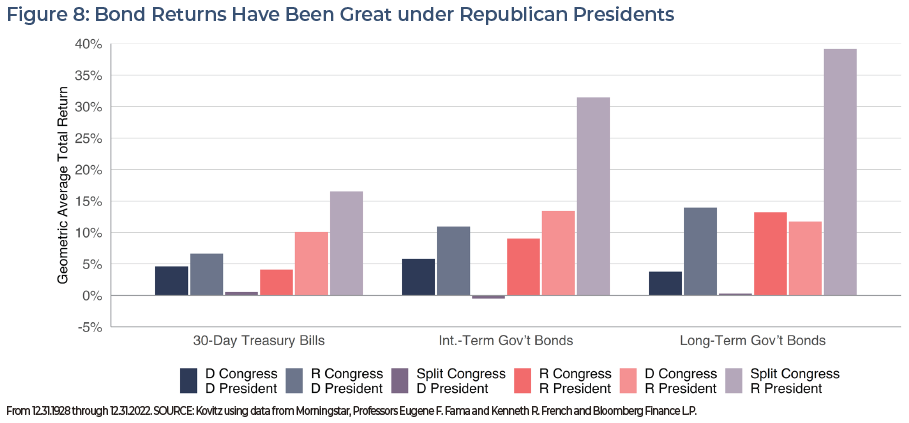
Perhaps Congress is more impactful, at least when it comes to investment returns? Actually, Figures 7 and 8 show a pronounced trend based on the composition of Congress. The charts are dramatic, with the message practically jumping off this paper that equity investors should cheer loudly when Democrats are fully in the driver’s seat of the U.S. government and bond investors should cheer equally loudly when the U.S. has a Republican president with a split Congress. Not so fast. The underlying data shows the trends are not very robust.
There are only three two-year periods with a Republican in the White House and a split Congress. Even though we’ve crunched almost 100 years of data to create the chart, which is a substantial time window, it seems perilous–or even reckless–to change an investment allocation based on just six of those years. A somewhat more robust conclusion would be to invest when the Democrats are in full control since there are 34 years of investment data under that setup, but we are not at all convinced that means we should dump our stocks and bonds when the Democrats are not in control.
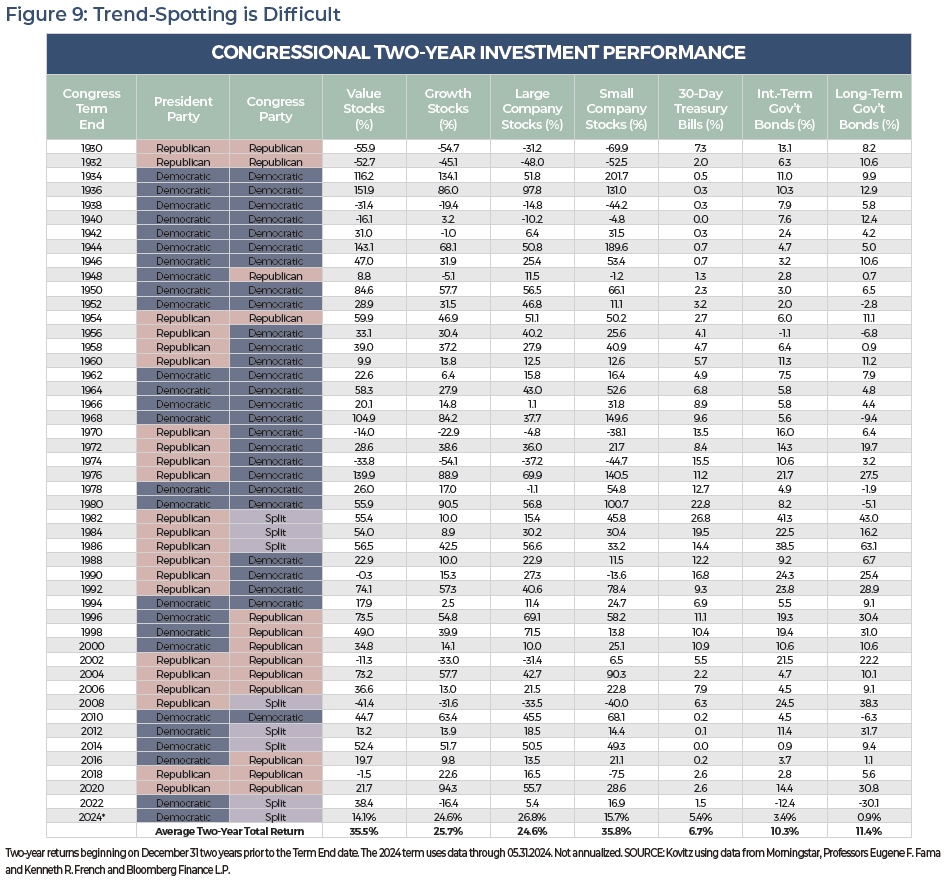
TWO-YEAR RETURNS BY CONGRESS
Diving deeper into the evidence, we offer the granular data that helped create Figures 7 and 8. It’s important to note that Figure 9 presents two-year returns. Since Congress runs from January through December, we approximated returns using month-end dates. For example, returns for the two-year period labeled 2022 began on December 31, 2020 and ended December 31, 2022, while the 117th Congress was in session from January 3, 2021 through January 3, 2023. Better, in our view, to approximate with month-end number crunching than use a much-shorter time horizon and daily data.
Admittedly, the table has a lot of stuff on it, probably too much. There are some important take-home points. The first is the idea that equity returns can be explained by factors other than the sitting president or congressional leadership. Elections certainly will have consequences, but Corporate America has proven remarkably resilient no matter the political outcome, not to mention wars, pandemics and other crises that have befallen the nation over the past century. The second is that the state of health & wealth, inflation levels and other economic indicators may actually be predictive of election outcomes.
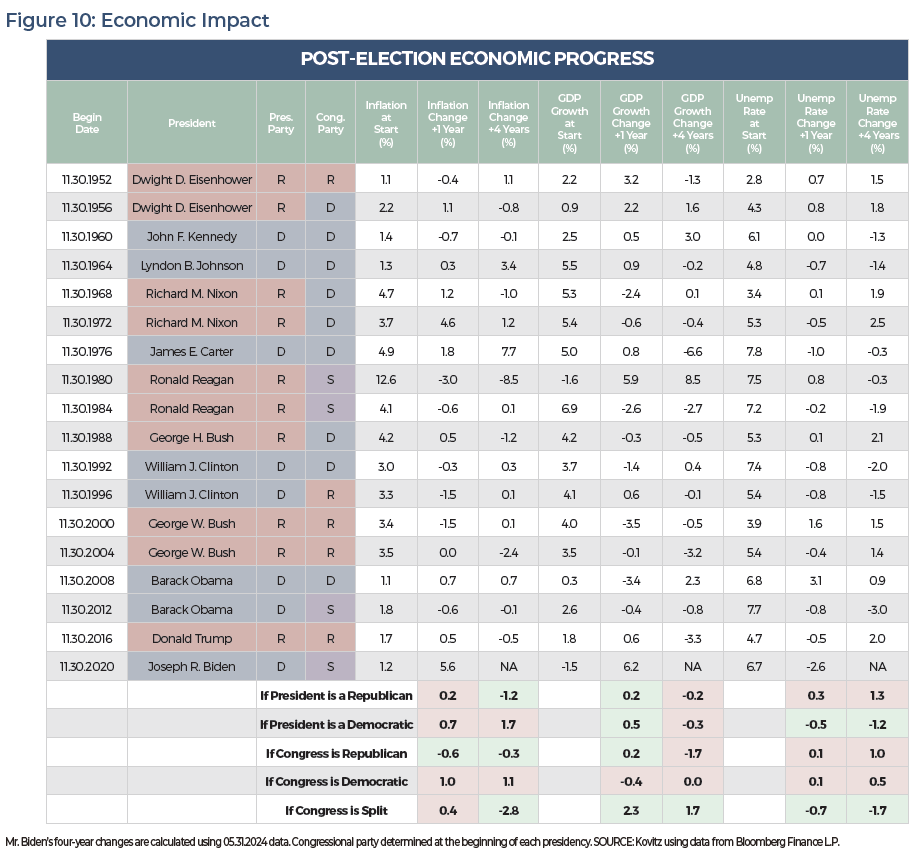
ECONOMY BY PRESIDENT & CONGRESS
Speaking of the economy, in Figure 10, we chart a (non-exhaustive) set of economic factors with corresponding presidential and congressional party control. The results are mixed. On the inflation (Consumer Price Index for Urban Consumers, All Items) front, Republican presidents and congresses tend to reduce it on average. GDP (U.S. Chained Dollars Y-o-Y Change) growth tends to come strong out of the gate in most regimes before slowing down towards the end, though not necessarily turning negative. Unemployment rates rise with Republicans in the Oval Office.
In any case, aggregate figures are quite healthy for America. At the beginning of every term listed below, the average inflation rate is 3.3% (with Ronald Reagan’s initial print of 12.6% in 1980 pushing the average 0.6% higher). GDP growth has averaged 3.0% with Reagan and Biden the only two presidents inheriting contractions. Meanwhile, the unemployment rate averaged 5.7%, with Ronald Reagan joining every Democrat except Johnson in lowering the rate during at least one of their terms.
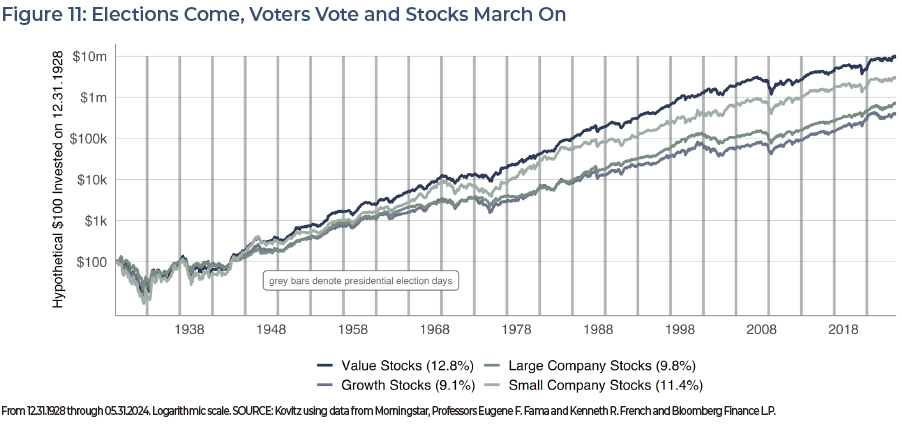
LONG-TERM PERFORMANCE
America’s day at the polls is fast approaching, falling this year on November 5, a Tuesday as is the custom. While the country will endure a lot of stress on Election Day (and in the lead-up), there have been many election
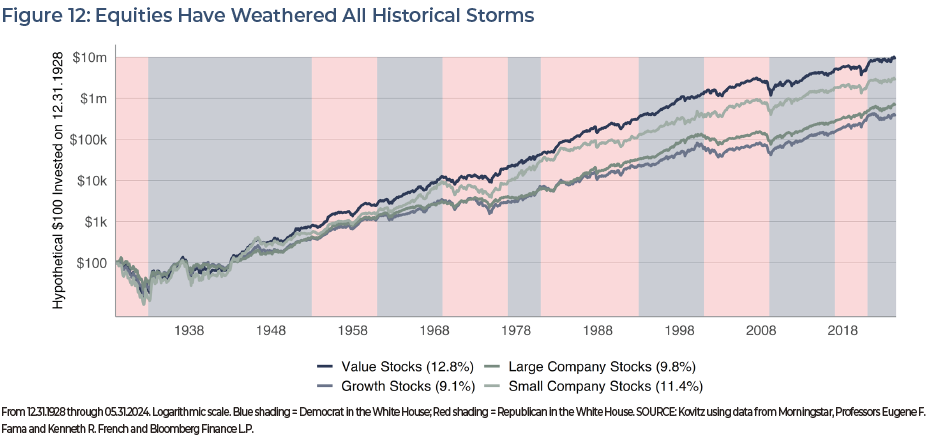
days since gaining independence in 1776. While the stock market’s current form is hardly reminiscent of its earliest days, returns since 1928 (the years in which reliable data are available) shows handsome gains with Value leading the pack.
In Figure 12, we chart equity returns over the past almost-century, laying the color of the president’s affiliated political party underneath the line chart: blue for Democrats and red for Republicans. Even though it may feel like the right thing to do to dump stocks when the party in the White House changes to the ‘wrong’ side, the chart shows the party affiliation can remain on one side for long periods of time (such as in the 1930’s and 1940’s) or it can flip-flop quickly, as it has done recently. In any case, investors would be wise to manage their investments with the rule that they’ll remain in stocks no matter the party occupying the Oval Office. We might even argue one should stay invested if ChatGPT takes over in the Oval Office!
OUR VOTE: DON’T CHANGE COURSE
Many folks are fretting that a win for the other party will spell trouble. No doubt accentuated by broadcast, print and social media, the list of worries seems to be growing. No matter the side of the aisle, it is hard to shake a general feeling of angst. However, we have yet to see a period, especially a prolonged one, where investing with politics as the criteria works out. In fact, we need only look back 8 years for an example of where trading on politics was costly. On November 8, 2016, exit polling showed Hillary Clinton beating Donald Trump. The S&P 500 index rose 0.4% that day, but when the votes were tallied in the late evening and showed Mr. Trump as the winner, the equity futures quickly limited down at a 5% drop.
Yet when the exchanges opened on November 9, the S&P was barely down and went on to end the day with a 1.5% gain. And, despite fears that President-Elect Mr. Trump might somehow ruin the world, the S&P climbed 81% while he was in the White House. The same observations might have been made with President Biden, but investors in the S&P saw gains of 48% from December 31, 2020 through May 31, 2024, while stocks in Professor’s Fama and French Value portfolios rose a robust 61%.
We’ll see what the remainder of Mr. Biden’s presidency brings, but almost a century of market history show that the S&P has managed a decent average annual return of 8.1% in the first calendar year of the Presidential Cycle, though 2001’s 11.9% drop is a weight on that figure. Happily, Value Stocks have beaten Growth by a score of 13.0% to 6.7% in the first-year performance derby, while bond returns have risen recently, much to the pleasure of those more risk averse with income needs.
We believe that we are likely to encounter additional volatility on both sides of the election as America chooses a direction for the next four years. However, it should come as little surprise that the only endorsement we will offer is in support of a broadly diversified portfolio of undervalued stocks to be held for its long-term appreciation potential, no matter who is in power in D.C. Obviously, anything can happen as we move forward, but we remain as excited as ever for the prospects of America and for our investments. We even published a Special Report in
May that showed a path for the Dow Jones Industrial Average to hit the 1 Million point mark in this century, while we routinely remind our readers, clients and ourselves of the late Charlie Munger quotation, “The first rule of compounding: Never interrupt it unnecessarily.”