Investment Insight: The 2025 Visual Guide to the Market

2024 was a year for the history books. Donald Trump was re-elected after two assassination attempts. President Joe Biden dropped out of the presidential derby late in the election race. Hurricanes Beryl, Helene and Milton caused widespread damage. Spirit Airlines, Jo-Ann Stores, Big Lots and Red Lobster were among a slew of large corporations that filed for bankruptcy protection.
The doom & gloom crowd, who have long wanted folks to join them on the sidelines on account of impending disaster, again missed out on substantial market gains. In 2024, the upswell was primarily driven by another wave of enthusiasm for Artificial Intelligence (A.I.). Investors piled mountains of cash into a handful of Tech stocks, including Nvidia, which started 2024 with a $1.2 trillion market value and ended with a $3.3 trillion value.
Concurrently, investors impatiently awaited several rounds of interest rate cuts in 2024. On December 31, 2023, Bloomberg’s futures model estimated 7 cuts and a -1.75% reduction in interest rates by January 2025. As it turned out, the first round of cuts did not end up arriving until August. The risk-free rate has ‘only’ dropped 1.0% from the high and Bloomberg’s current model expects a further reduction of a paltry 0.6% by January 2027.
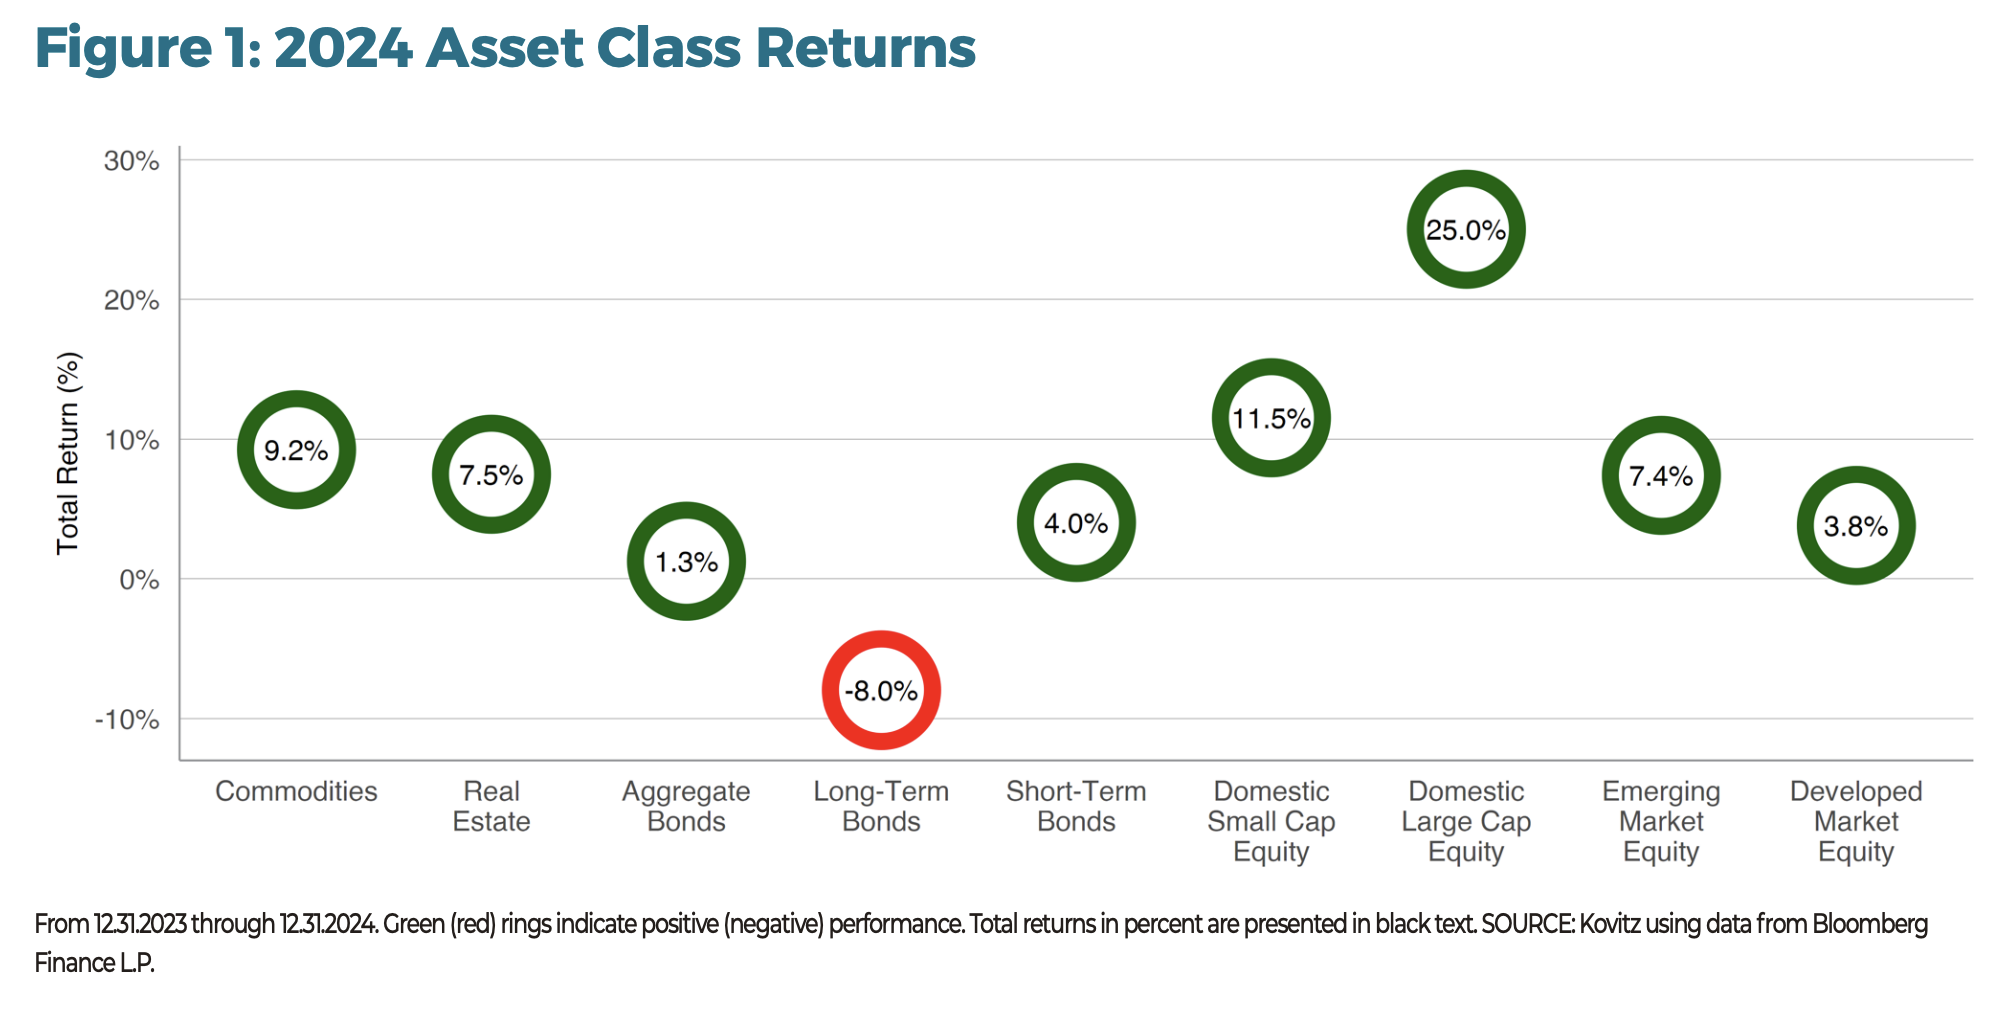
Inflationary pressures have calmed somewhat, the labor market remains strong and, despite all the noise, the U.S. economy continues to hum along. Yes, there are always potential headwinds, and we are braced for continued uncertainty, but we cannot be disappointed with the positions in our broadly diversified portfolios or the American economic engine in general.
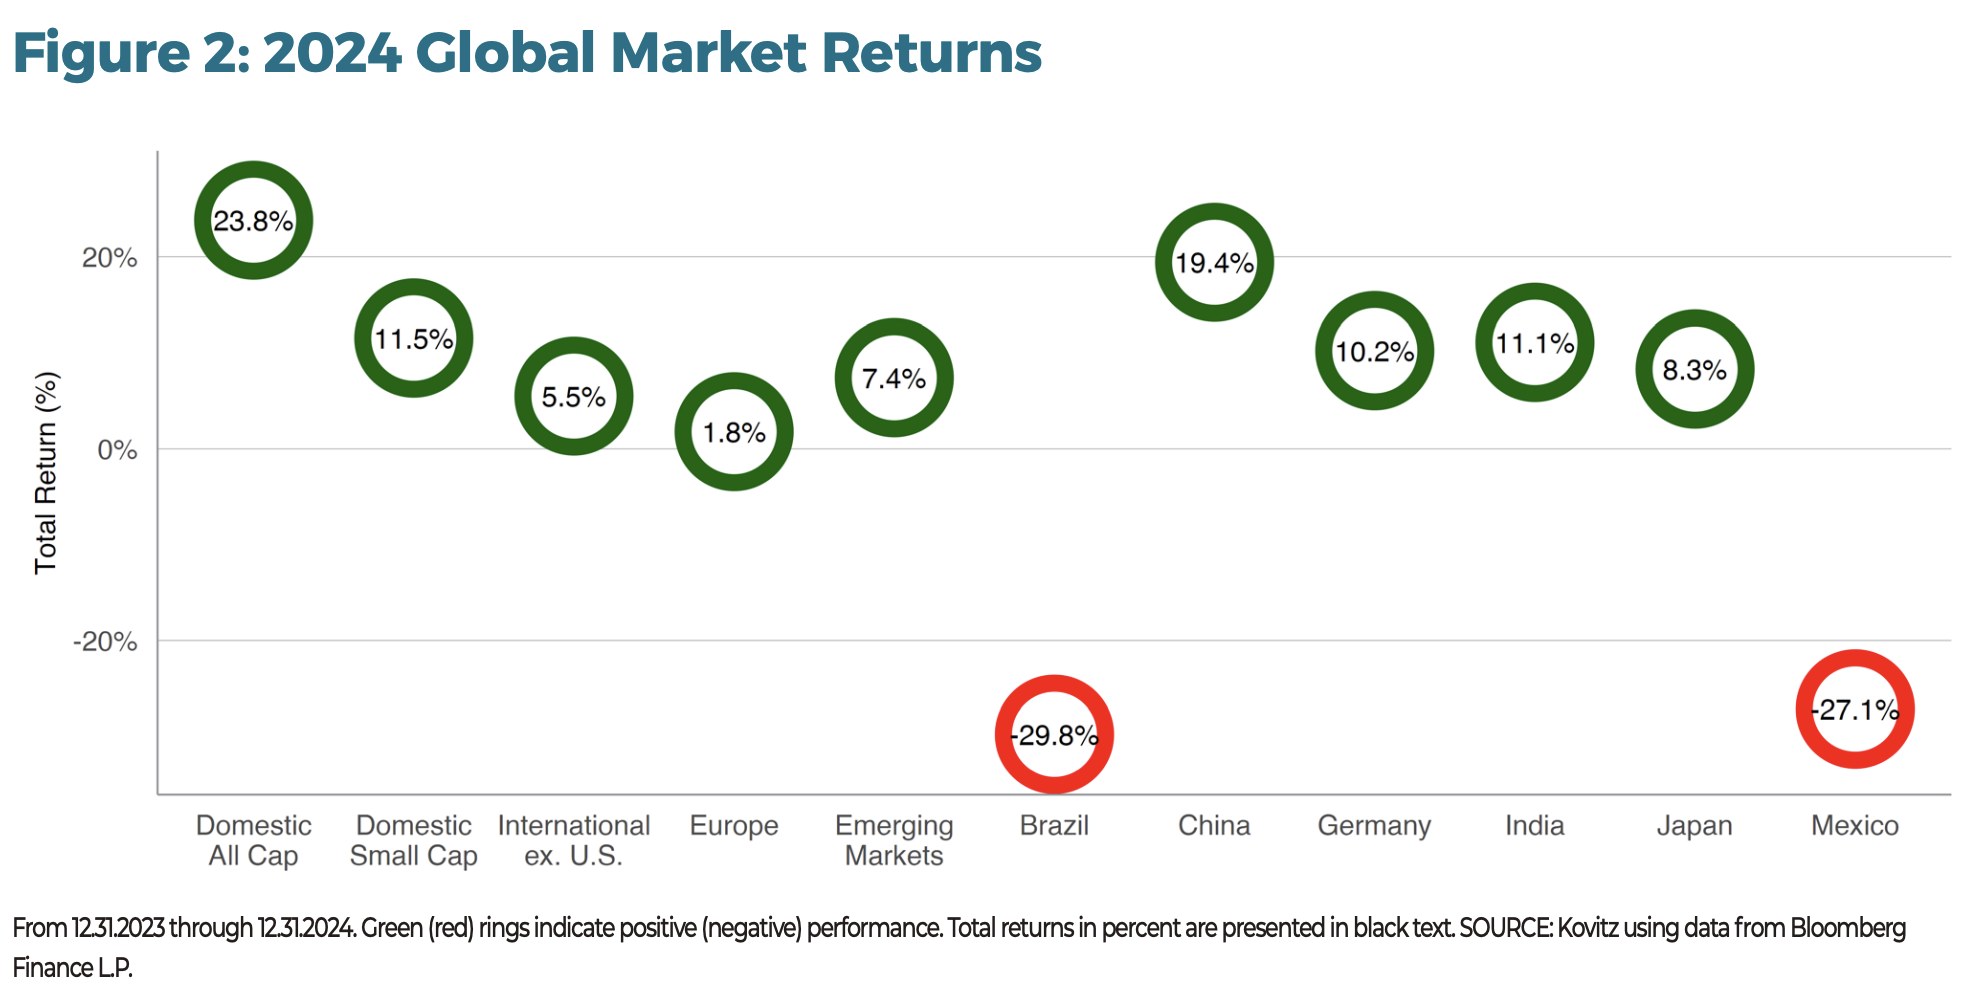
Global Market Returns
American equity returns, represented in Figure 2 by the All-Cap Russell 3000 index, fared well against other regions and countries. A resurgence in interest and Beijing support for the Chinese economy resulted in a 19% gain for the country’s MSCI index. Domestic Small-Caps beat most country returns, including those of Germany, India and Japan. Laggards like Brazil and Mexico suffered from geopolitical challenges and economic headwinds, resulting in sharp losses.
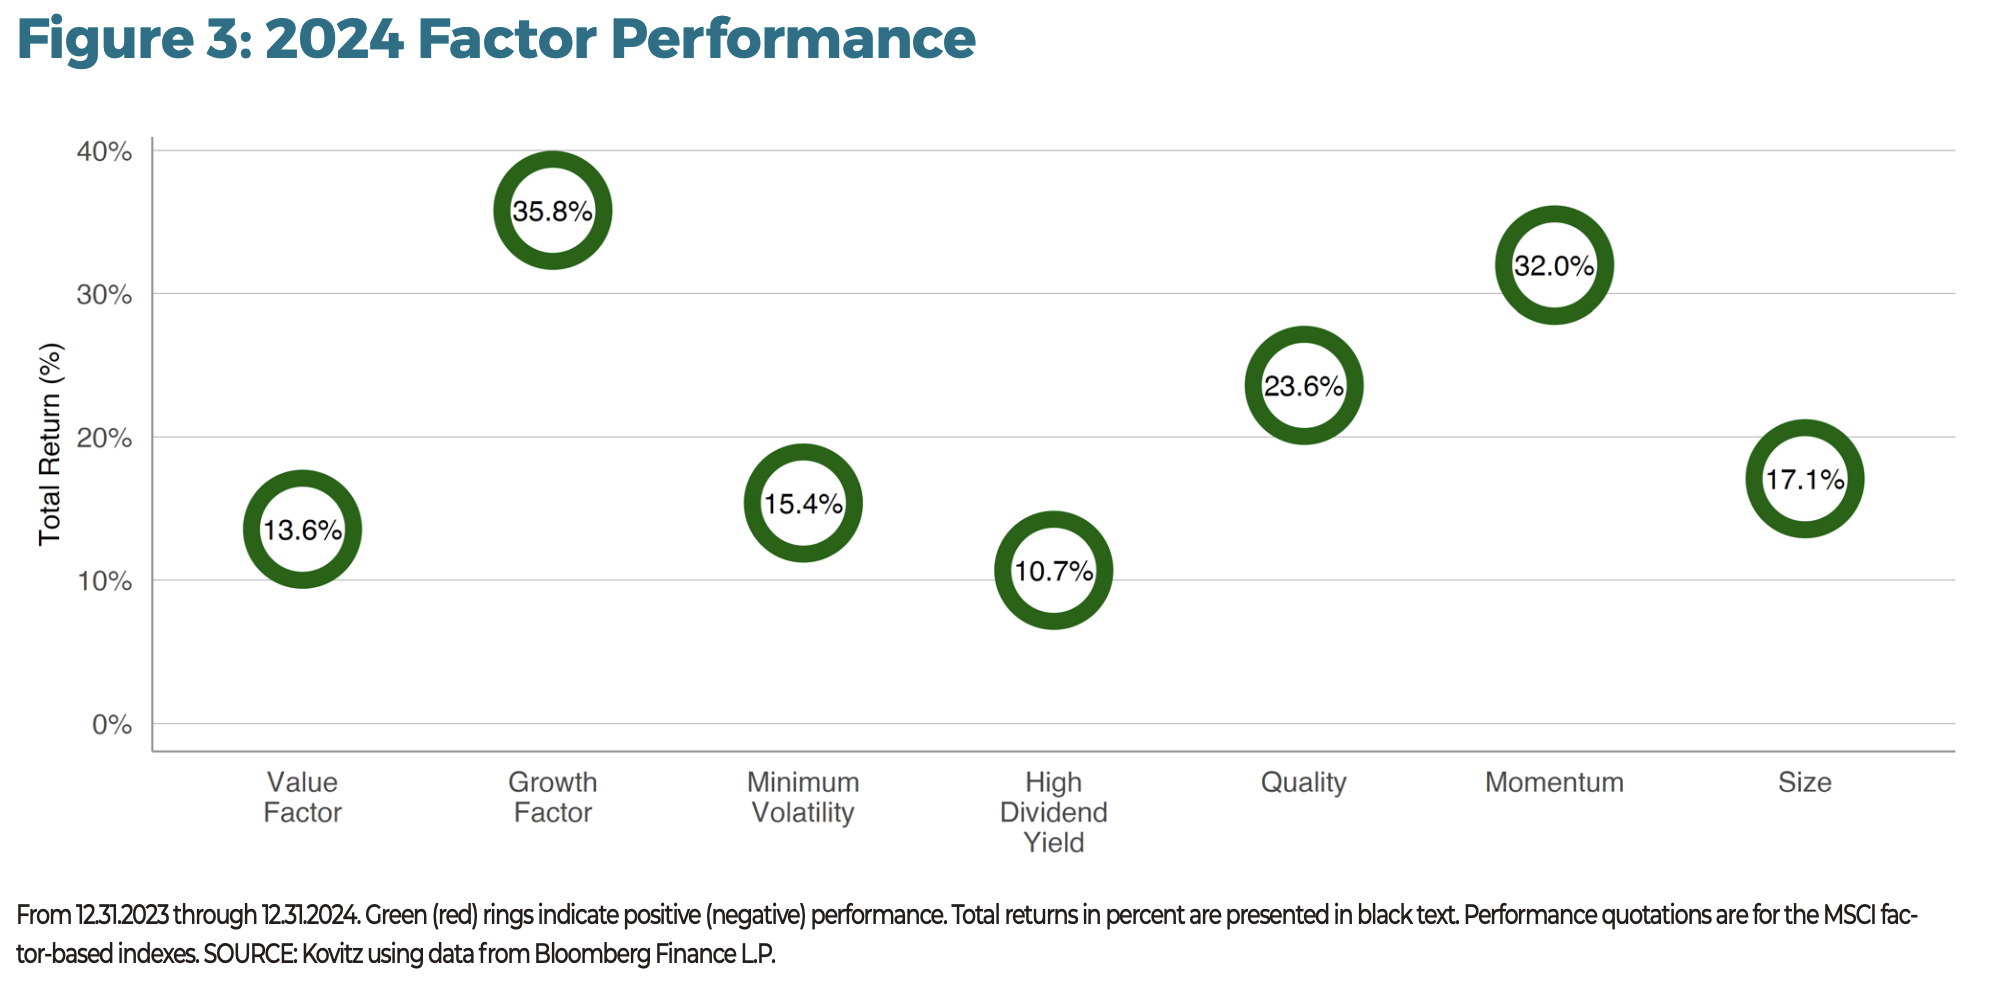
Factor Returns
Value stocks struggled to keep up with Growth stocks in 2024, even as the former have handsomely led the long-term performance derby. Quality and Momentum turned in banner years, making it seem like the above-average returns from High-Yield, Minimum Volatility and Size factors were weak. Having managed Value-oriented portfolios since 1977 with success, we think investors who make factor-based investments are better suited to longer holding periods.
A Record-Setting 2024
Markets will turn as they will, often without discernible reason or provocation and with great consequence-positive and negative-to participants.
DISAGGREGATING RETURNS
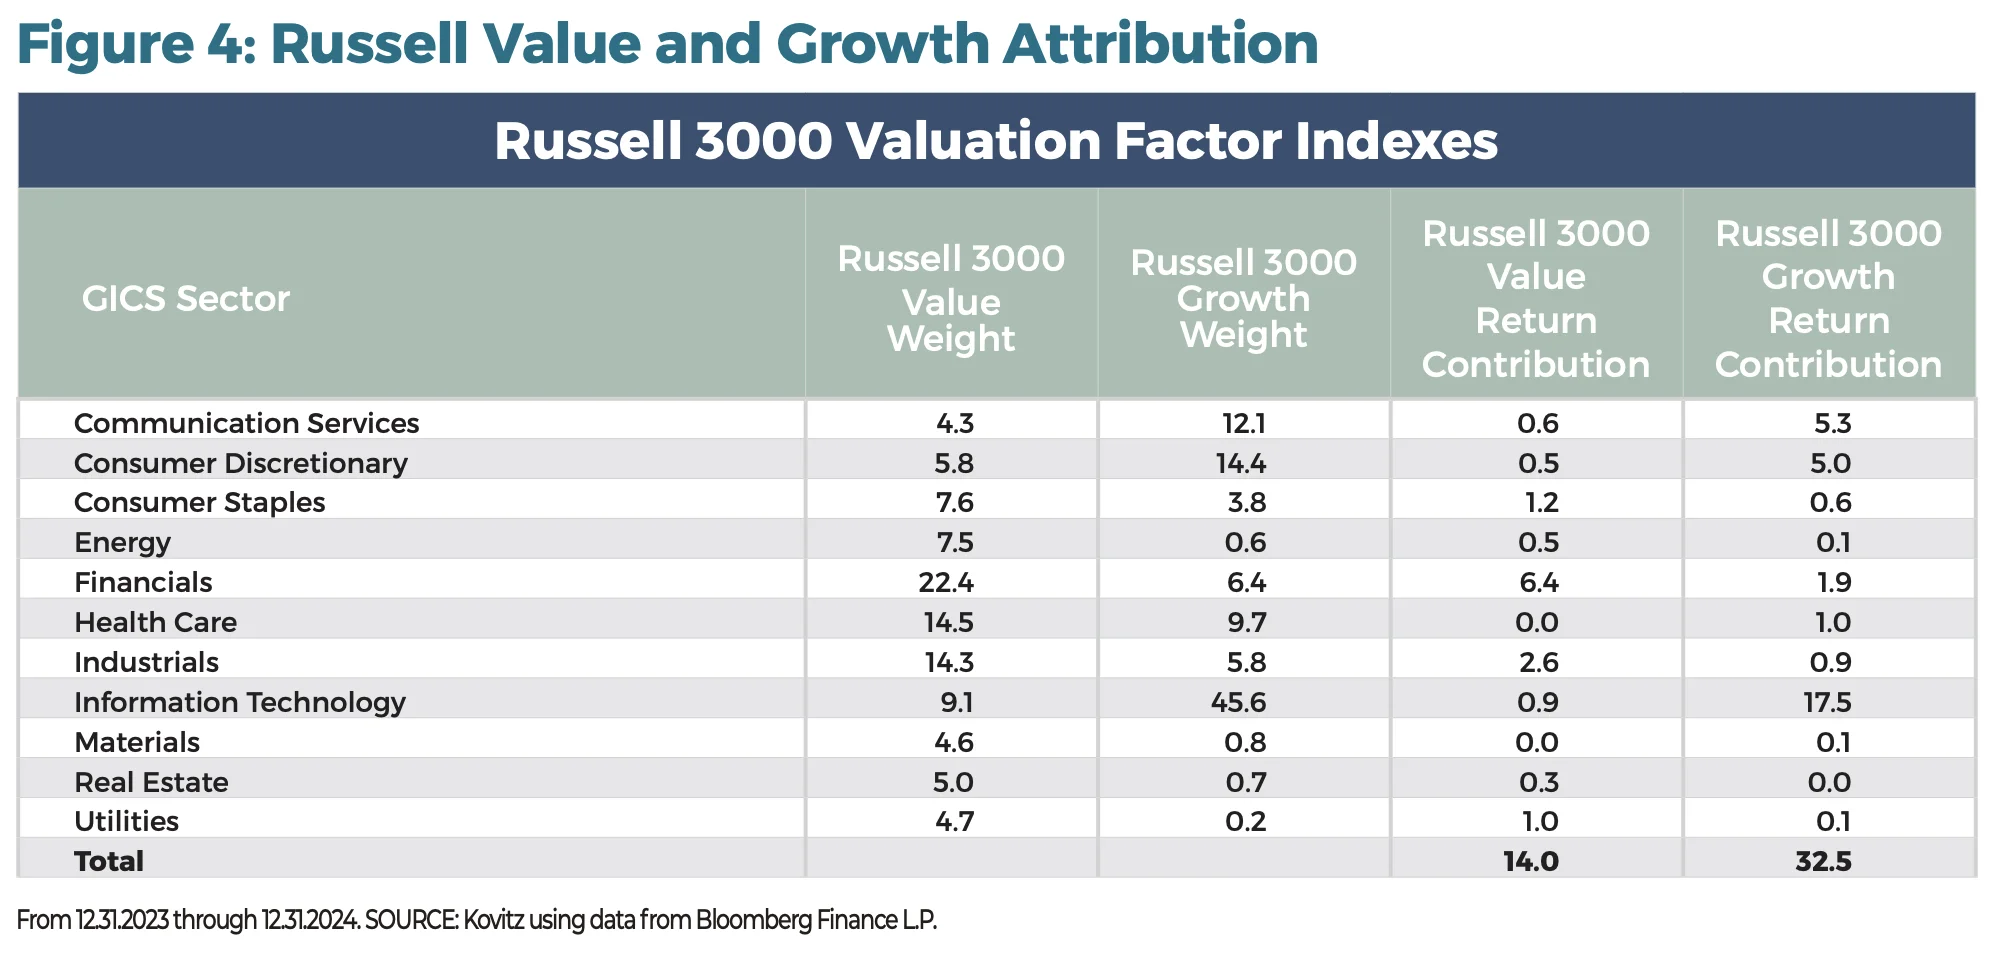
In Figure 4, we present Russell 3000 Value index and Russell 3000 Growth index attribution (a tear-down of returns) for 2024.
Comparing average sector weights in the second and third columns, the Value index has relatively large weights in all sectors but three: Communication Services, Consumer Discretionary and Information Technology. Over the last decade, Tech’s representation in the Growth index has grown from 19% to 46%, while Energy, Industrials and Materials weights have dwindled due to relative underperformance and shifting constituent valuations.
Return contribution is a sector’s weight multiplied by the return. Aggregated, it is the index’s overall performance. Large contributions to return are possible with high returns or heavy weights. In the case of Tech stocks in 2024, the 46% weight and 40% return resulted in an outsized impact on Growth’s overall return. Large weights and stellar performance for Comm. Services and Consumer Discretionary stocks further widened the gap between Value and Growth.
EQUITIES (TEMPORARILY) FALL
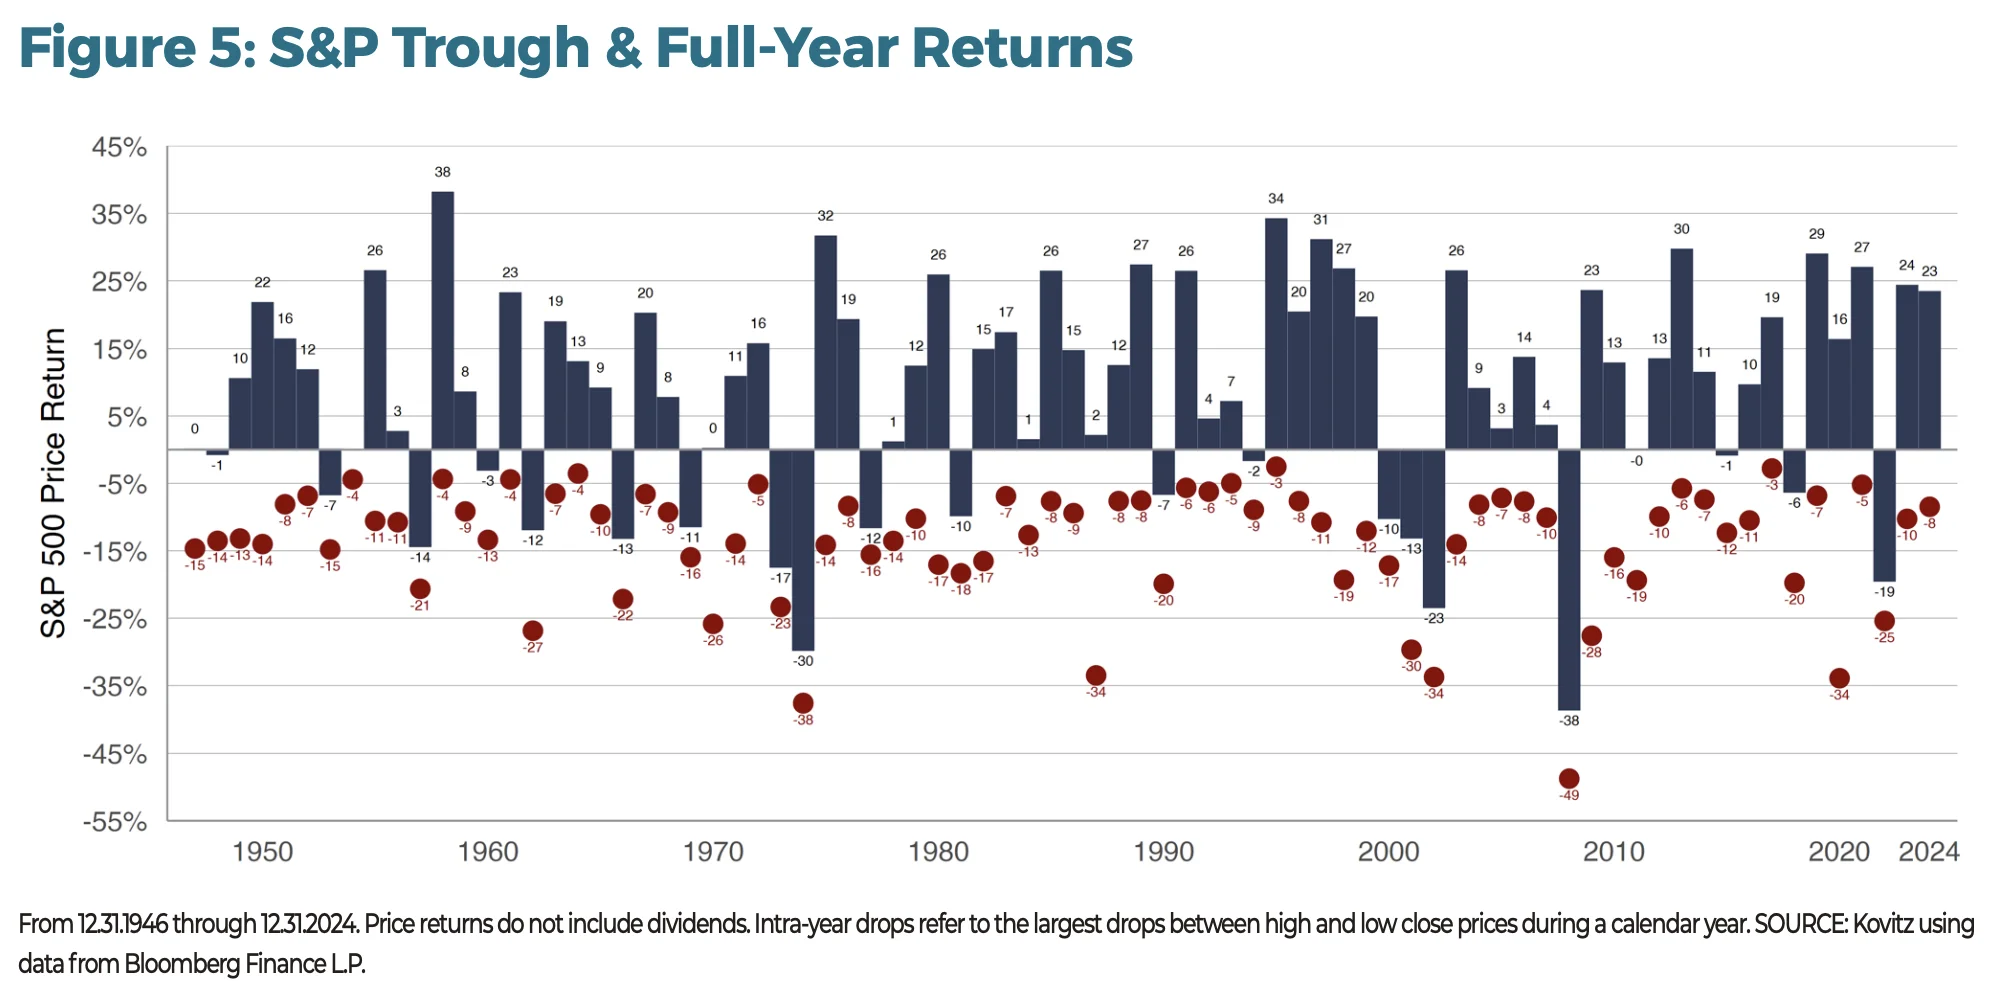
A great illustration of annual stock market gyrations is offered in Figure 5. Red dots mark the low point each year (peak to trough). Navy bars are the final price return for that year. In no year did the S&P finish at its low point and full-year returns turned in an average price return of 9.2%, well above the average loss at some point during the year of 13.7%. “Buy the Dip” is market advice as old as time, but investors are not usually eager to catch falling knives when the time comes.
RECORD-SETTING DAYS
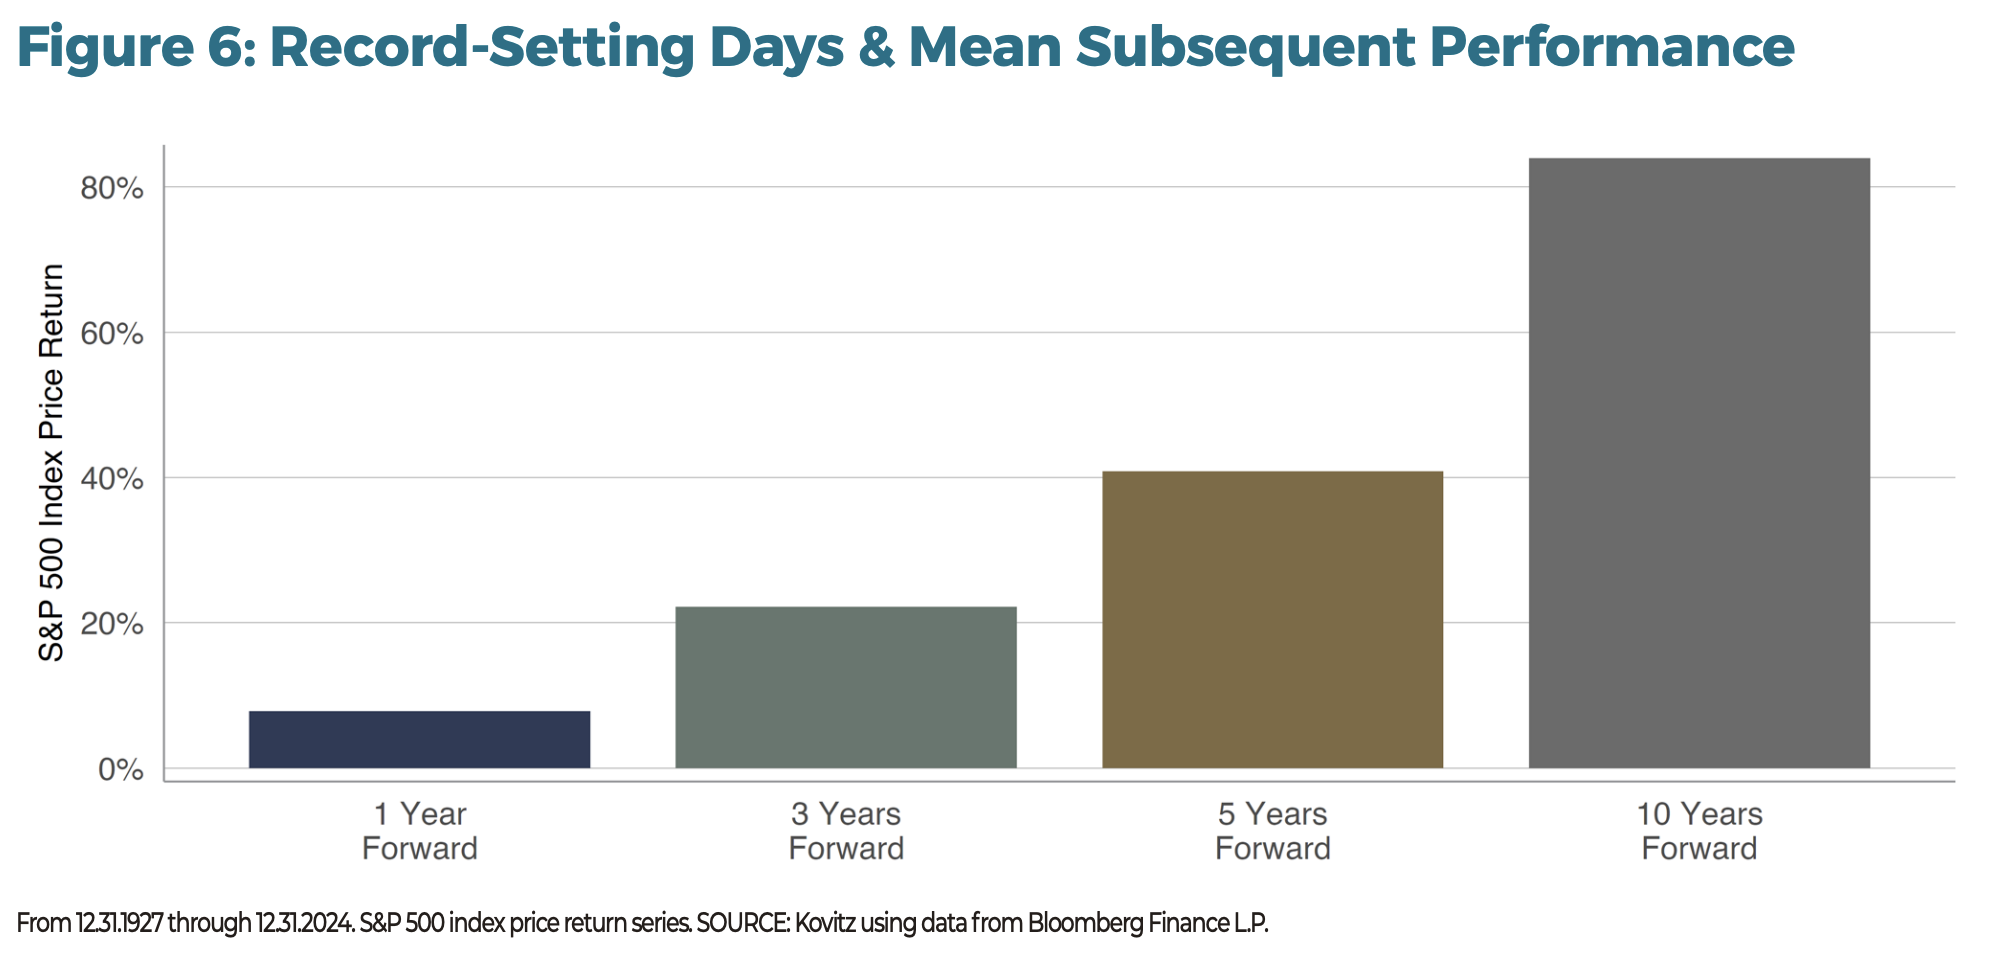
In 2024, there were 57 record-setting days, including ten that came after the presidential election on November 5. It’s not necessarily intuitive, but investing around market peaks is a solid investment strategy, even as we’d argue that any day is a great day to invest. In Figure 6, we show returns subsequent to market peaks. The mean one-year return after a market peak is 7.8% (excluding dividends!). The figure grows to an average of 84% looking out a decade.
ESCALATOR UP
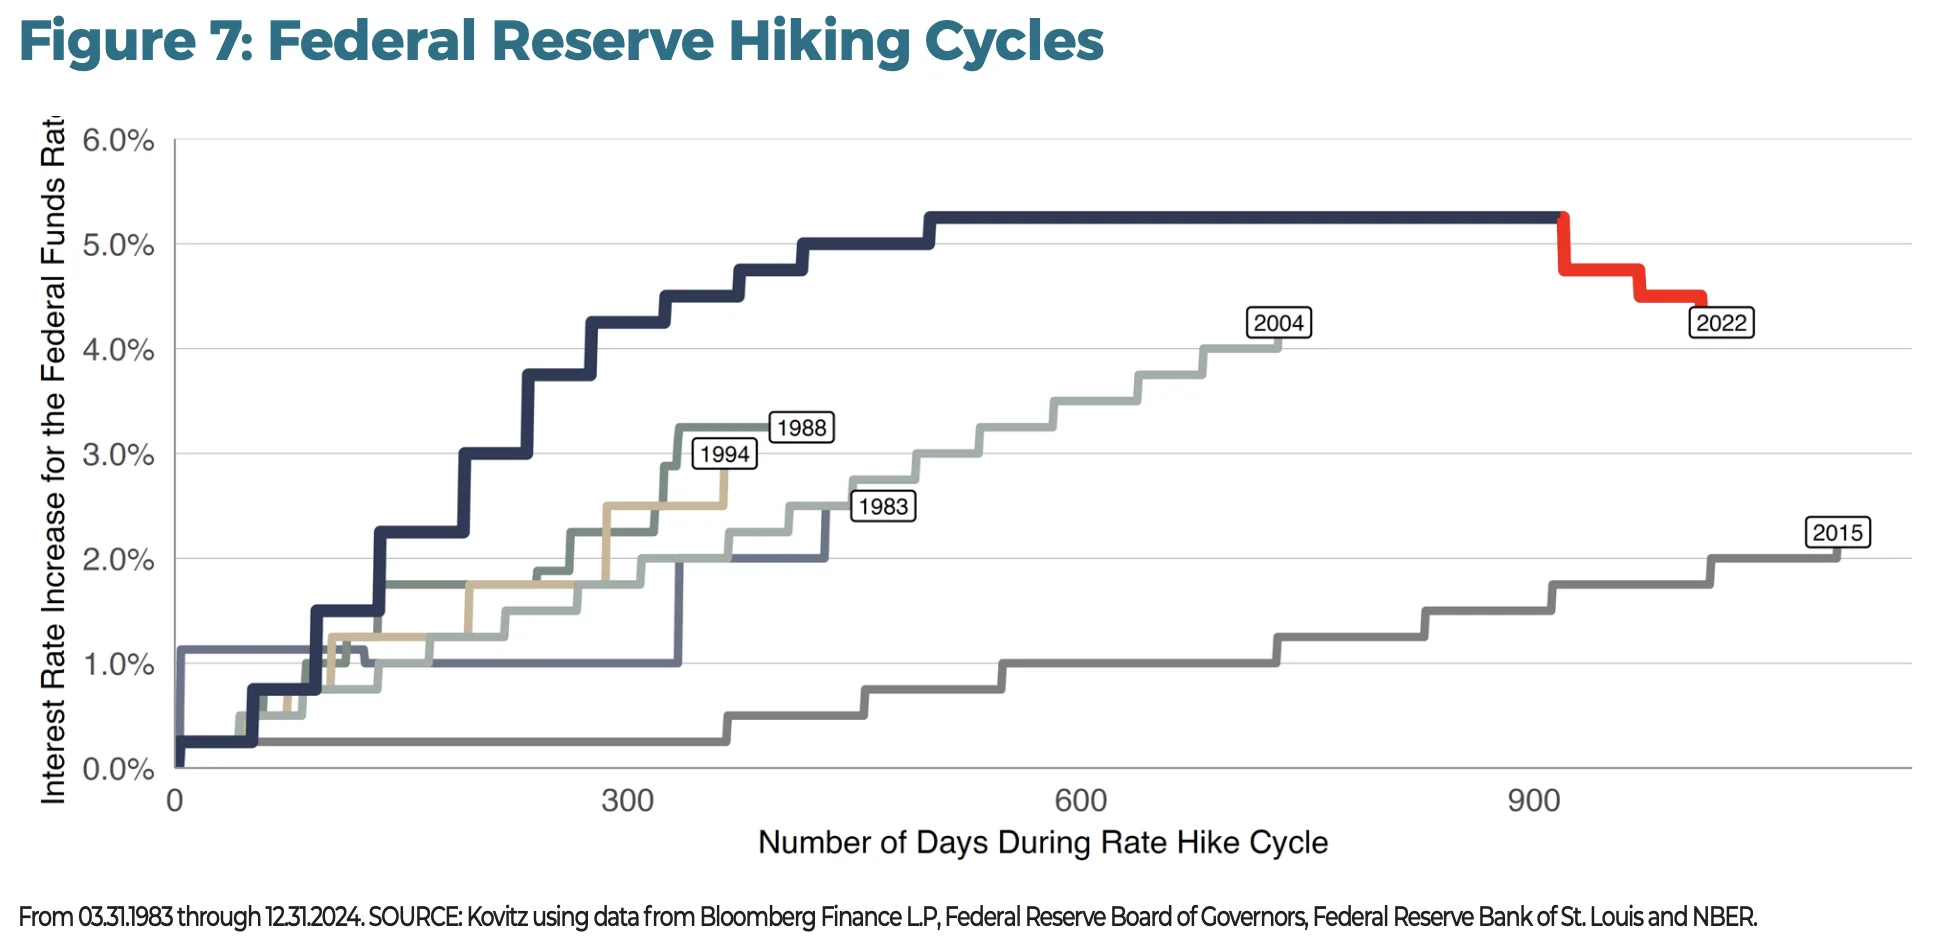
In comparison to rate-hike cycles since 1983, the Federal Reserve moved at breakneck speed in 2022/2023 (navy line). While 2015’s cycle took more than 1,000 calendar days, the most recent hiking cycle rose 5.25% in just 16 months. To our relief, the Federal Reserve seems to have achieved its “soft landing” goal.
Economic news has remained sunny overall and the risk-free rate has retreated by 1.0% from the local high point. Yet there are grand debates to be had about what to do from here and where the neutral rate interest rate, r* (r-star), belongs. It’s hard to believe that America’s 6.4% deficit, the highest in post-war history, will shrink soon. And, there are other headwinds like slowing population growth. There are plenty of tailwinds, too.
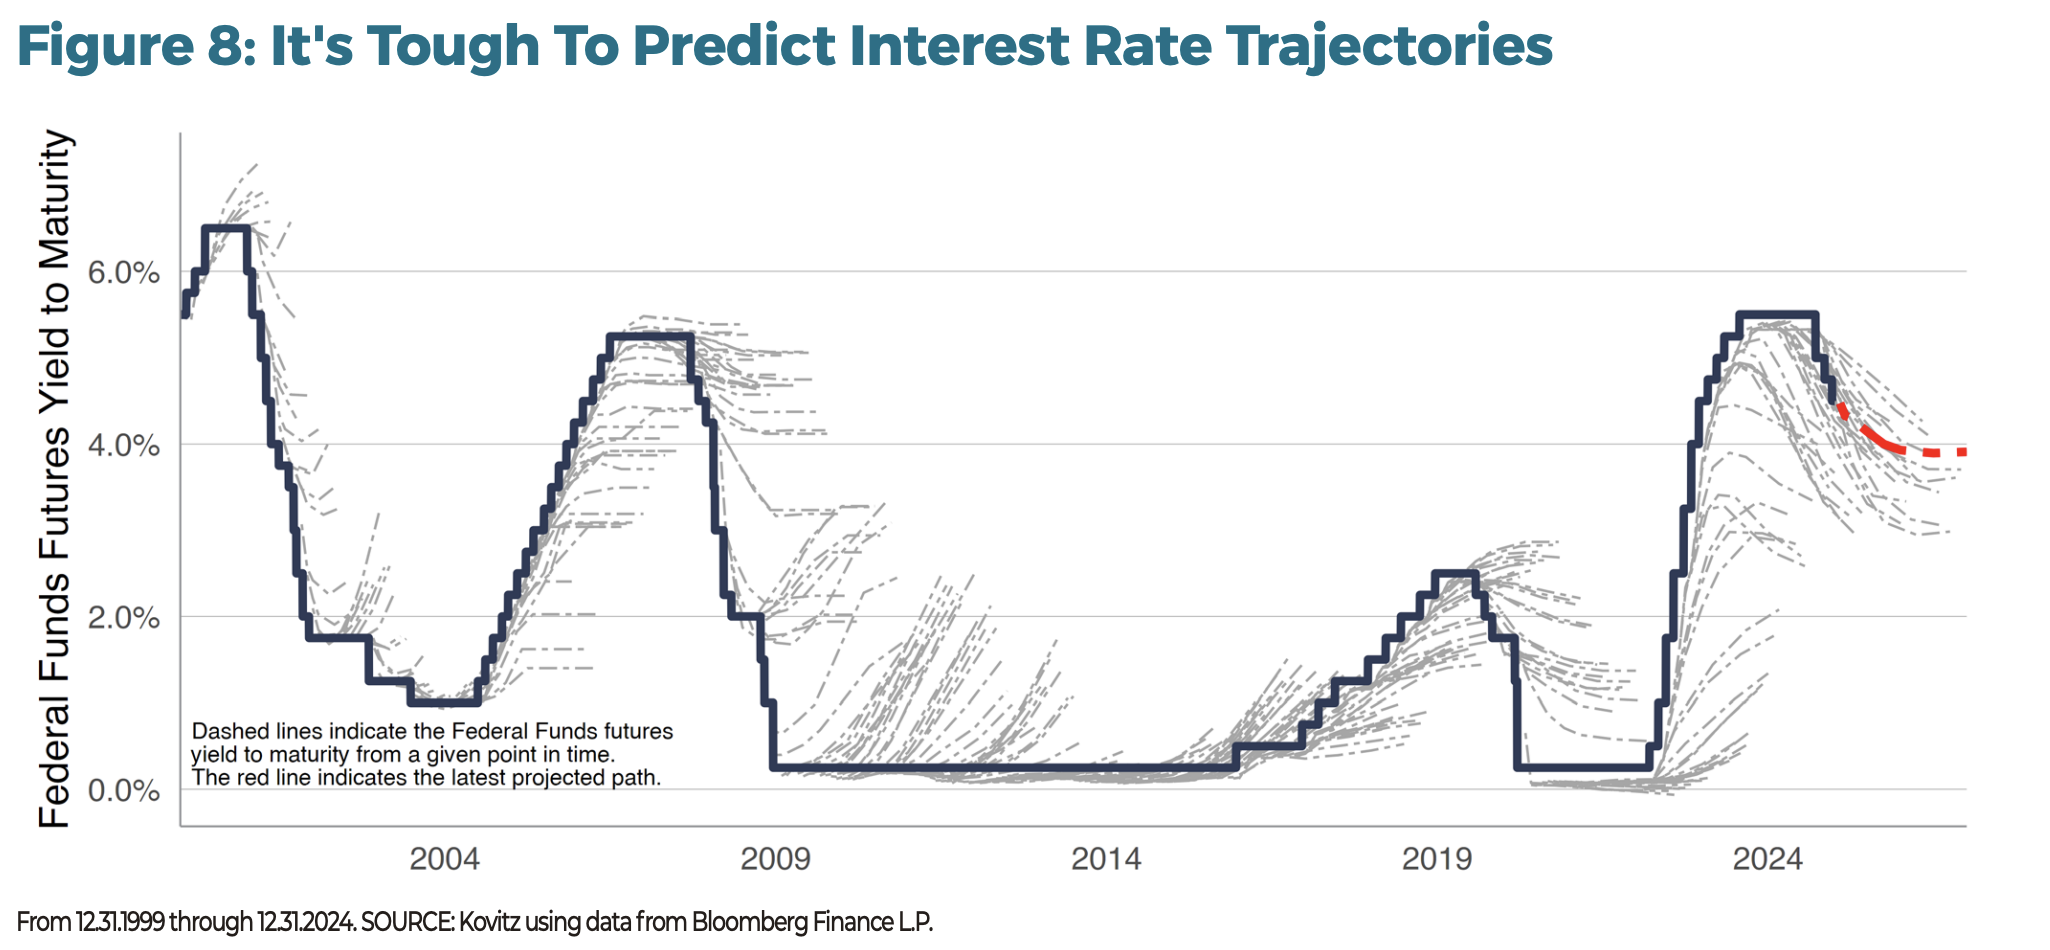
In Figure 8, we plot the Fed Funds Rate and real-money futures trajectories. A significant rate retreat could happen over the next few years, yet in only a handful of instances did the futures markets accurately predict the path of rates.
The Presidential Cycle
The only endorsement we will offer is in support of a broadly diversified portfolio of undervalued stocks to be held for its long-term potential, no matter who is in power in Washington D.C.
Long-Term Performance
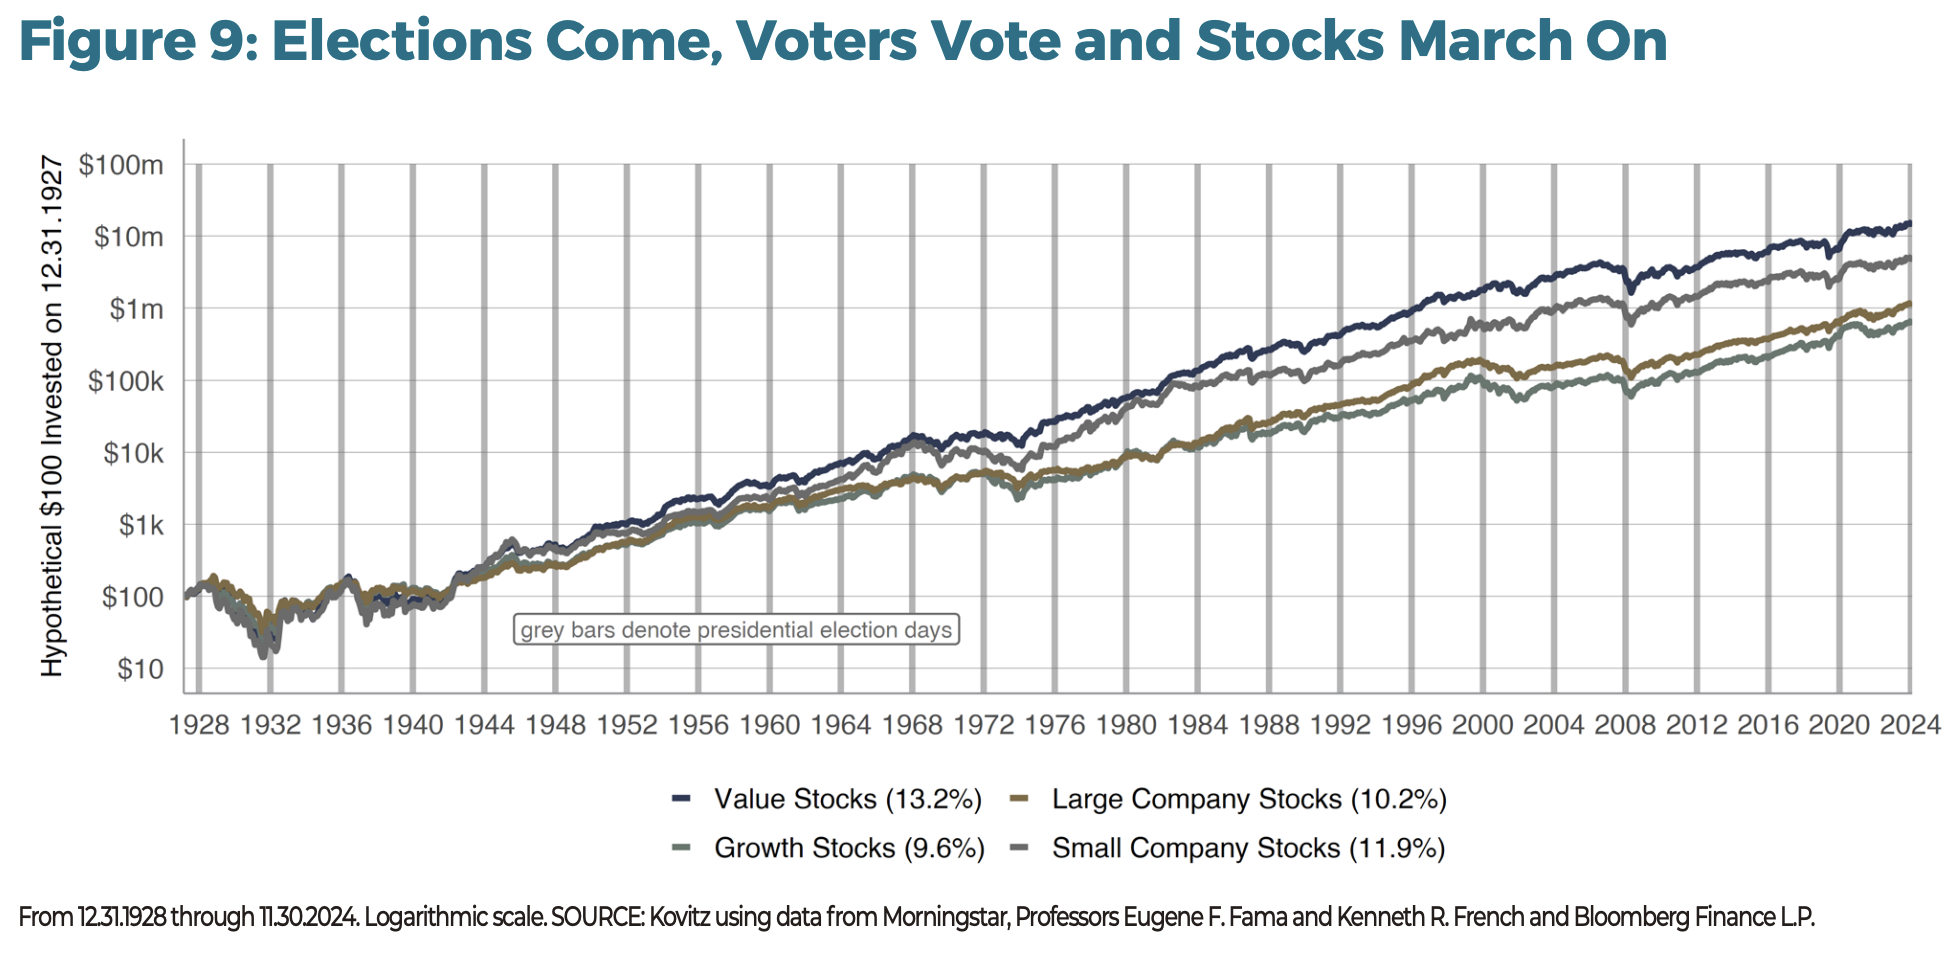
America’s day at the polls came and went on November 5, and we suspect there are folks who were fretting that a win for the other party would spell trouble for their investments. Of course, we warned in our series of election-related Special Reports that investing based on political beliefs is a strategy that contains plenty of pitfalls, We’d strongly recommend against it. As Figure 9 shows, stocks of all types have moved up and to the right over the last near-century, despite multiple wars, disease, geopolitical conflict and natural disasters. Indeed, the other party won over that time, too, and it did little to upset broad market returns. Yes, this time could be different, but the economic engine of the United States has managed to survive all sorts of disasters since gaining independence in 1776.
While the stock market’s current form is hardly reminiscent of its earliest days, returns since 1928 (the years in which reliable data are available) show handsome gains, with Value leading the pack at a 13.2% annualized clip, compared with 9.6% for Growth and 10.2% for Large Company Stocks (the S&P 500 index). Small Company stocks have returned a handsome 11.9%.
U.S. Presidents
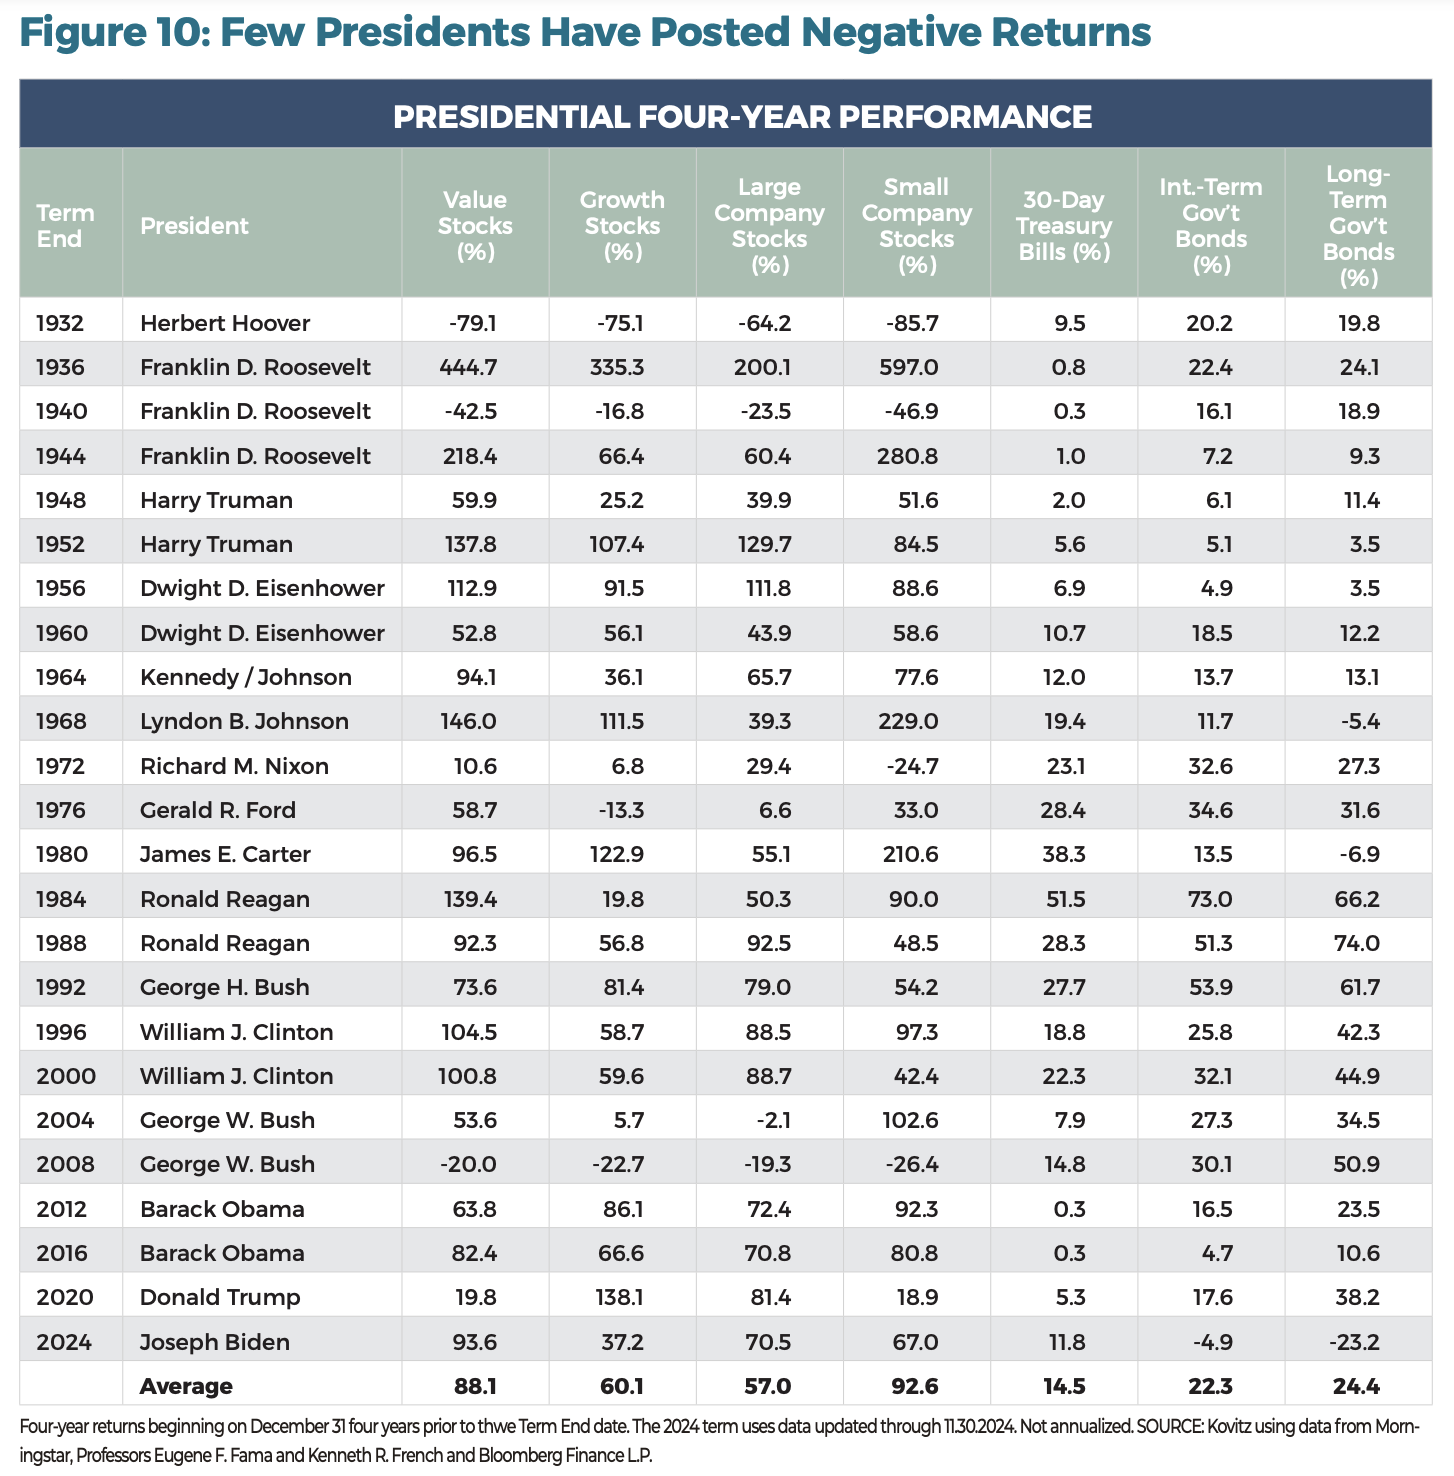
In Figure 10, we offer a table with stock and bond returns for each presidency. We started the return tabulation on December 31 following an election and calculated returns for the ensuing four years. Average returns have generally been solid, with an average 88% (not annualized) return for Value stocks, 28% better than Growth, and a 93% return for Small Company stocks, 36% better than Large Company stocks.
There are some important notes. 1) Bond returns are heavily influenced by Federal Reserve policy. 2) Value and Growth returns may look odd in more recent periods, given that Growth has generally outperformed Value in the last decade or so. Professors Fama and French calculate their breakpoints annually and using a single factor (Book-to-Market), which makes returns comparable historically, but does not reflect multi-factor definitions that are generally employed today.
The Economy
The favorable economic back-drop is a positive, given that corporate profit growth is a major reason why stock prices have risen over the long term.
GROSS DOMESTIC PRODUCT
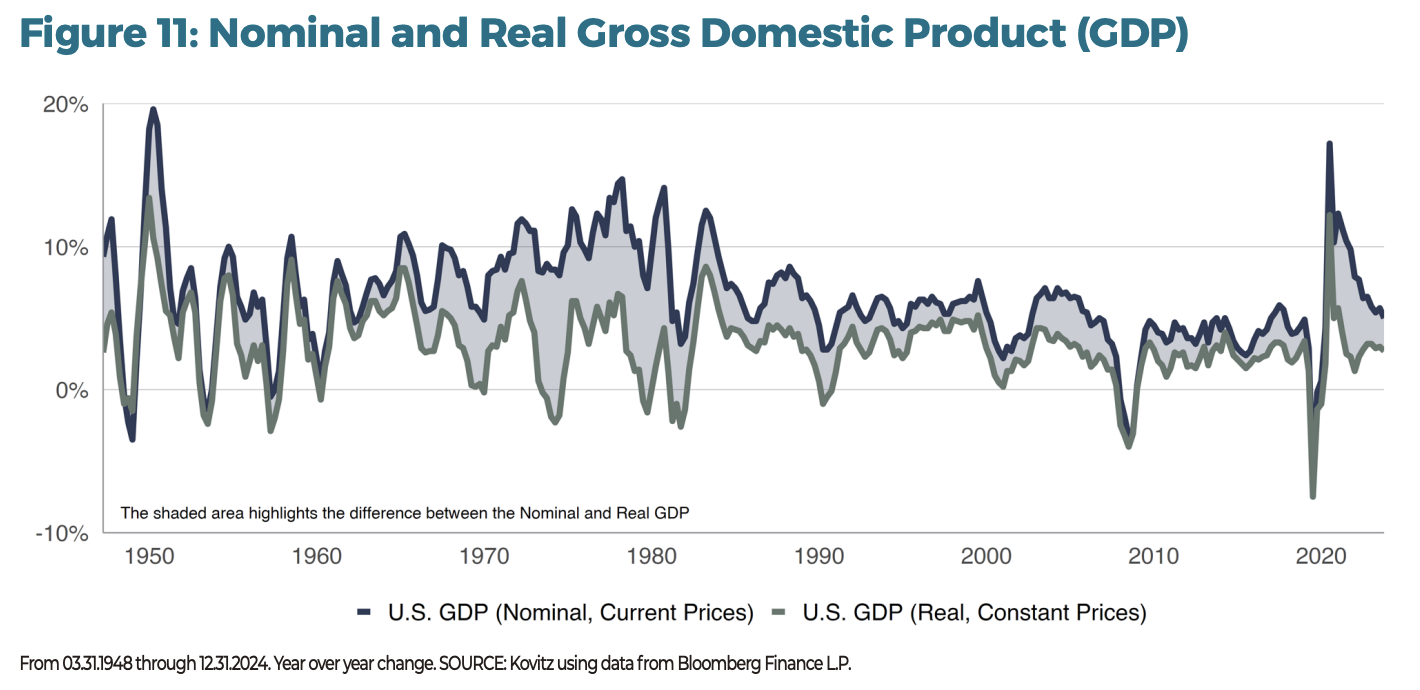
Investors often use real Gross Domestic Product (GDP) to gauge the health of an economy. It is a measurement of economic output that approximates total spending via four factors: consumer spending, industrial investments, government spending and the trade gap. Real GDP holds prices steady, such that an increase in the figure indicates a country’s output has grown.
Nominal GDP is closely linked to real GDP but does not exclude changes in price level. A rising nominal GDP can be indicative of rising output, (as is the case with real GDP), rising prices or (the most likely scenario) a combination of the two. The gap between real and nominal GDP is generally attributed to inflation.
We read that corporate profits tend to track GDP trends, but the real GDP figure (September’s Q/Q figure was 3.1%) is not the right benchmark. Profits are counted in nominal dollars, not real, which is why they grow more like the nominal rate than the real rate. And, yes, there are levers companies can pull, costs they can cut, synergies they can squeeze, acquisitions they can make and brand extensions they can implement to grow faster than nominal GDP.
LIVING EXPENSES
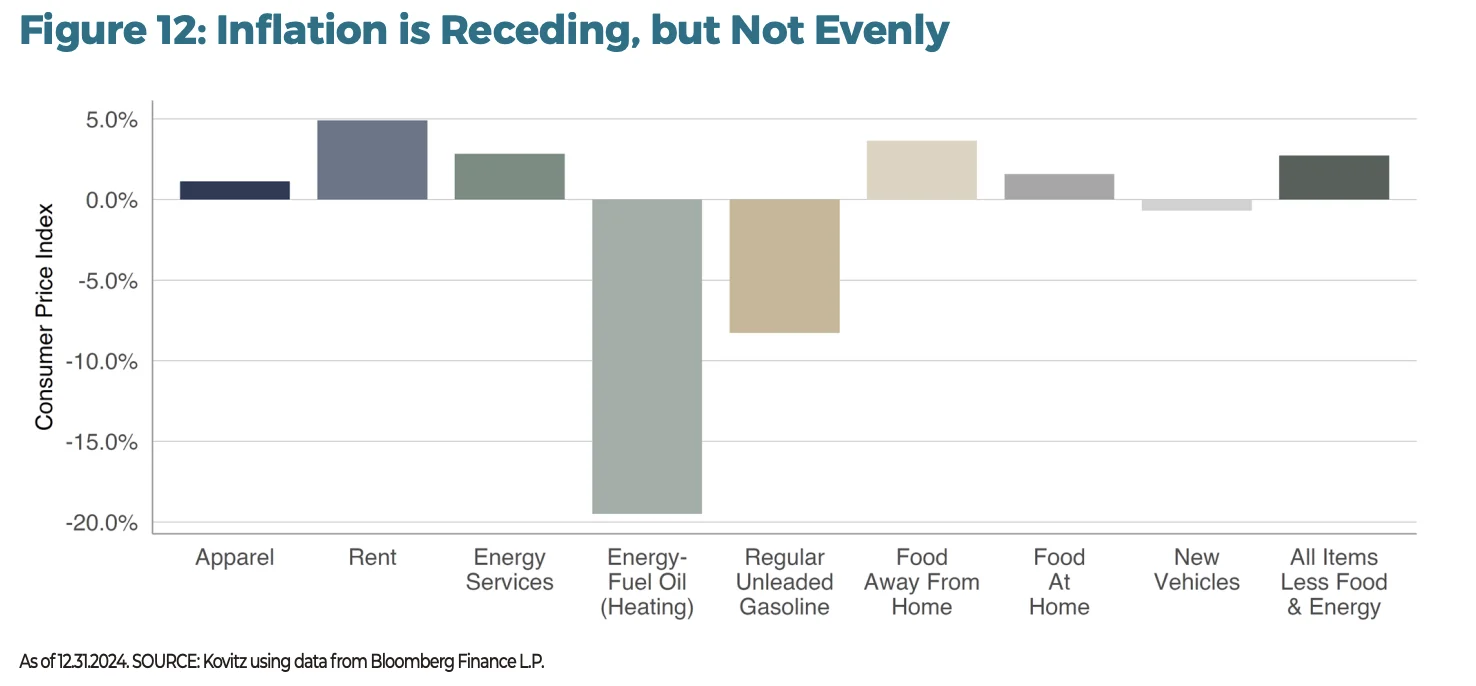
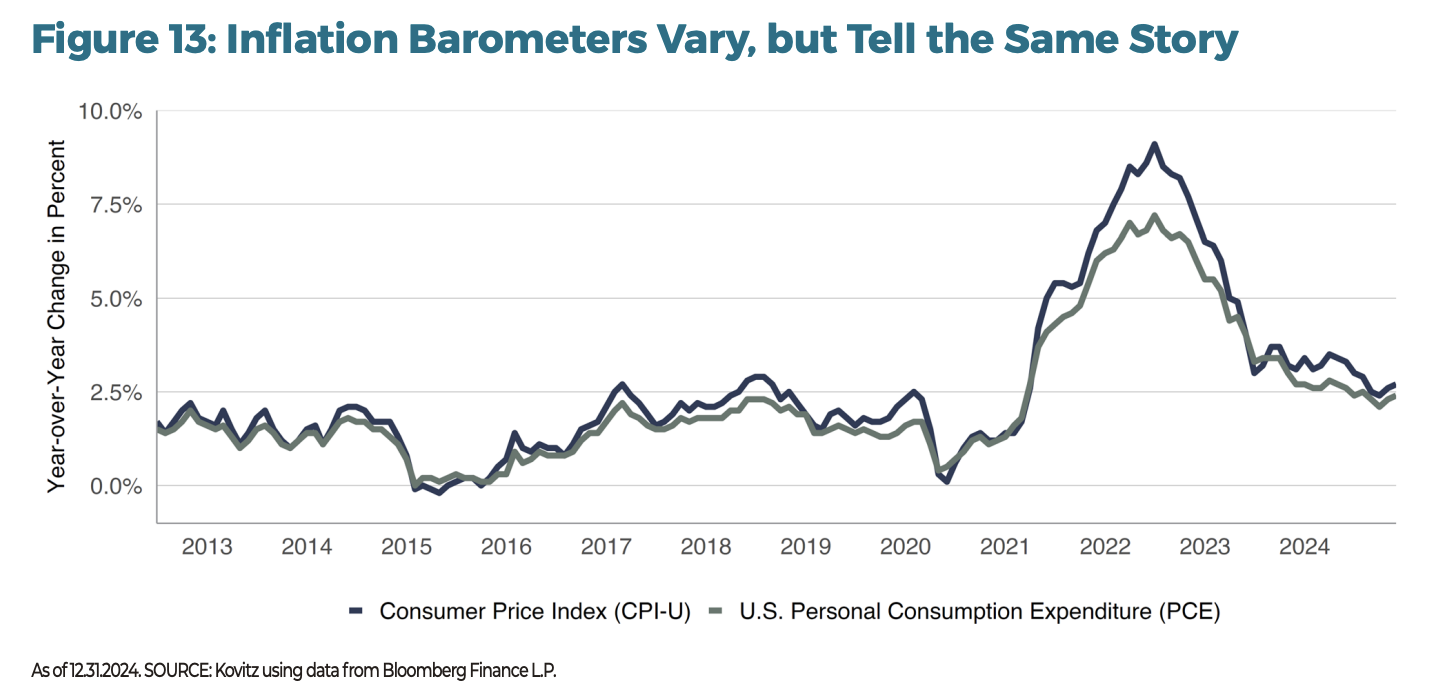
From the dinner table to the car lot, the rising cost of living dominated conversation for nearly three years and became a key issue in last year’s presidential election. Although some components of inflation have continued to climb (Figure 12), fuel and energy prices have made substantial retreats, while rent and food prices are not rising as quickly as they once were. We suspect the relief is welcomed.
The Consumer Price Index (CPI-U) and U.S. Personal Consumption Expenditure Index (PCE) are commonly used to measure inflation. Both track a basket of goods, but vary in formula, weight, scope and other factors. CPI-U uses household data, while PCE uses business data. CPI only considers out-of-pocket spending, and PCE includes indirect expenditures. Methodology differences result in different inflation figures. We monitor both but prefer to use PCE, as does the Fed.
Valuations and Trends
In the fullness of time, equity prices historically have followed corporate profits higher, with sizable and sustained moves lower nearly always coinciding with an earnings retreat.
S&P Index Review
When making a case for an investment idea, the status of the S&P 500 index is frequently used as justification to support a given view. It has many attractive features including a lengthy performance history, a wide array of investable options, easy access in retirement accounts and the appearance of broad diversification.
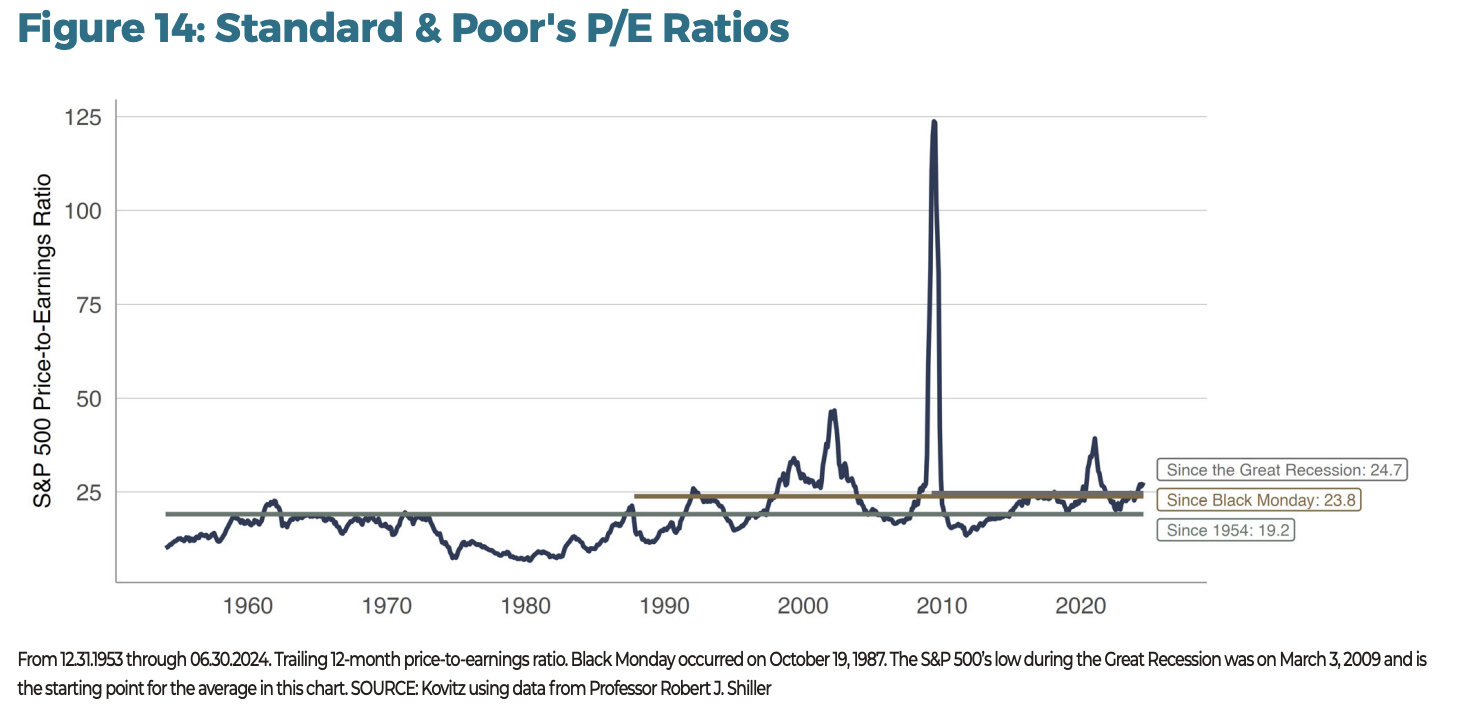
The Price-to-Earnings ratio, a measure of a company’s share price relative to per-share earnings, is one metric that is used as evidence to demonstrate that the stock market is expensive or inexpensive.
Figure 14 shows the mean long-term price-to-earnings ratio for the S&P 500 index has hovered around 19 times (green line) since 1954, while the ratio’s recent averages have been quite a bit higher (Black Monday in 1987 in gold and the low point during Great Recession in grey). Swings in the series can be distilled into two factors: 1) the S&P 500’s price level (numerator), which is currently around 5900 and 2) the S&P 500’s trailing earnings per share (denominator). The chart shows the index’s current ratio is above long-term means, but there’s plenty of evidence to suggest stocks are supported by a strong economy.
MULTIPLES CAN CHANGE
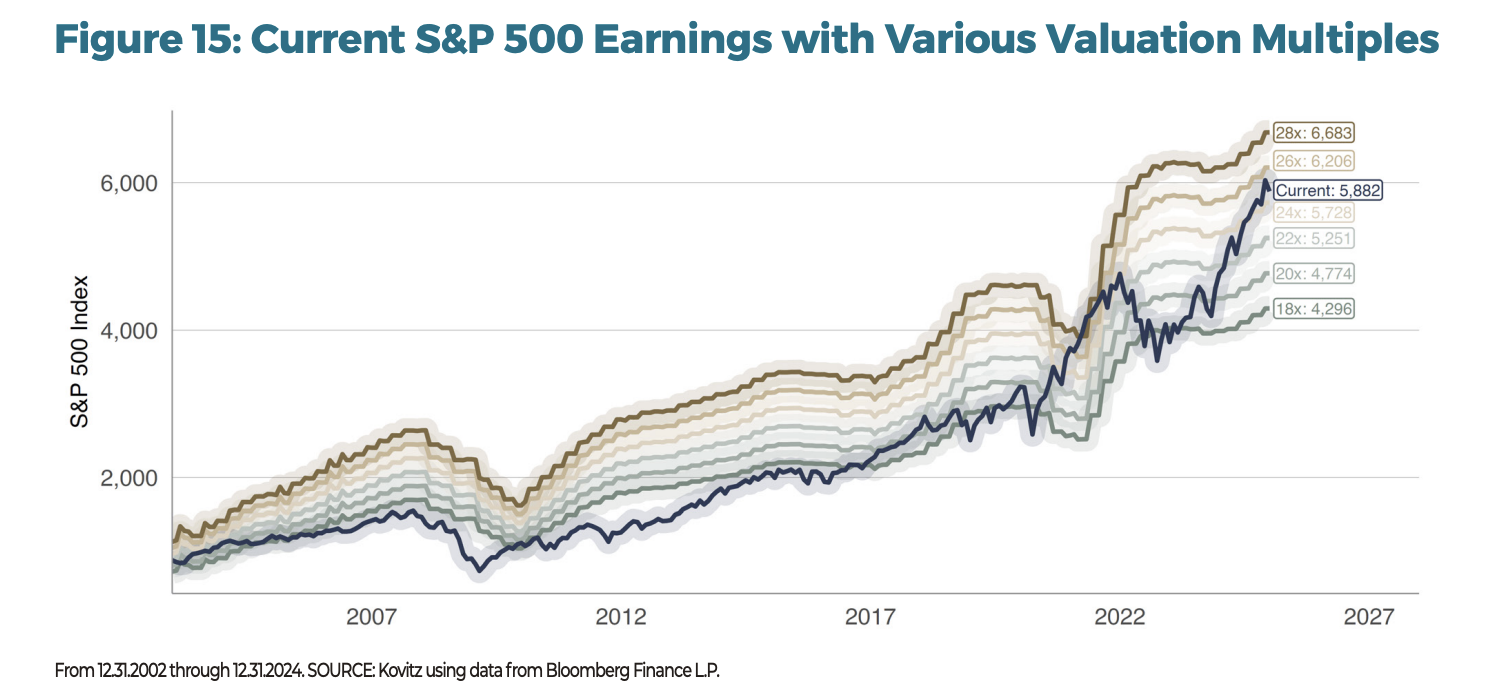
Investors love to see growth in earnings (or at least growth in earnings projections), even as the index’s price can climb without actually experiencing underlying earnings growth. In Figure 15, we chart the current S&P 500 P/E multiple (navy line), with earnings multiples between 14 times and 24 times in the background.
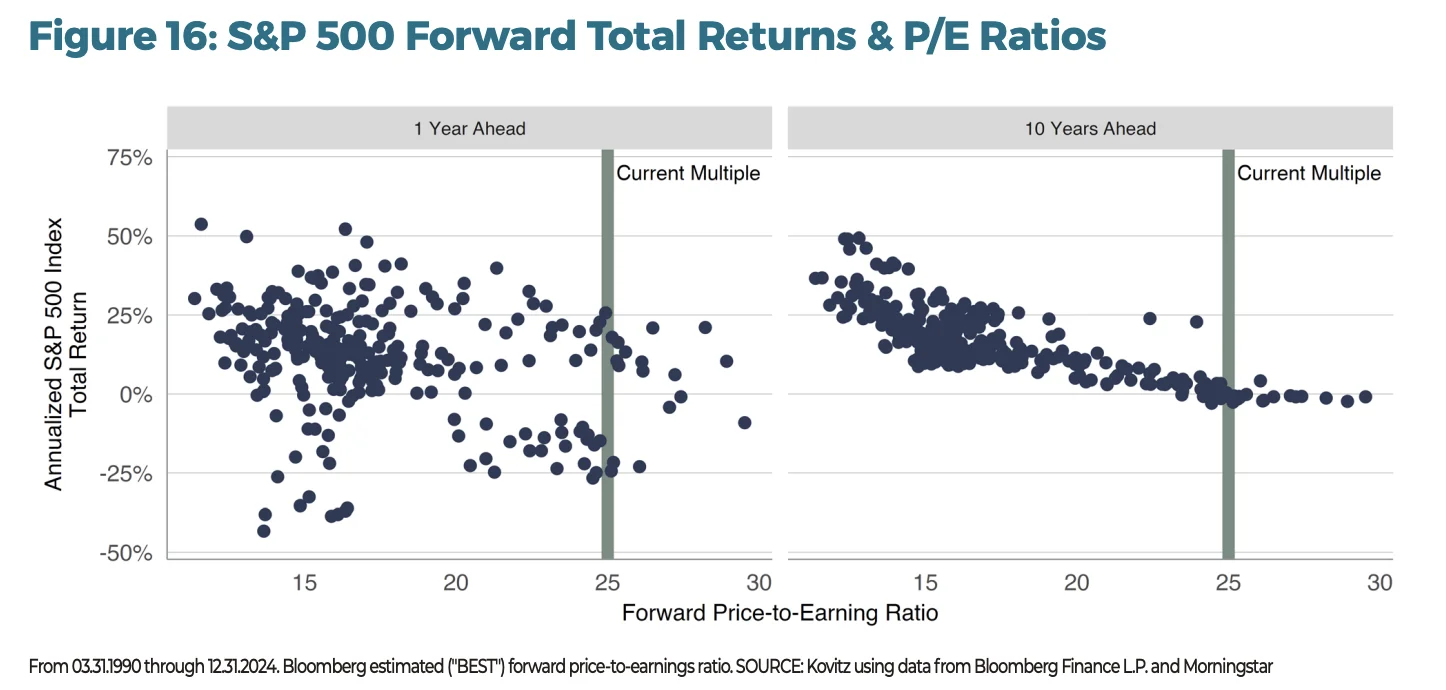
There’s no question valuations have expanded recently, but selling stocks would have resulted in missed returns, likely tax consequences and no foreseeable re-entry point with a more-reasonable P/E metric. In Figure 16, we recalculated a chart we’ve seen passed around the interwebs. It shows mediocre forward returns for the ensuing decade when the forward P/E ratio is above the current reading. Trends just one year ahead are less robust and the datapoints have heavy overlap. Given our more than 47 years (and counting) of investment experience, we would never throw in the towel on stocks when the valuation metric is heavily dependent on just a handful of stocks.
GROWING INFLUENCE
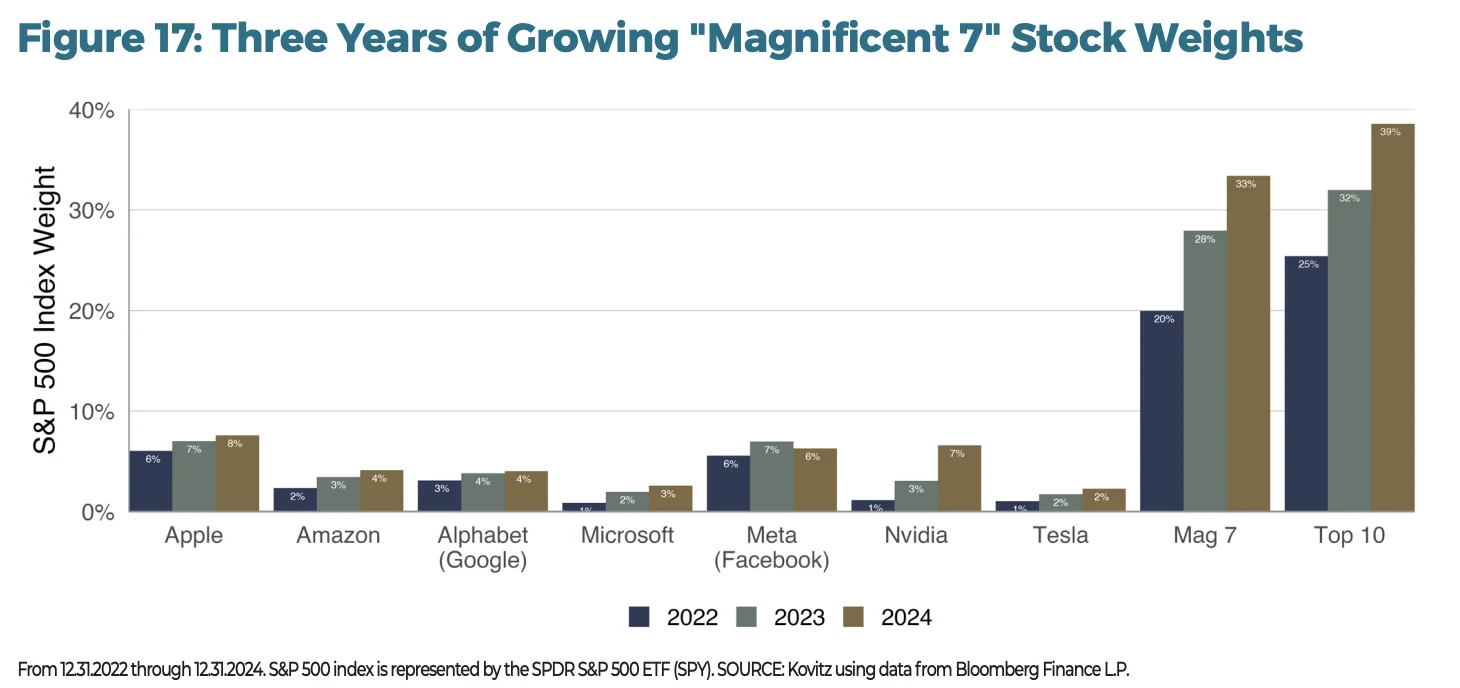
The Magnificent 7 is a nickname for seven stocks in the S&P 500 that have swelled in size and influence: Apple, Alphabet, Amazon, Meta Platforms, Microsoft, Nvidia and Tesla. Tailwinds from are from tech trends, Artificial Intelligence (A.I.) and heavy capital expenditures. Even though the Mag 7 was coined after the stocks had started their run (the first mention we could find was by CNBC host Jim Cramer on June 1, 2023), performance for the septuplet has not fizzled. As Figure 17 shows, the Mag 7 stocks have grown from 20% of the S&P 500 in December 2022 to more than 33% two years later, with the top 10 stocks now representing nearly 40% of the index.
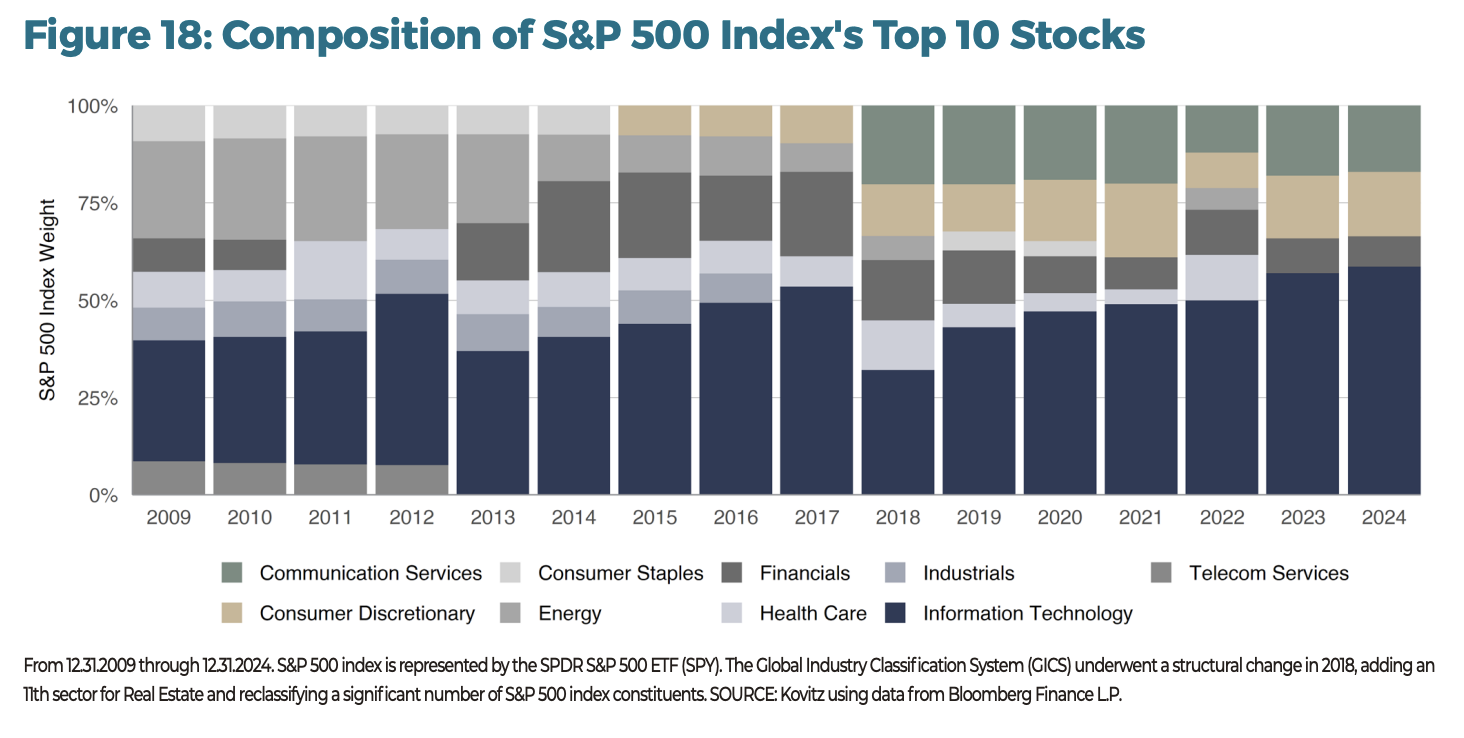
We believe the heavy concentration is not worrying on its own, but investors should be aware that a few stocks have driven the lion’s share of the index’s returns lately. The Technology sector now represents more than half of the top ten stocks in the S&P 500 index (Figure 18), with a valid argument that the weight is functionally higher, with Amazon (Consumer Discretionary) closely tied with Technology through its Amazon Web Services business, while Meta Platforms and Alphabet (both Comm. Services) were in the Tech sector prior to GICS reshuffling in 2018.
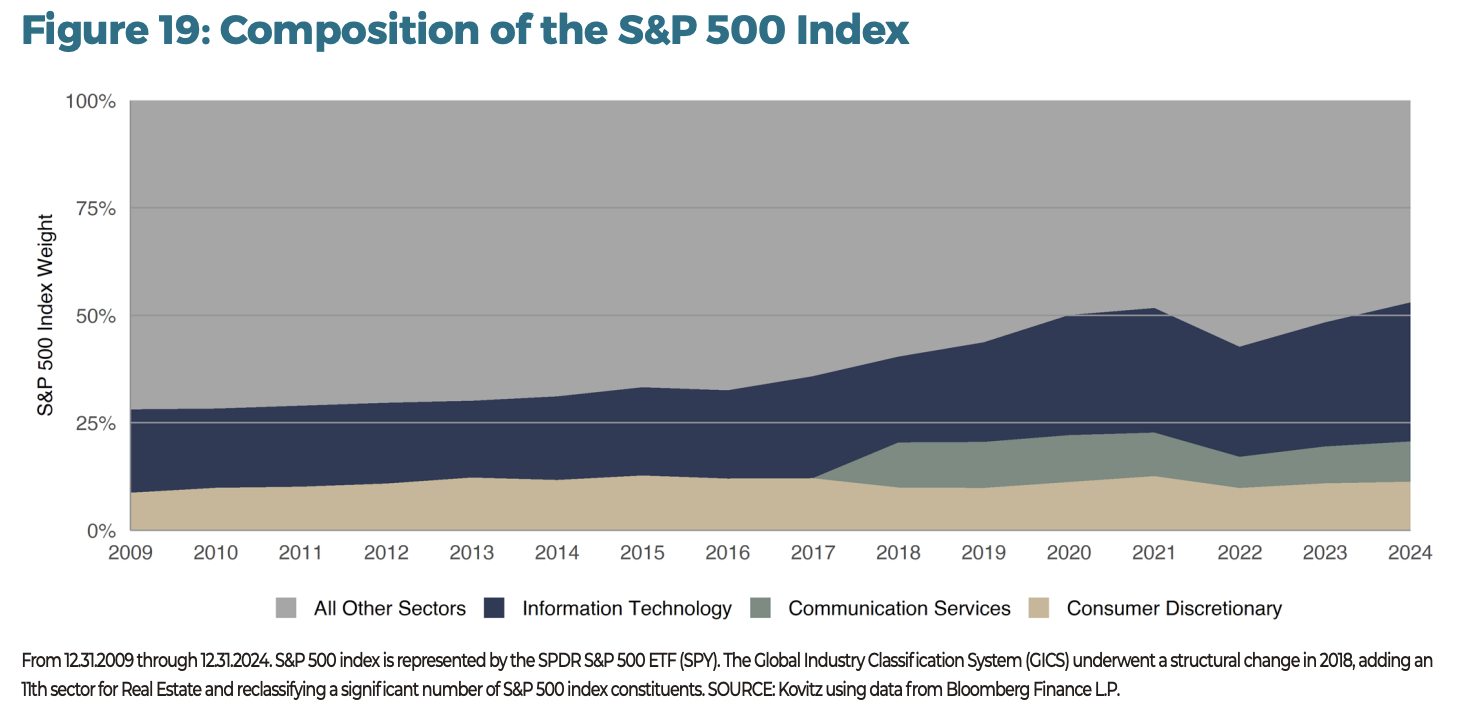
On December 31, the overall composition of the S&P 500, shown in Figure 19, was 32% for Information Technology, 11% Consumer Discretionary and 9% Communication Services. The other eight sectors represent the remaining 48% of the index. These weights have evolved dramatically since 2009, when Technology’s share was a more modest 19% and included some stocks that have migrated sectors.
Of course, there’s nothing wrong with certain stocks getting their day in the sun (even if we do not own all of them in our broadly diversified portfolios). The attention that has been drawn to the FAANG stocks, the Magnificent 7 or any other grouping is almost always well-deserved, and we are happy to own many of them for our clients. However, trends can change quickly and a backward-looking retelling can be problematic (we will be excited for Mr. Cramer to offer a forward-looking acronym!).
And to be fair, holding the acronym stocks through thick and thin would easier have been said than done. Since Mr. Cramer’s first use of FANG (Facebook/Meta, Amazon, Netflix, Google/Alphabet), the group’s members have seen some sizable drops. Facebook (Meta Platforms) fell 77% between September 7, 2021 and November 4, 2022, while Amazon fell 56% between July 8, 2021 and December 28, 2022 and Netflix tumbled 76% between November 17, 2021 and May 11, 2022. Google’s (Alphabet) decline was comparatively shallow at -44% between November 18, 2021 and November 3, 2022. Despite the intervening drops, the long-term gains have been large, although data from DALBAR supports the idea that few likely had the discipline to keep the faith when market forces were conspiring against them.
The market ebbs and flows. Fortunately, it has done more rising than falling since March 1977. Our experience is that the biggest opportunities come when others are heading for the exits, rather than when everyone is jamming towards the entrance. For example, when the Tech Bubble burst in 2000, we added 97 stocks to our Recommended List. We still hold two of them. Whirlpool was first recommended on August 31, 2000 at $38.02, while Apple Computer (yes, *the* Apple) was first recommended at a split-adjusted $0.40 on October 6, 2000. Apple even declined another 37% in the two months after we bought it! For the other 95, we held them an average of 6.6 years with a mean annualized return of 11.3%.
VALUE STOCKS REMAIN ATTRACTIVE
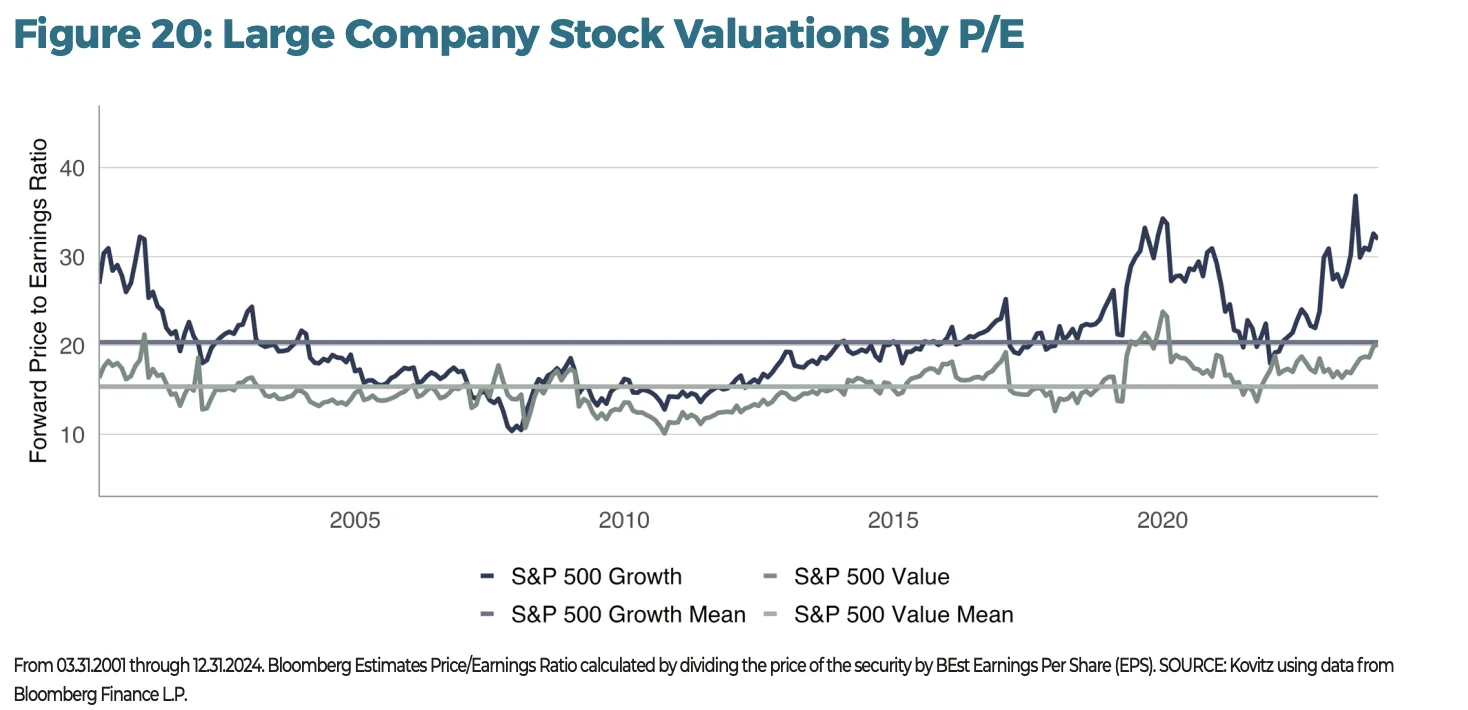
One of the most common valuation metrics, the P/E ratio, measures the price an investor pays for a unit of earnings. Value stocks (those with lower P/E ratios, as in the S&P 500 Value index) have seen their ratios rise above longer-term averages, while Growth stocks (those with higher P/E ratios, as in the S&P 500 Growth index) are much further above its historical norm. We think this discrepancy elevates the attractiveness of Value on a relative basis.
Another measure frequently used in an academic classification of Value and Growth stocks is the Price-to-Book (P/B) ratio, the inverse of which is sometimes called the Book-to-Market ratio. It measures the difference between a company’s market value (i.e. market capitalization) and book value (assets less liabilities). A relatively low P/B indicates the market is undervaluing the company’s stock. As measured by the P/B ratio, the valuation gap is much larger than usual these days, having rapidly expanded again last year.
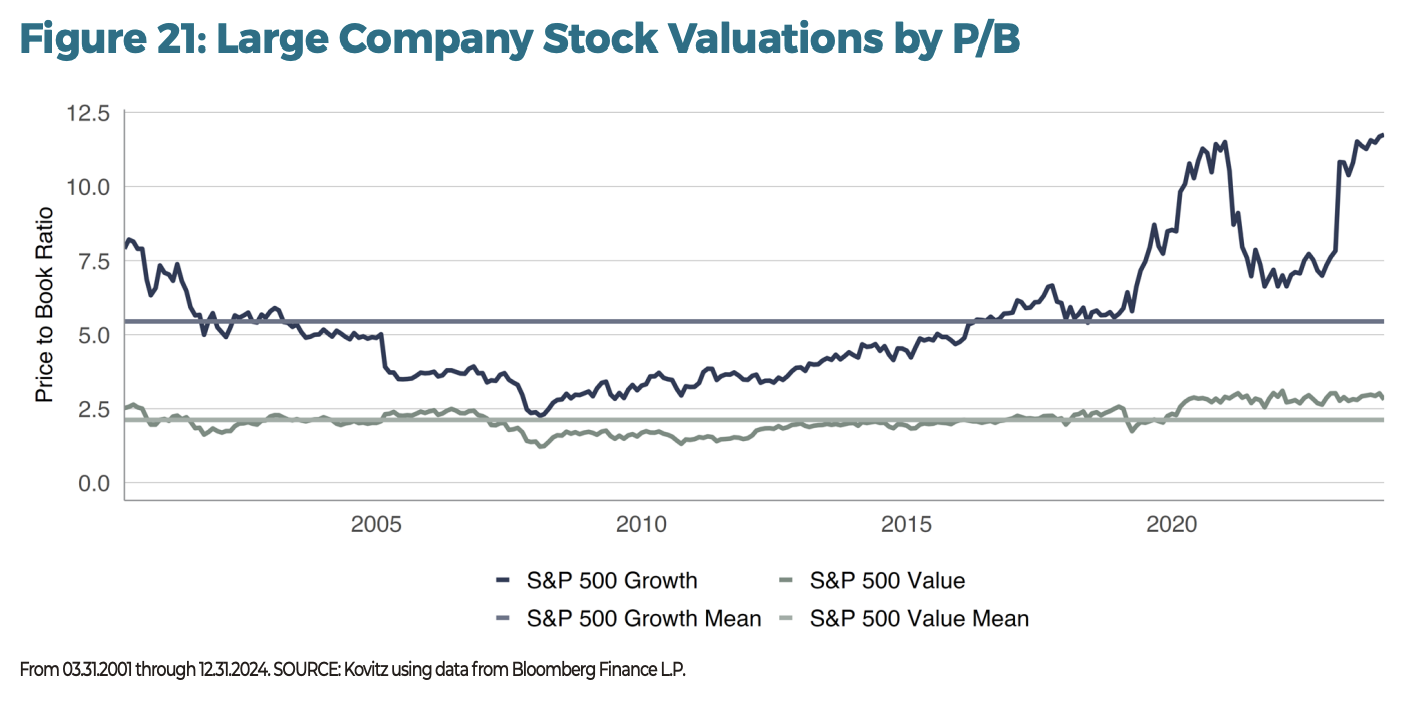
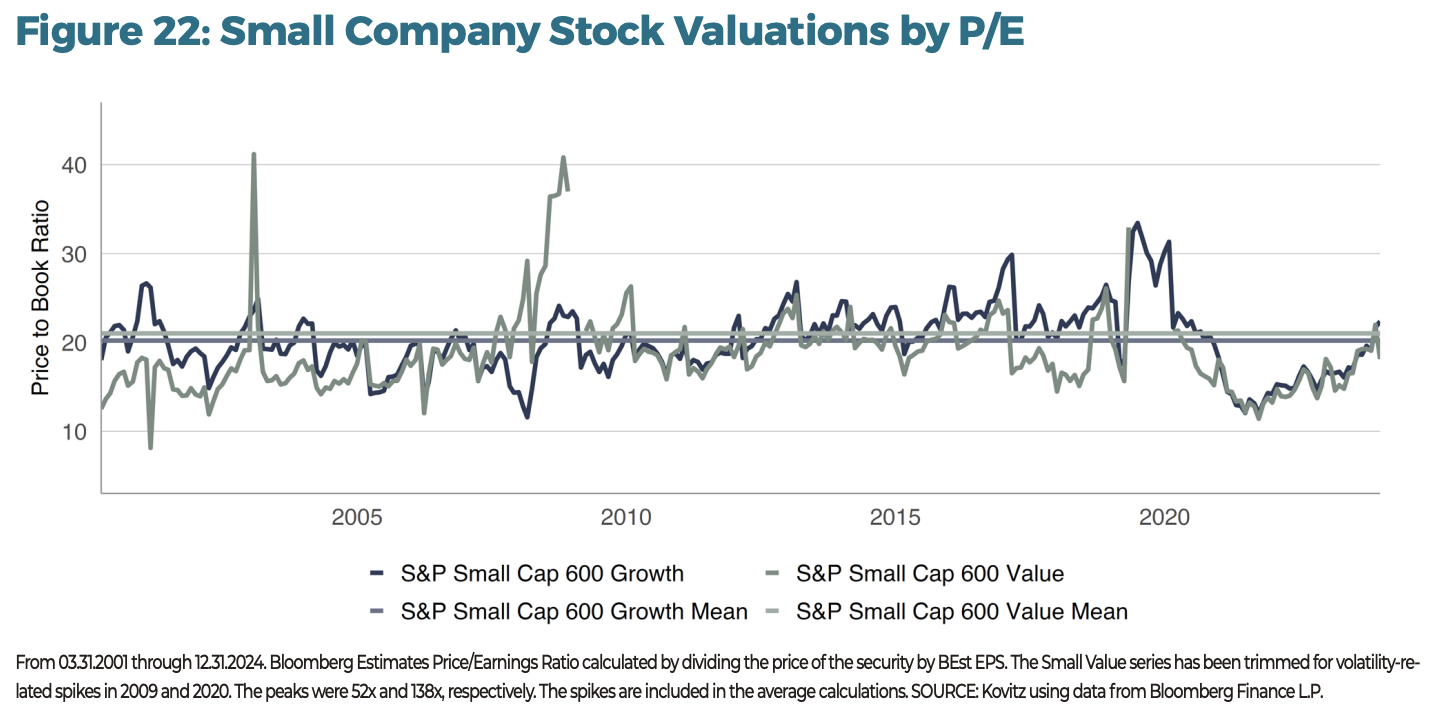
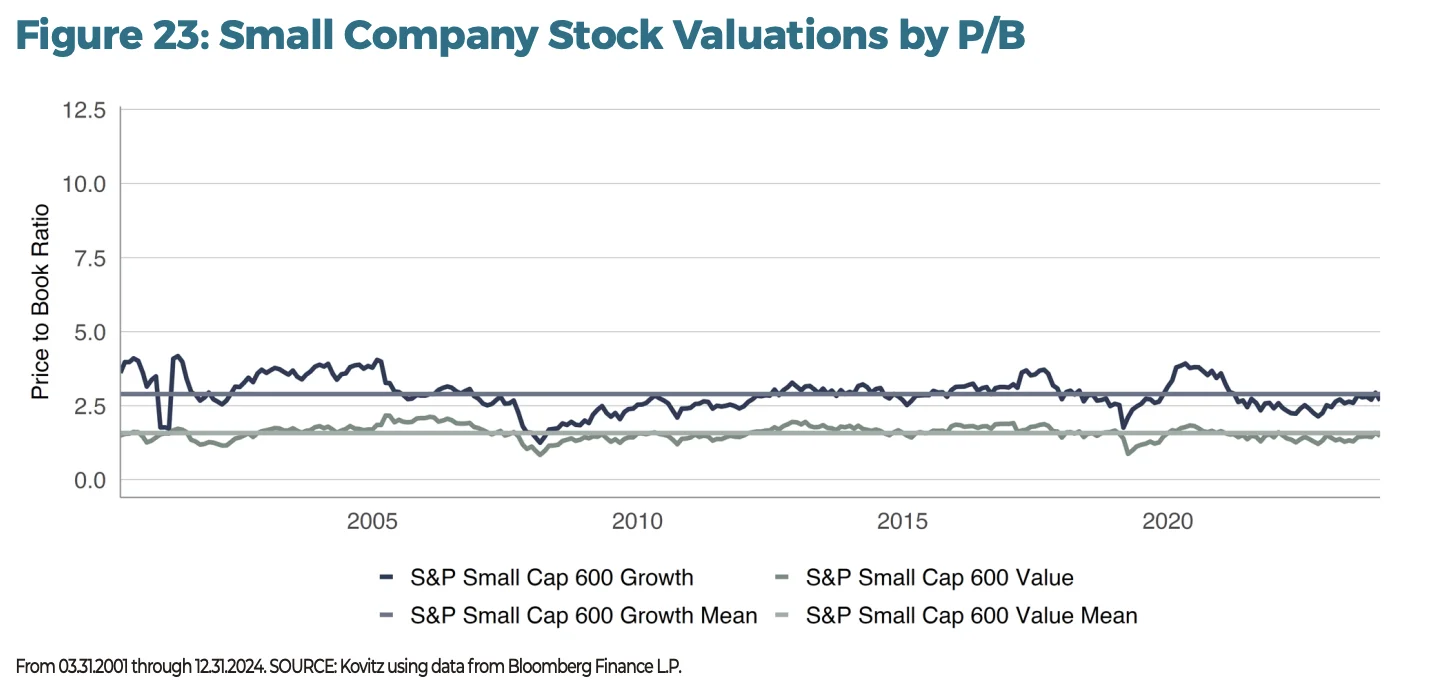
AN EYE ON SMALLER STOCKS
Whether located on the Value or Growth end of the spectrum, Small Caps presently trade for more-fair multiples relative to their own historical averages and against their Large-Cap counterparts. Comparing the Large-Cap S&P 500 series in Figures 20/21 and Small-Cap S&P 600 series in Figures 22/23, it’s evident that Small Company stocks are relatively inexpensive on both forward P/E and P/B bases, in addition to a variety of other metrics we did not include here but share in our Recommend Stock lists in The Prudent Speculator newsletter. Nota bene: vertical axis scaling is the same to improve comparability.
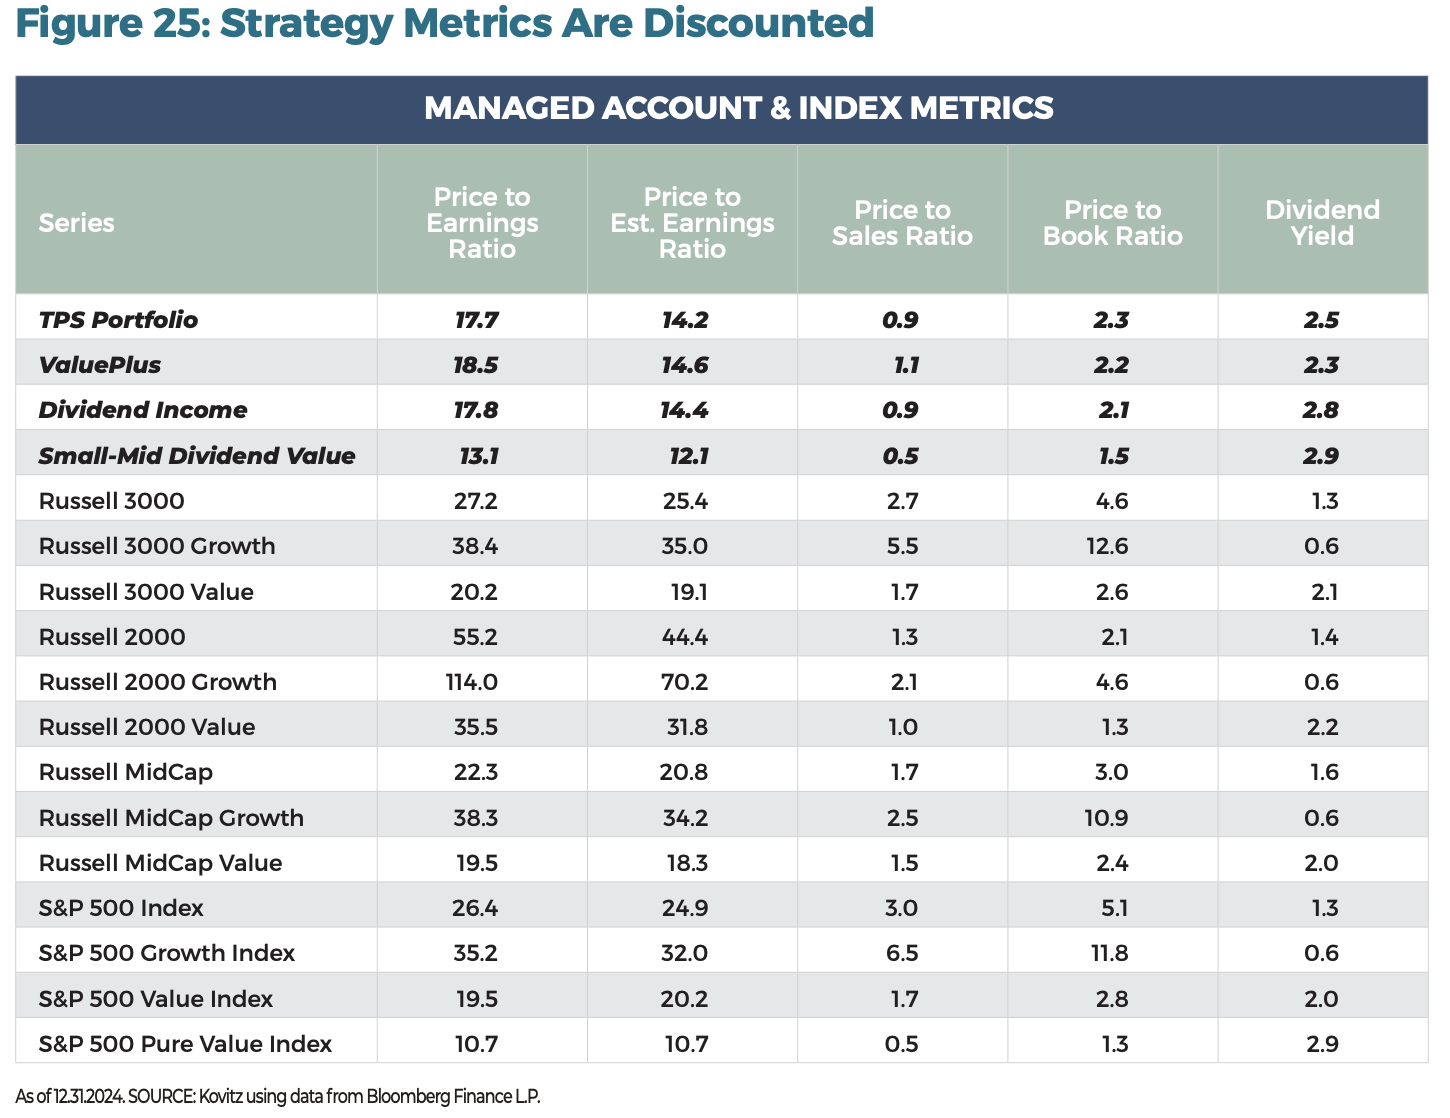
We think there’s a lot to like about Small Company stocks, especially those that reside in the Value camp and pay dividends. While the broad market indexes cast the widest possible net, we do find value in the knowledge that the metrics for our managed account portfolios generally are far less expensive than those of the major stock market averages.
Staying Invested
Our figurative crystal ball clouded over years ago. We have only our optimism that all setbacks will bring larger setforwards if we but keep to our strategy.” – Al Frank, TPS #363, January 1997
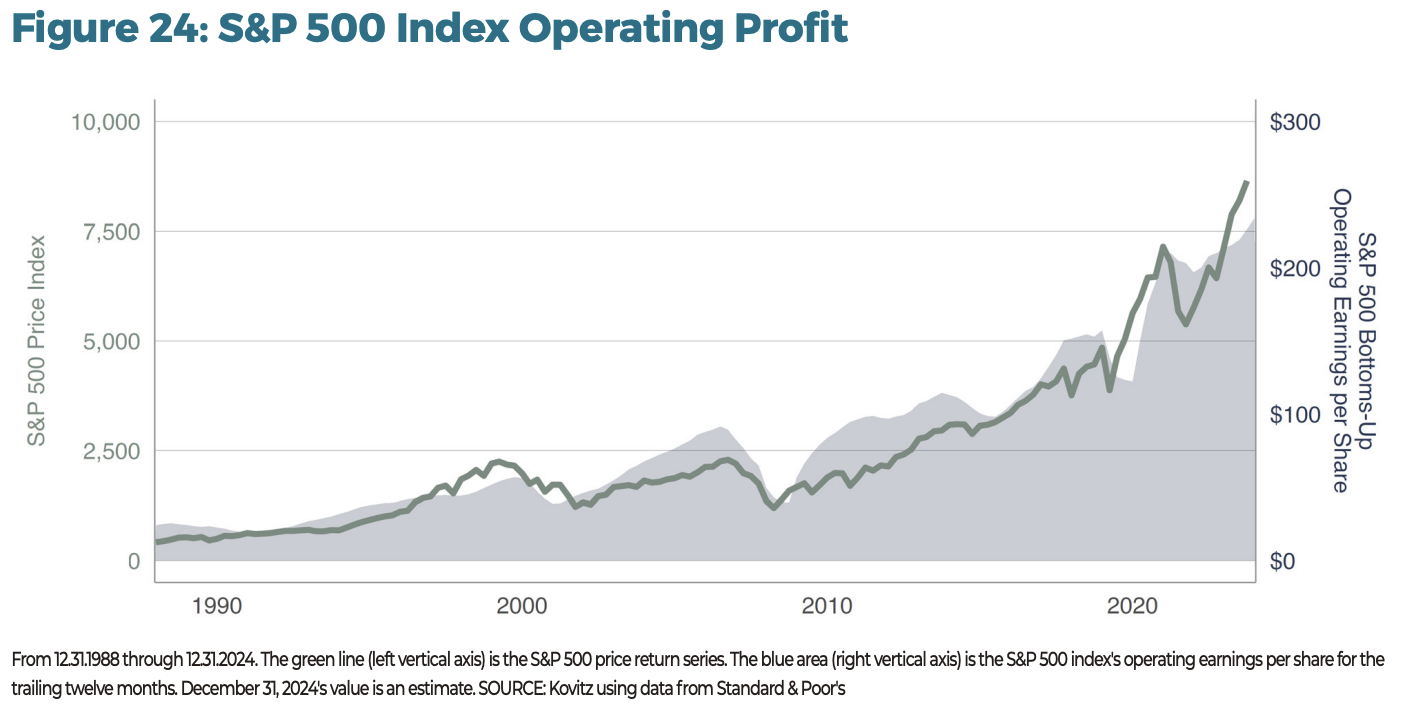
AMERICA, THE GROWTH ENGINE
In Figure 24, we chart the S&P 500 price index (left vertical axis) and the index’s trailing twelve-month operating earnings per share (right vertical axis). Slowdowns in returns have corresponded with earnings contractions over the last 36 years and counting.
Standard & Poor’s analyst Howard Silverblatt expects $233 of bottoms-up EPS for the index in 2024 and growth to $271 per share by the end of 2025. Even if these figures end up retreating slightly, we believe they are still strong enough to propel stock returns above their current levels.
We concede there are always a variety of headwinds threatening equities. Inevitably, some will (temporarily) impact corporate earnings and equity returns. However, given the strong long-term performance of stocks in general, and Value stocks in particular, we often remind ourselves that folks lose more money trying to avoid the downturns than they would simply riding through them. Not surprisingly, then, we do not believe the current environment commands a change in our enthusiasm for the long-term prospects of our broadly diversified portfolios of what we believe are undervalued stocks.
THE ROAD AHEAD
In our 2025 Stock Market Outlook, we discussed eight investment themes for the upcoming year and offered a friendly reminder that we are buying our stocks for their three-to-five-year potential, with the intention of holding them for some time. Our mean holding period is 10 years, though we regularly trim and add along the way.
Investors are often bent on finding the next great idea, in whatever form it might come, expecting to strike it rich in one fell swoop. “Strong returns are great,” they’ll argue, “but you’ve got that risk to worry about.” Standard deviation…correlation…consternation. They’ll try this black box. Then that one. They may even find success for a while, convincing themselves they’re on to something. What is the cost of such a pursuit? Are odds of success high? What about taxes?
Since the first edition of The Prudent Speculator went to press on March 10, 1977, we have tended to an uncomplicated, yet elegant, focus on investing in undervalued stocks in broadly diversified portfolios for their long-term appreciation potential. That philosophy has been our North Star over the years, guiding our evolution.
PARTNER WITH US
For more than 47 years, we have collaborated with our clients in their investment decision making process as they pursue their long-term financial goals. We are committed to keeping your goals, concerns and attitude about investing at the heart of your plan. If you’re ready to experience our personalized investment approach and exceptional client service, contact Jason R. Clark, CFA at 949.424.1013 or jclark@kovitz.com.