Value investing is the ownership of assets at bargain prices. At the core is the notion that today’s price is below the future value. In practice, we are happy to pay a low price for a stock today that we expect is going to be worth more in the future.
Despite sharing the same ultimate target of capital appreciation with Growth investors, Value and Growth investors see the world differently. Growth investors seek out companies that feature growth trajectories above that of the market. Since other market participants have similarly high expectations, Growth valuations (e.g. P/E ratios) tend to be above average, forcing investors to pay “expensive” relative prices for their shares. To see prices rise, Growth stocks must grow their businesses and meet often-lofty targets, leaving little margin for error.
Value investors prefer to pay less than market rates for their shares, enabling shareholders to make money two ways. The first occurs when a stock’s multiples revert to the historical average of the company/industry/market, often spurred by improving investor sentiment. For example, a stock might trade at a ‘discounted’ 10x P/E ratio, while the norm is 15x. Should the stock earn the normal multiple, the stock price will rise, even though there was no change to the underlying business. The second is growth in the bottom line, which can be aided by an upswing in cyclical trends, a reduction in headwinds, business restructuring and/or better management execution.

THE LONG RUN
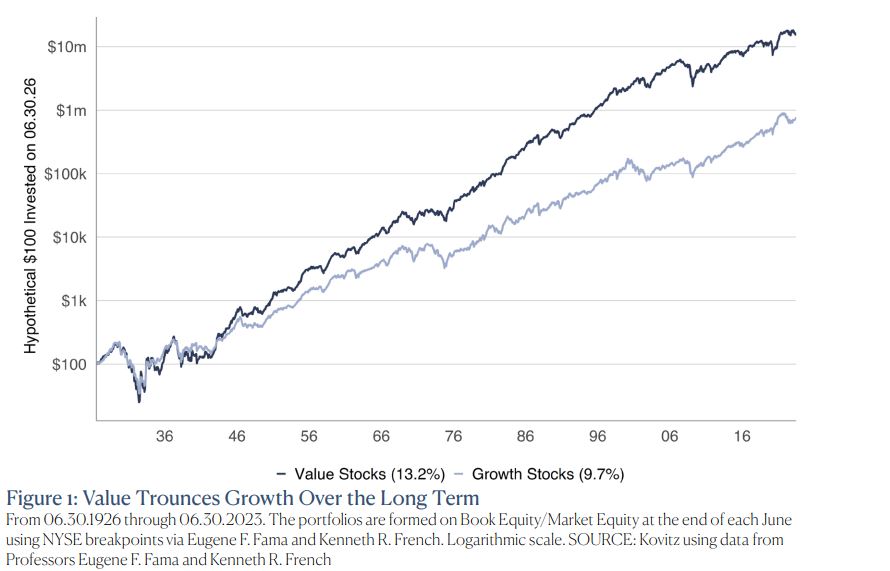
In Figure 1, Professors Eugene F. Fama and Kenneth R. French assign stocks into two buckets, Value and Growth, solely using price-to-book ratio. By “book” the Professors mean the value of the net assets investors should be left with if the company went out of business today. And “price” means the market price of a stock. The nearly century-long performance derby shows that Value stocks trounce Growth stocks, even as figures in subsequent pages show that market performance has not been exclusively titled in favor of Value stocks.
VALUE, BUT EXPANDED
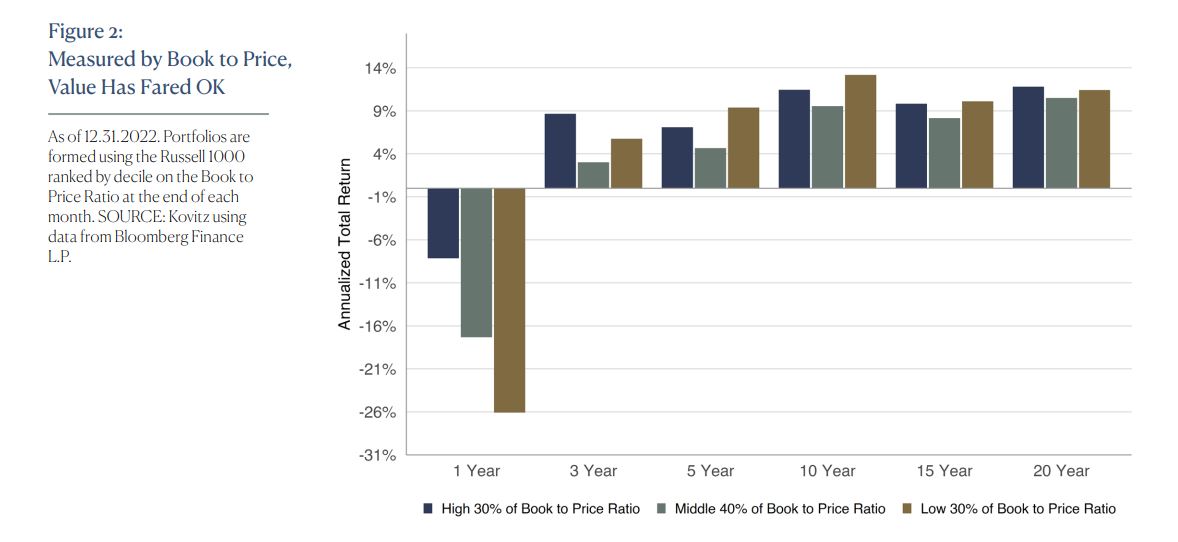
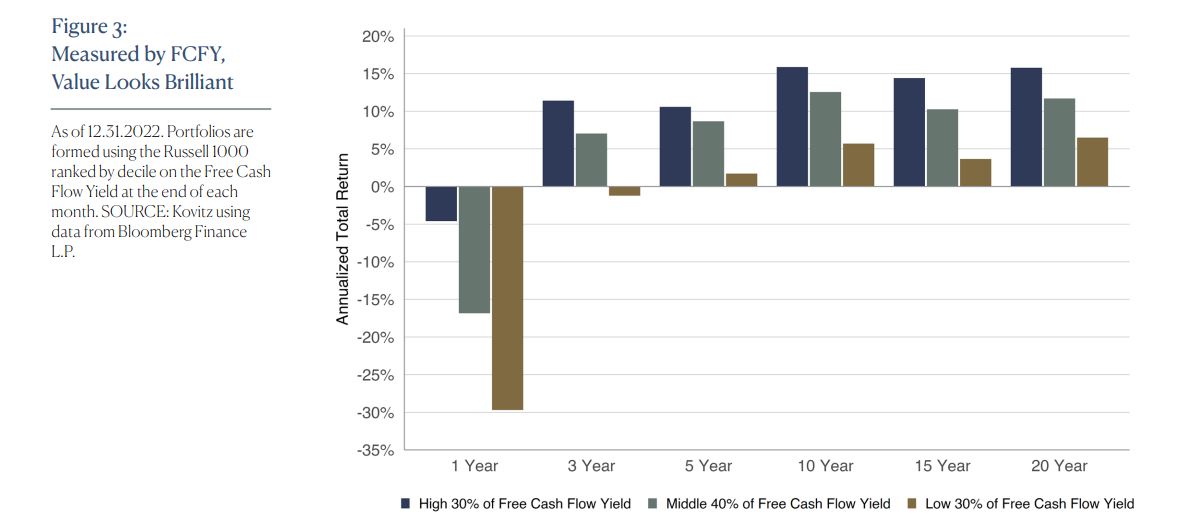
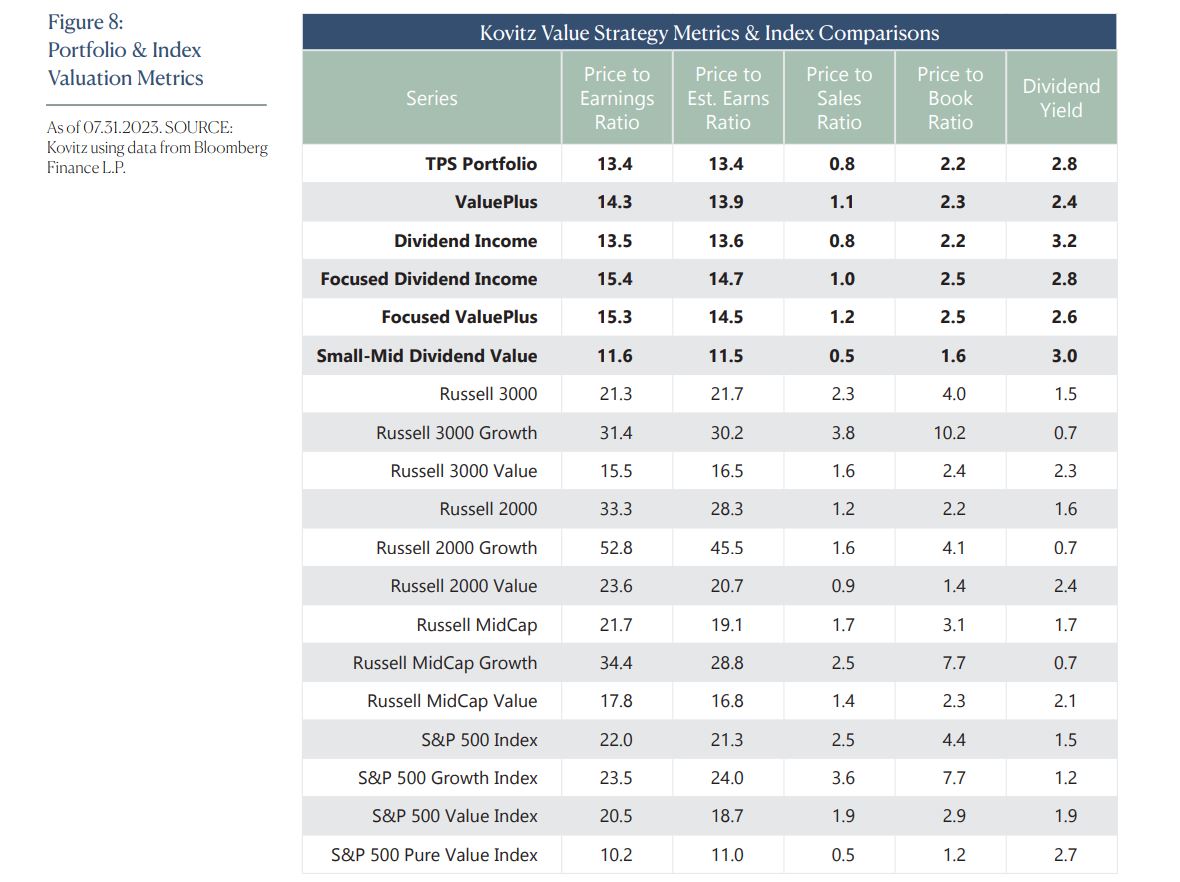
We think it’s too simplistic to differentiate between Value and Growth by just one measure. Therefore, we incorporate multiple valuation measures into the quantitative framework that underpins our ValuePlus, Dividend Income and Small-Mid Dividend Value strategies. On a daily basis, the framework scores more than 3,000 securities across a wide swath of metrics, including measurements of valuation (i.e. Price to Book Ratio or Free Cash Flow Yield) and financial performance (Return on Equity).
We regularly evaluate our work using data from Bloomberg (historical sources include Thomson Reuters, FactSet and ClariFI) to ensure the existing framework remains useful and to improve it. Select outputs of that work are charted below. Figure 2 shows near-term and long-term performance of companies grouped by the Book to Price ratio (inverse of the frequently cited P/B ratio or analogous to the Book to Market ratio), which we’d consider a classic valuation measure. Figure 3 evaluates the data over the same time period as the preceding figure, but the metric evaluated is Free Cash Flow Yield (FCFY).
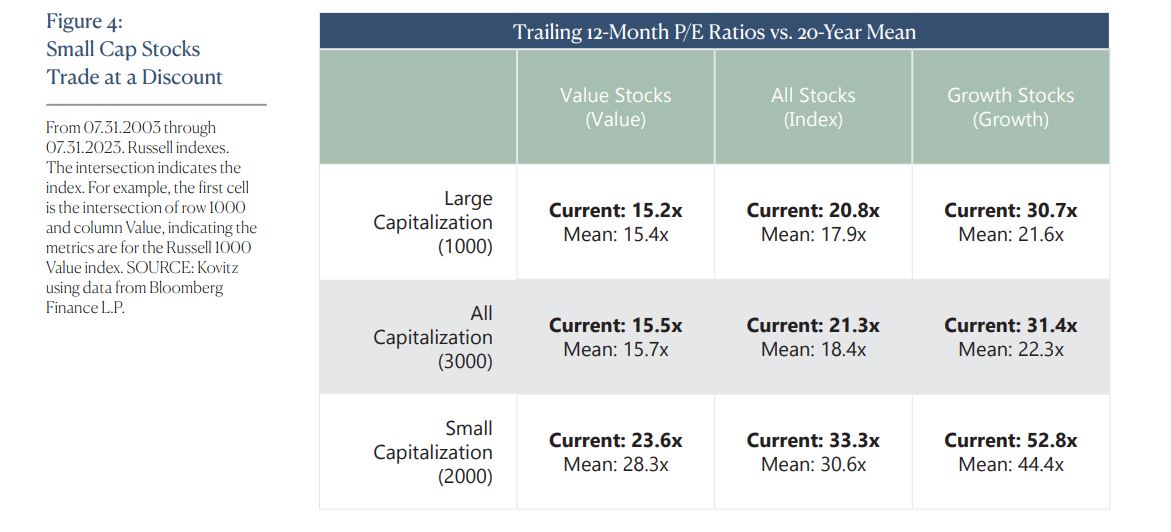
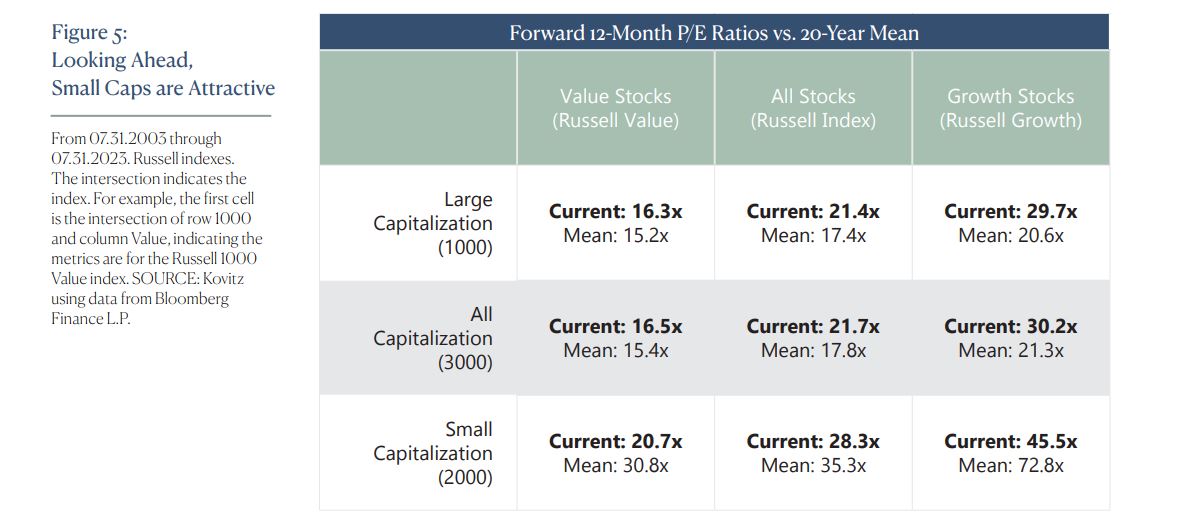
VALUE STOCK INDEXES ARE COMPARABLY CHEAP
The Russell 3000 (R3000) index is comprised of the 3,000 largest U.S. companies by market capitalization and represents approximately 98% of the investable U.S. equity market. Sub-indexes include the Russell 1000 (largest 1,000 stocks in the R3000 index) and the Russell 2000 (smallest 2,000 in the R3000 index). Each index has a Value subset (companies with higher book-to-price ratios and lower growth values) and a Growth subset (companies with lower book-to-price ratios and higher growth values). In Figure 4, we offer the latest trailing price-to-earnings (P/E) figure and the corresponding 20-year average. The same goes for Figure 5, but instead it uses the forward P/E ratio, which takes into account analyst earnings estimates for the upcoming year. As a group, Value stocks remain near their long-term average valuations, while Growth stocks are planted significantly above their long-term valuation averages. We hear the stock market is very expensive. Fortunately for Value fans, the metrics are much closer to their historical norms and our focus is on stocks that look even less expensive than the indexes.
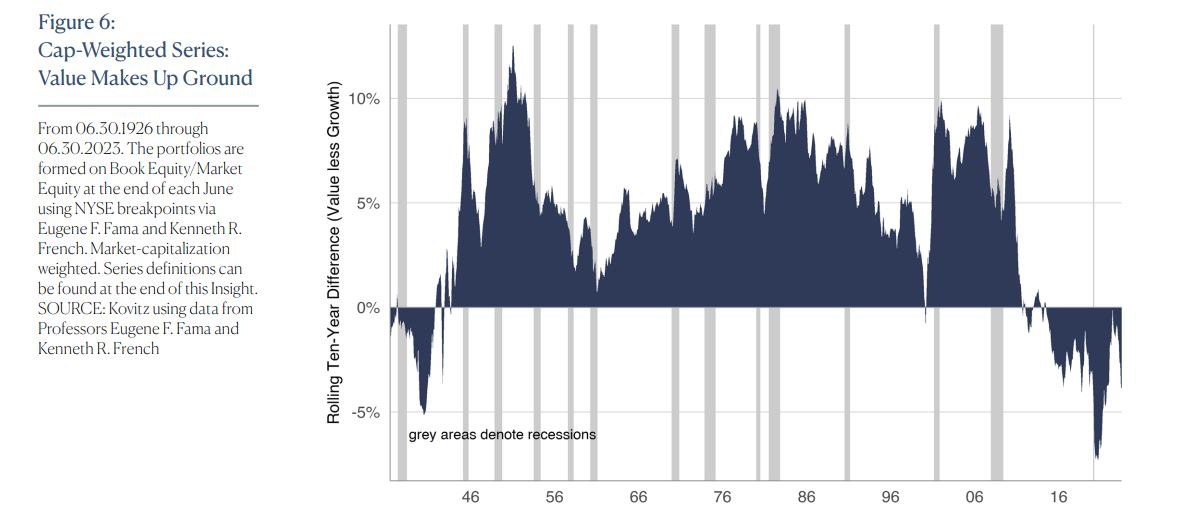
VALUE STOCKS HAVE LONG ENJOYED PLENTY OF SUNSHINE
The performance difference between Value stocks and Growth stocks for any rolling ten-year period had never been as wide as it was at the beginning of the pandemic. The chart in Figure 6 shows Value underperformance has been a rare phenomenon over the last nine decades, at least on a market-capitalization-weighted basis, where large stocks have outsized impacts on performance.
TREAT ALL OF THE KIDS EQUALLY
To solve the issue where big companies with big weights skew returns, the good Professors Fama and French crunched their Value/Growth numbers on equal-weighted portfolios. We argue equal-weighted series are better representations of average Value and Growth stock returns, compared with the capitalization-weighted counterparts. The equal-weighted series in Figure 7 shows Value stocks had reclaimed their lead on Growth stocks but it is now a dead-heat.
IN SEARCH OF VALUE STOCKS
In our view, Value investors endeavor to buy a dollar bill for $0.50, and if we’re lucky some will grow to be worth more dollars in the future. For Growth investors, the current price one pays today tends to take a back seat to whether metrics like revenue, earnings, customers, et cetera are expected to grow at a satisfactory rate.
Should things go better than initially planned, it is certainly possible that we might continue to hold some investments as they periodically extend into the Growth end of the spectrum. Nevertheless, we appreciate the additional margin of safety that comes from buying stocks that are discounted and have great potential to grow, rather than depending on growth alone.
If only the dividing line between Value and Growth was as simple as Professors Fama and French offer in their seminal work. Because the effort to uncover Value stocks is not clean-cut, we utilize a diversified set of metrics (covering factors like income, cash flow and financial health) and in-house quantitative algorithms to sort through time series data for thousands of stocks each day to form the foundation for our TPS Portfolio, ValuePlus, Dividend Income and Small-Mid Dividend Value strategies. We believe distillation of a broad opportunity set into a consolidated list of Value stocks is analogous to “fishing in the appropriate pond.” And once the appropriate short-list is determined, we scrutinize individual equities on a multitude of company-specific factors the algorithms don’t assess. The result aligns with our view that there’s a pocket of Value in any market environment and we remain focused on uncovering bargain-priced stocks with significant appreciation potential.
24 VALUE STOCK PICKS
For a list of 24 Value stocks based on their attractive fundamental metrics and our analysis of their business prospects, click here.
For additional information about subscribing to the The Prudent Speculator newsletter, please call Phil Edwards at 800.258.7786 or email pedwards@kovitz.com.
For more details about our wealth management and asset management services, kindly reach out to:
Jason Clark, CFA
Principal, Portfolio Manager
949.424.1013
jclark@kovitz.com