With Small Cap stocks stuck in neutral this year from a performance standpoint, we thought it was worthwhile to refresh last year’s report on this still-undervalued subset of the stock market. Large Cap stocks have marched higher lately, propelled by a handful of A.I.-oriented companies like Nvidia and Microsoft (MSFT).
Smaller stocks, which are less concentrated around A.I. (and Technology overall), have not kept pace with the big-company advance. Of course, we aren’t complaining about the A.I. megatrend; our broadly diversified portfolios have benefited handsomely, but investor (and broad market index) allocations have shifted out of balance given the performance differences, meaning the historical performance advantage and diversification benefits from Small Cap stocks are likely to be underappreciated when the winds change.
Historical Evidence
We continue to find value in all market-cap strata, but think it’s worth focusing on the reasonable price metrics and generous dividend yields of smaller-cap stocks for at least part of one’s overall allocation. To make for easier access to the pocket of value, we launched a Small-Mid Dividend Value strategy in 2015 with a dual mandate: capital appreciation and income generation.
Revenue and Earnings Growth
Large Cap stocks get a lot of fanfare. Microsoft, Apple (AAPL) and Nvidia each have market capitalizations in the $3 trillion range. Apple had $383 billion of revenue in 2023 and $97 billion of profit, the latter of which is larger than the entire market value for all but 96 companies in the Russell 3000 index. Such figures turn heads and garner grand headlines, but there is an entire subset of investable stocks that get far less attention but are potentially more valuable in a diversified portfolio.
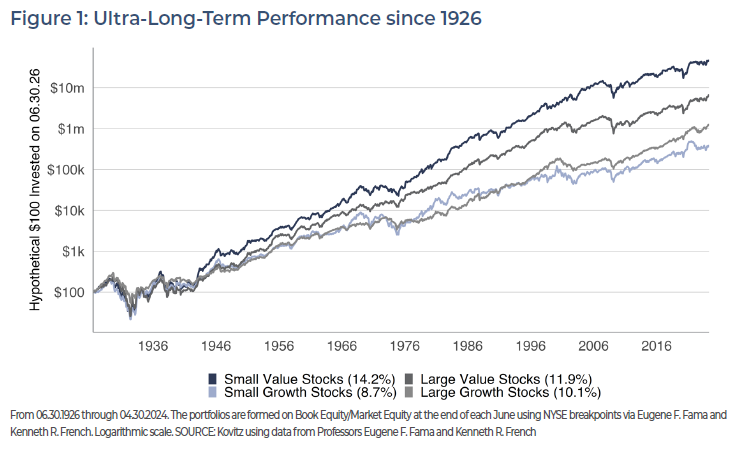
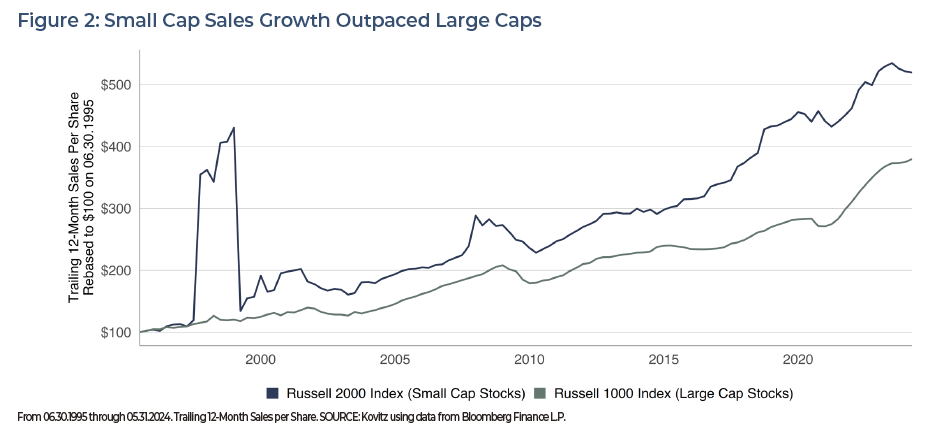
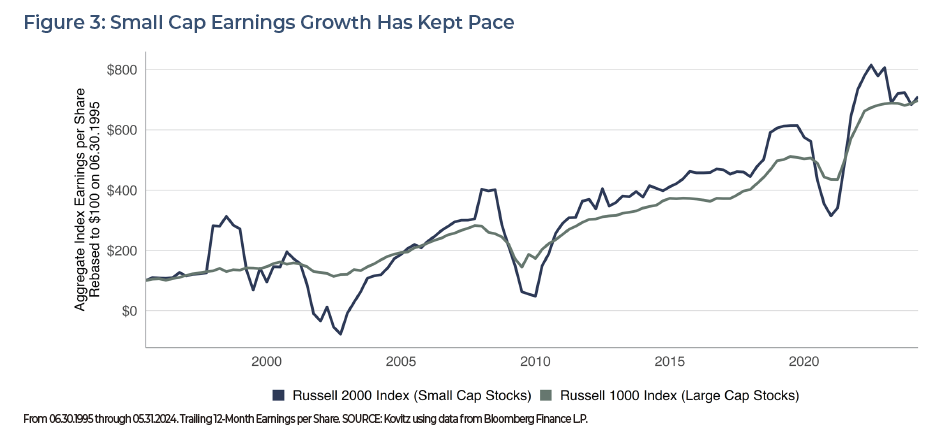
Figures 2 and 3 show Small Cap stocks have grown their sales and earnings at a faster clip than Large Cap stocks, at least since Russell started publishing index-level data in 1995. Admittedly, Large Caps have tended to be more profitable, which is reflected in the narrower gap between the indexes on the earnings chart (Figure 3) compared with the sales chart (Figure 2). Still, investors looking for corporate growth at reasonable valuations should take a hard look at Small Cap stocks, although a relative scarcity of data will make evaluating the Small Cap opportunity set a more challenging endeavor. As such, we rely on our quantitative framework to ensure we are fishing in the Value pond and regularly generating new ideas.
Dividend Growth
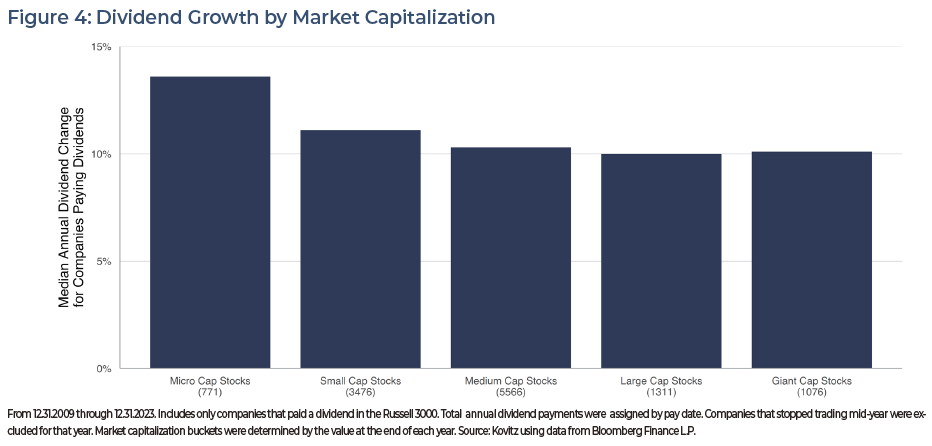
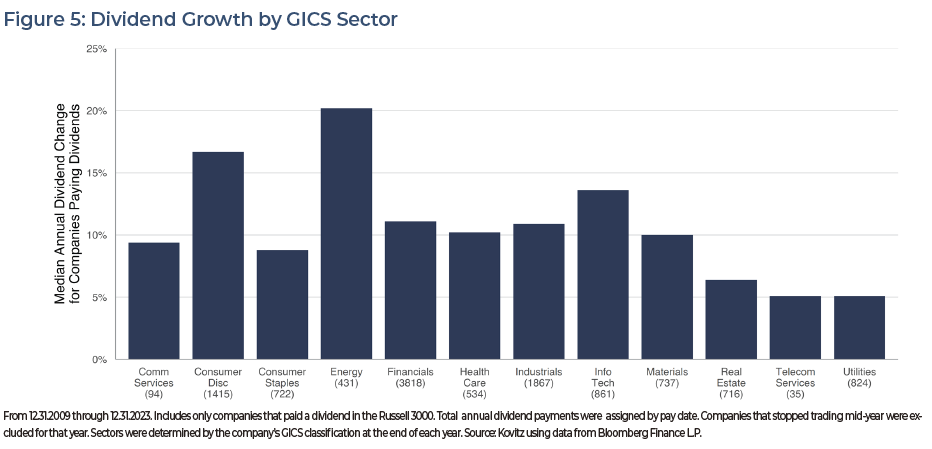
Larger companies tend to be given credit for their business’ maturity, allowing them to build up balance sheet cash to fund growth projects, buy back common shares and pay dividends to investors. Smaller companies are not necessarily knocked for their dividend payment programs or strong balance sheets, but investors often jump to conclusions about corporate stability by looking at a company’s size.
In Figures 4 and 5, we crunched numbers for nearly 2,500 dividend-paying companies between 2009 and 2023 and found that dividend hikes in Small Cap and Micro Cap stocks outpaced Large Cap and Giant Cap hikes, while increases in payouts vary by Sector, indicating that well-selected smaller companies are a great place to search for yield growers. The theme carries over to the broad index level. The average yield for dividend-paying Small Caps is 4.2% (Russell 2000 index), 2.6% higher than that of dividend-paying Large Caps (Russell 1000 index). We also note the broad indexes do not target dividend-payers specifically. As of May 31, 76% of Large Cap and 50% of Small Cap constituents paid a dividend over the past year.
Domestic Focus
A strong U.S. dollar has been cutting into revenue and profitability figures for larger U.S.-based companies as the value of sales and earnings made in euros, pounds and other currencies are worth less after translations back into greenbacks. With persistent inflation also a headwind in many global markets and corporate profit margins for many multinational companies under pressure, the inclusion of exposure to U.S.-centric companies would seem to be of particular interest.

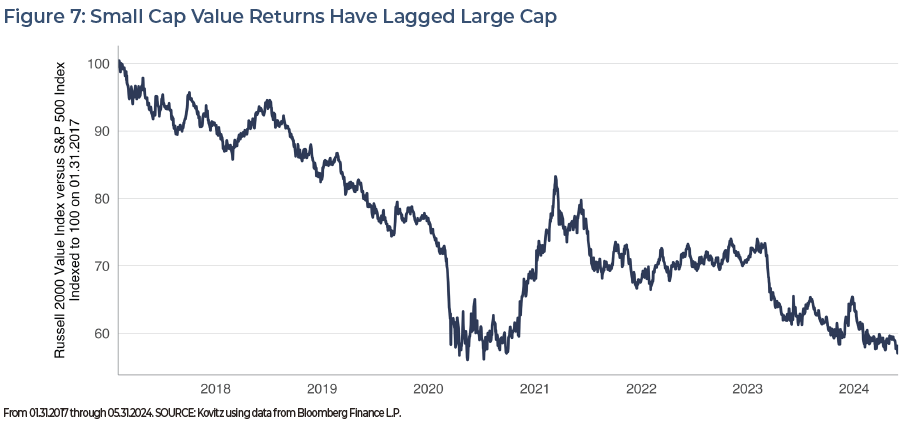
Recent History – Small vs. Large Returns
Pivoting to the Value version of the Russell 2000 index, investors have seen the performance gap between the Small Cap Russell 2000 Value index (with market caps between $11 million and $19.3 billion on May 31) and the Large Cap S&P 500 index widen over the past six-plus years. The tide started to turn in Q4 2020, but has expanded again recently, offering new opportunity to add Small Cap exposure to one’s asset allocation.
Differentiated Exposure
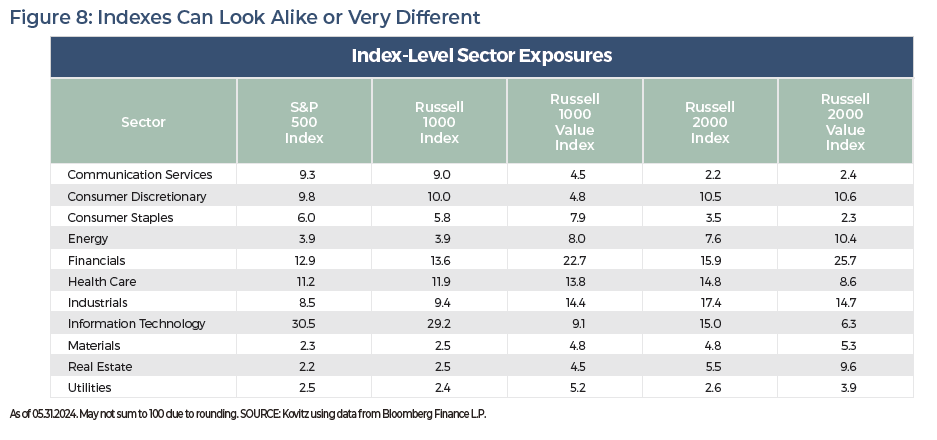
Exposure overlap can be problematic for investors and often goes unnoticed. Diversification, often referred to as the only free lunch in investing, refers to the practice of spreading out investments across multiple assets, such that the bumps along the path to investment success are smoothed out. We have long found the diversification juice is worth the squeeze and we can see why an investor might consider themselves to be more diversified holding both a S&P 500 ETF and a Russell 1000 ETF, rather than picking one. After all, they are different vehicles covering different indexes.
However, Figure 8 shows the sector-level exposures are effectively the same. An investor would find a much larger diversification benefit holding an S&P 500 ETF plus a Russell 2000 ETF or Russell 2000 Value ETF because of the reduction in overlap. The additional diversification, in conjunction with fundamental and total return benefits, leads us to believe that Small Caps serve as an attractive slice of an investor’s overall allocation.
Small Cap Stocks Deserve A Spot in Your Portfolio
We think there’s a lot to like about Small Cap stocks, especially those that reside in the Value camp and pay dividends. While the preceding analysis uses broad indexes to cast the widest possible net, we do sleep better at night with the knowledge that the metrics on our managed account portfolios generally are far less expensive than those of the major market averages and are even priced more favorably than nearly all the Value indexes. The Small-Mid Dividend Value (SMID) strategy’s forward P/E is 11.6x, compared to the 21.2x figure for its Russell 2000 Value benchmark and the 21.8x multiple for the S&P 500. What’s more, SMID’s estimated dividend yield is 2.9%, compared with the benchmark’s 2.3% yield and the S&P 500’s 1.4% figure.
Efforts to augment our comprehensive wealth management services frequently turn up valuable investment opportunities for our clients and future clients. The Small-Mid Dividend Value strategy is a product of such research, and it has been a live portfolio for nearly a decade, endeavoring to offer the benefits we’ve highlighted in this report when included as part of an investor’s asset allocation.
For more than four decades, we have collaborated with our clients in their investment decision-making process as they pursue their long-term financial goals. We are committed to keeping your goals, concerns and attitude about investing at the heart of your plan. If you’re ready to experience our personalized investment approach and exceptional client service, contact
Jason R. Clark, CFA at 949.424.1013 or jclark@kovitz.com.
Kovitz Investment Group Partners, LLC (“Kovitz”) is an investment adviser registered with the Securities and Exchange Commission. This report should only be considered as a tool in any investment decision and should not be used by itself to make investment decisions. Opinions expressed are only our current opinions or our opinions on the posting date. Any graphs, data, or information in this publication are considered reliably sourced, but no representation is made that it is accurate or complete and should not be relied upon as such. This information is subject to change without notice at any time, based on market and other conditions. Past performance is not indicative of future results, which may vary.